
Shaheed Ahmad
Solutions Architect
Chose Progress Telerik
Rich UI, lot of ready to use themes/css. ASP.NET has very limited capabilities compare than telerik.
| Product | Rating | Most Used By | Product Summary | Starting Price |
|---|---|---|---|---|
 Tableau Desktop | N/A | Tableau Desktop is a data visualization product from Tableau. It connects to a variety of data sources for combining disparate data sources without coding. It provides tools for discovering patterns and insights, data calculations, forecasts, and statistical summaries and visual storytelling. | $1,380 per year (purchased via a Creator license) | |
 Progress Telerik | N/A | With Telerik UI libraries, Progress aims to equip .NET ninjas with a full arsenal of weapons, helping to create beautiful, modern and future-proof applications quickly and intuitively. The vendor states that with its over 1,250 UI components for all .NET platforms, as well as various themes, skins and customization options, Telerik users report cutting development time by up to 50 percent. Web | $999 per developer, royalty-free |
| Tableau Desktop | Progress Telerik | |||||||||||||||
|---|---|---|---|---|---|---|---|---|---|---|---|---|---|---|---|---|
| Editions & Modules |
|
| ||||||||||||||
| Offerings |
| |||||||||||||||
| Entry-level Setup Fee | No setup fee | No setup fee | ||||||||||||||
| Additional Details | All pricing plans are billed annually. A Creator license includes Tableau Desktop, Tableau Prep Builder, and Tableau Pulse. Discounts sometimes available for volume. | — | ||||||||||||||
| More Pricing Information | ||||||||||||||||
| Tableau Desktop | Progress Telerik | |
|---|---|---|
| Considered Both Products |  Tableau Desktop No answer on this topic | Progress Telerik Shaheed Ahmad Solutions Architect Chose Progress Telerik Rich UI, lot of ready to use themes/css. ASP.NET has very limited capabilities compare than telerik. |
| Tableau Desktop | Progress Telerik | |||||||||||||||||||||
|---|---|---|---|---|---|---|---|---|---|---|---|---|---|---|---|---|---|---|---|---|---|---|
| BI Standard Reporting |
| |||||||||||||||||||||
| Ad-hoc Reporting |
| |||||||||||||||||||||
| Report Output and Scheduling |
| |||||||||||||||||||||
| Data Discovery and Visualization |
| |||||||||||||||||||||
| Access Control and Security |
| |||||||||||||||||||||
| Mobile Capabilities |
| |||||||||||||||||||||
| Application Program Interfaces (APIs) / Embedding |
|
| Tableau Desktop | Progress Telerik | |
|---|---|---|
| Small Businesses |  Yellowfin Score 8.7 out of 10 |  Syncfusion Essential Studio Score 6.7 out of 10 |
| Medium-sized Companies |  Reveal Score 10.0 out of 10 |  React (React.js) Score 8.8 out of 10 |
| Enterprises |  Kyvos Semantic Layer Score 9.5 out of 10 | React (React.js) Score 8.8 out of 10 |
| All Alternatives | View all alternatives | View all alternatives |
| Tableau Desktop | Progress Telerik | |
|---|---|---|
| Likelihood to Recommend | 8.8 (203 ratings) | 9.4 (44 ratings) |
| Likelihood to Renew | 7.5 (41 ratings) | 10.0 (5 ratings) |
| Usability | 8.3 (73 ratings) | 9.0 (30 ratings) |
| Availability | 10.0 (11 ratings) | - (0 ratings) |
| Performance | 8.0 (10 ratings) | - (0 ratings) |
| Support Rating | 1.0 (57 ratings) | 9.3 (28 ratings) |
| In-Person Training | 9.4 (4 ratings) | - (0 ratings) |
| Online Training | 8.0 (5 ratings) | - (0 ratings) |
| Implementation Rating | 8.0 (34 ratings) | 9.0 (3 ratings) |
| Configurability | 7.0 (3 ratings) | - (0 ratings) |
| Ease of integration | 10.0 (1 ratings) | - (0 ratings) |
| Product Scalability | 9.0 (4 ratings) | - (0 ratings) |
| Vendor post-sale | 10.0 (1 ratings) | - (0 ratings) |
| Vendor pre-sale | 10.0 (1 ratings) | - (0 ratings) |
| Tableau Desktop | Progress Telerik | |
|---|---|---|
| Likelihood to Recommend | Tableau
 Karol Kozłowski Project manager | Progress Software Corporation
|
| Pros | Tableau
 Afia Tamanna Information Technology Business Consultant | Progress Software Corporation
|
| Cons | Tableau
| Progress Software Corporation
|
| Likelihood to Renew | Tableau
| Progress Software Corporation
|
| Usability | Tableau
 Al Mubassir Muin Software Engineer | Progress Software Corporation
|
| Reliability and Availability | Tableau
 Brad Llewellyn Associate Data Analytics Consultant | Progress Software Corporation No answers on this topic |
| Performance | Tableau
| Progress Software Corporation No answers on this topic |
| Support Rating | Tableau
| Progress Software Corporation
 Doug Thompson Full Stack Senior Developer |
| In-Person Training | Tableau
 Jon Boeckenstedt Associate Vice President | Progress Software Corporation No answers on this topic |
| Online Training | Tableau
| Progress Software Corporation No answers on this topic |
| Implementation Rating | Tableau
 David Fickes Decision Sciences - Modeling, Simulation & Analysis | Progress Software Corporation
|
| Alternatives Considered | Tableau
| Progress Software Corporation
|
| Scalability | Tableau
| Progress Software Corporation No answers on this topic |
| Return on Investment | Tableau
| Progress Software Corporation
|
| ScreenShots | Progress Telerik Screenshots     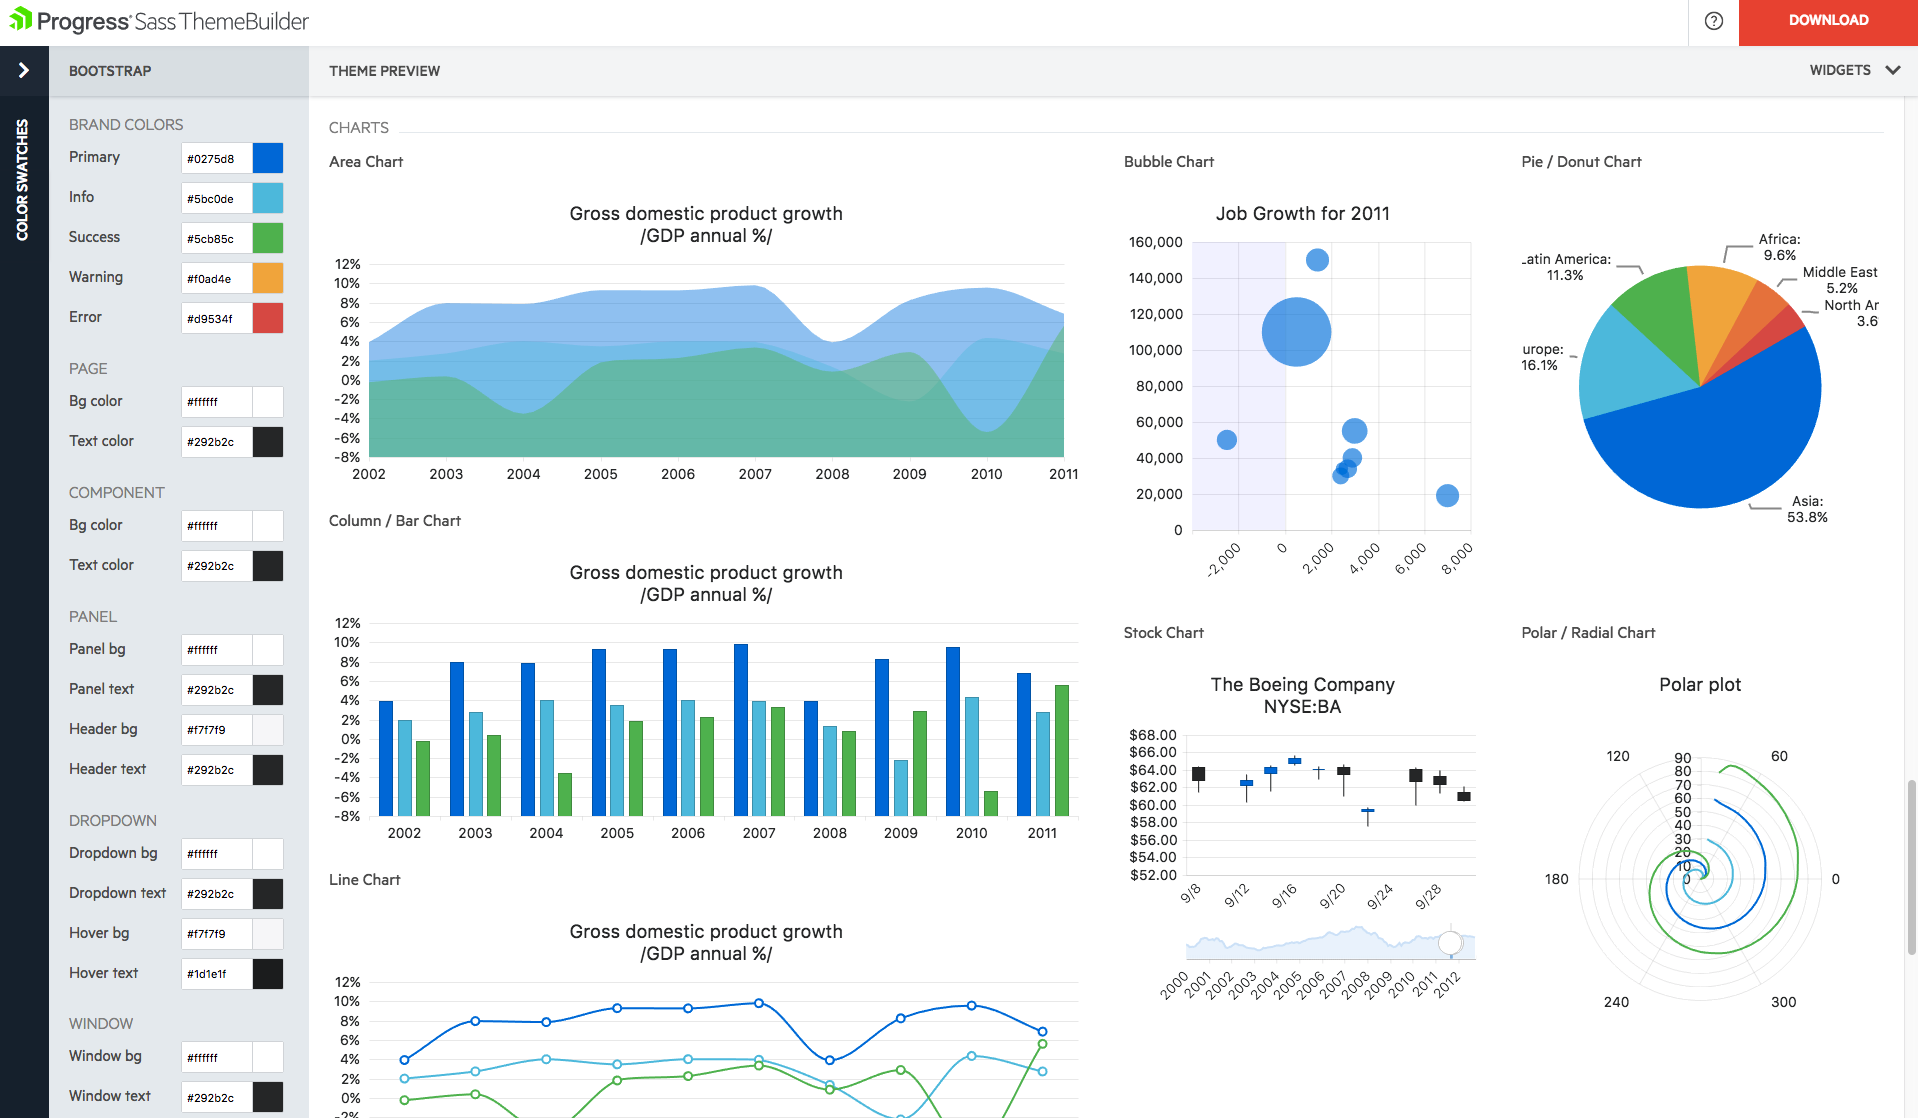 |