Amplitude Analytics is an analytics platform for mobile and web. It is designed to help organizations segment users and analyze funnels, retention and revenue. Amplitude Analytics helps product marketers to achieve actionable insights from customer digital journeys and uses behavioral graphs to build customer-focused products. Amplitude also optimizes digital products for increased quality engagements, increased conversion rates, and long-term customer loyalty.
$49
per month (paid annually)
Chartbeat
Score 9.1 out of 10
N/A
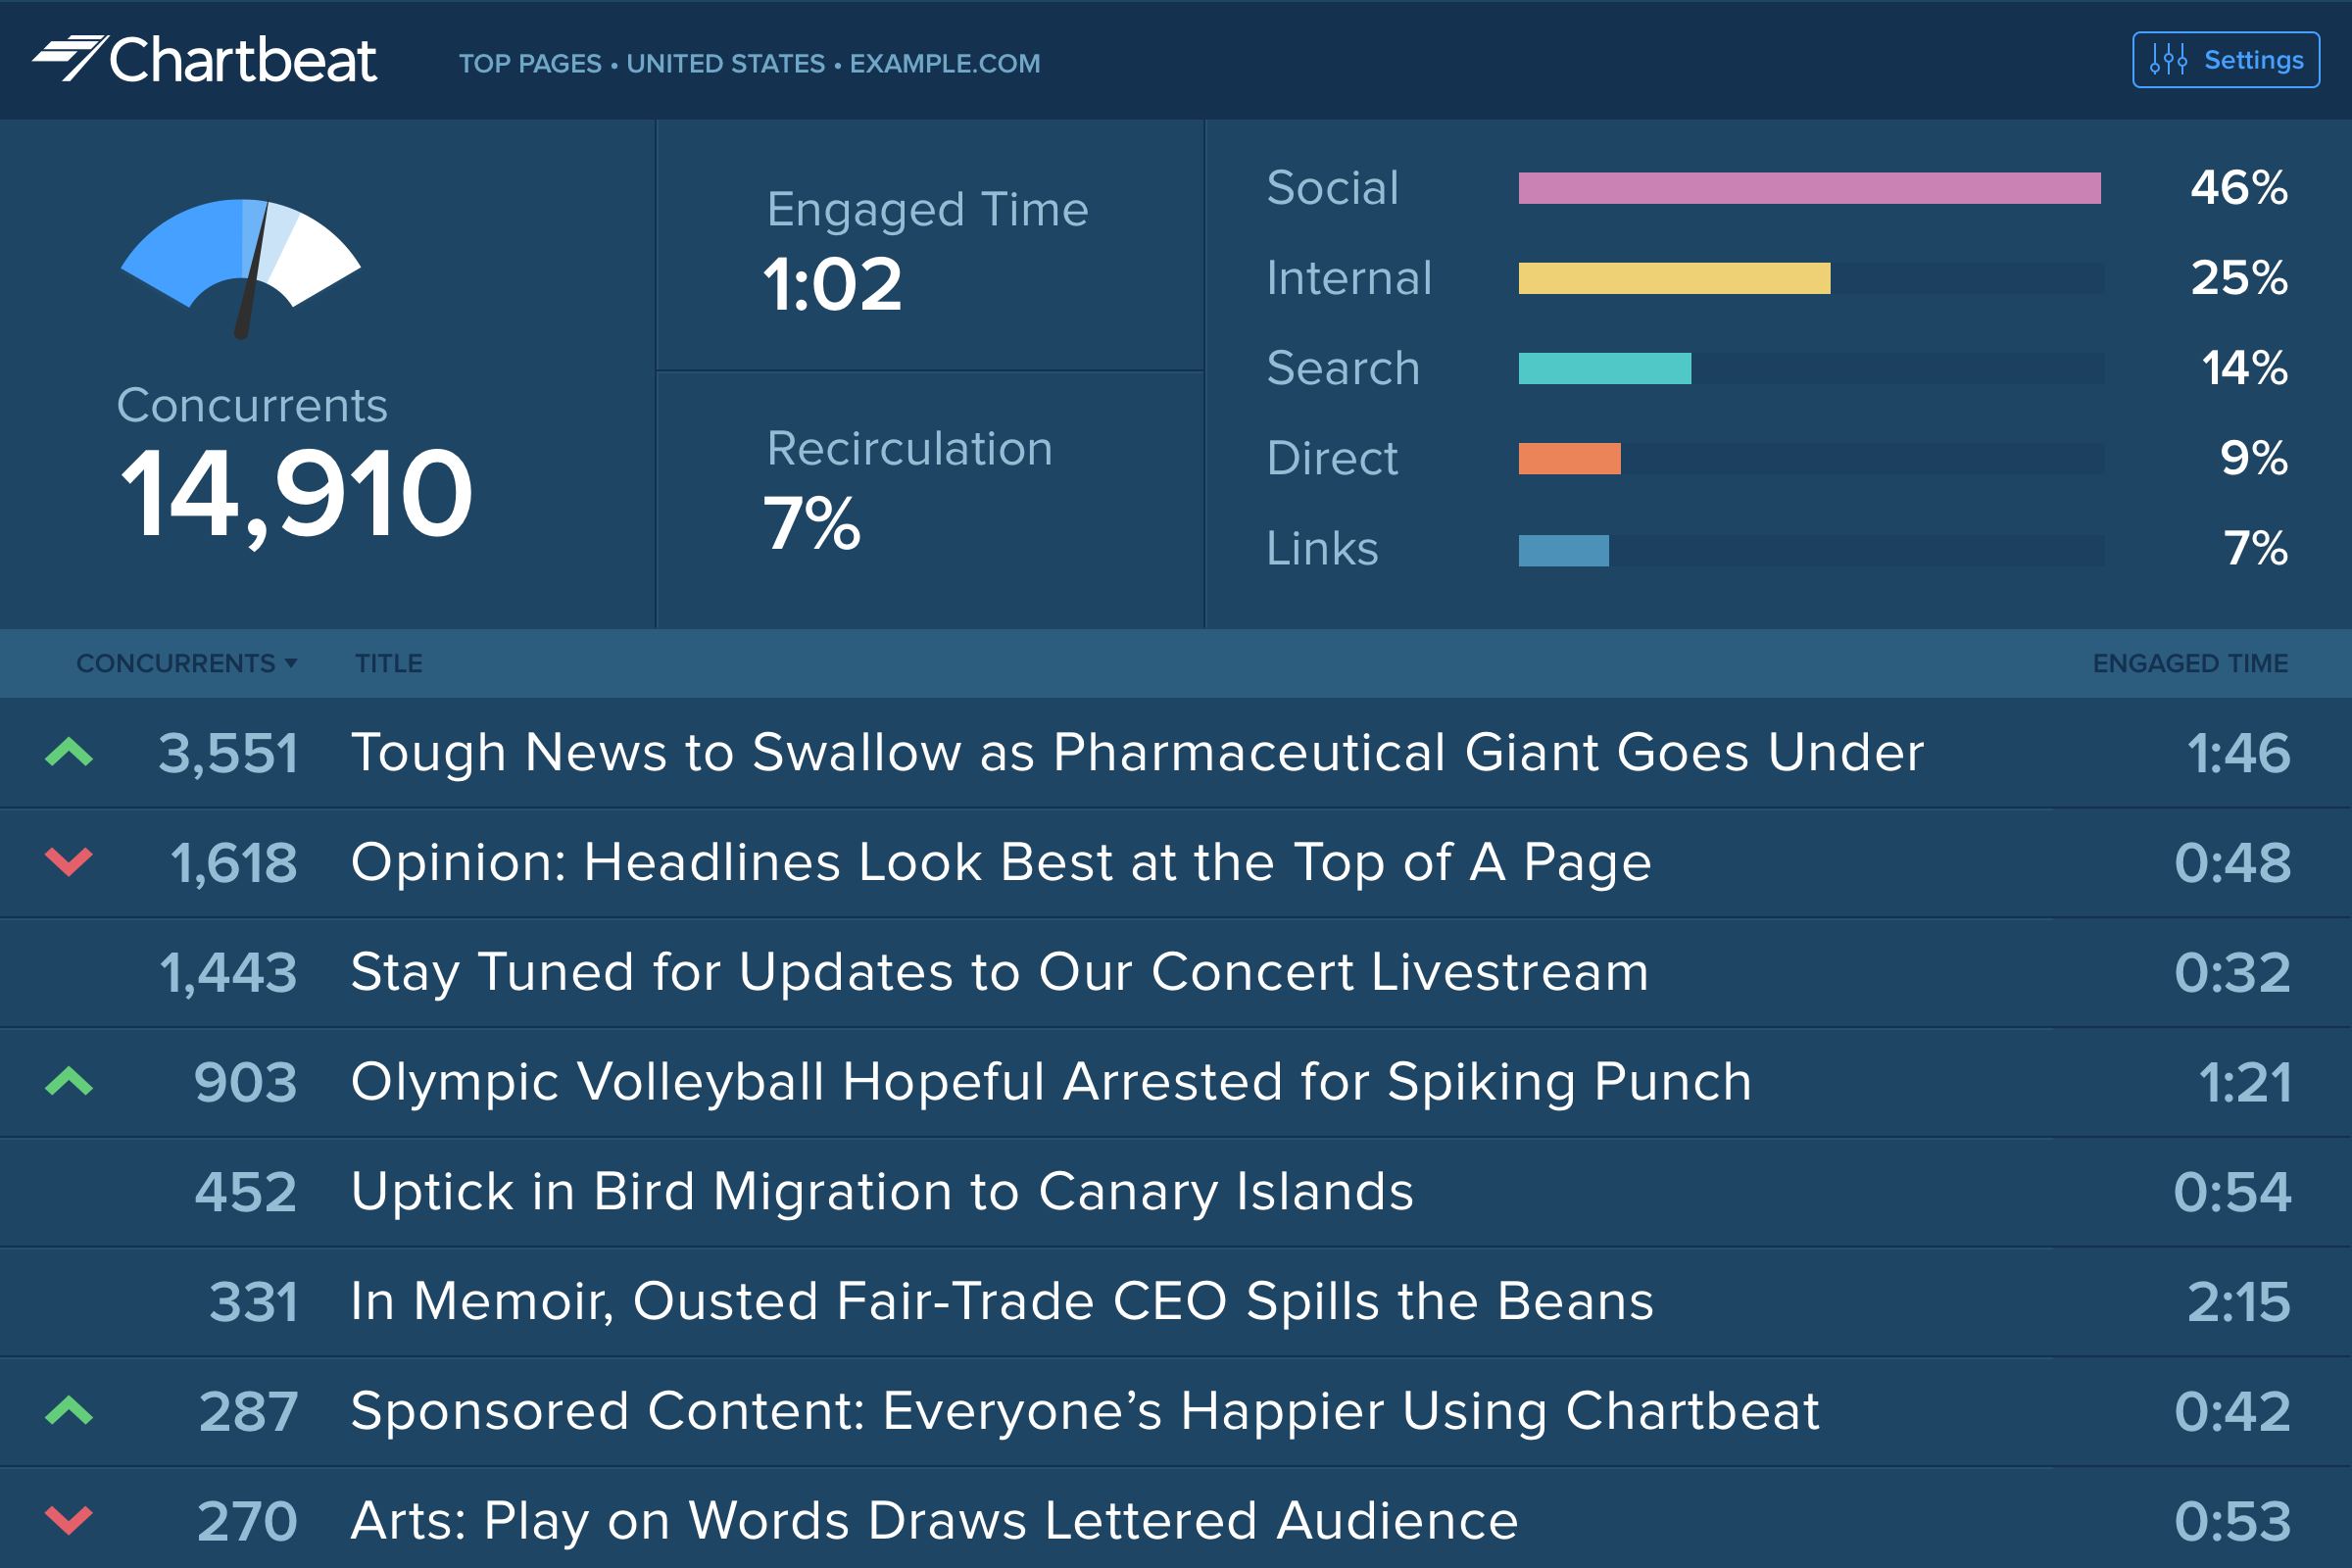
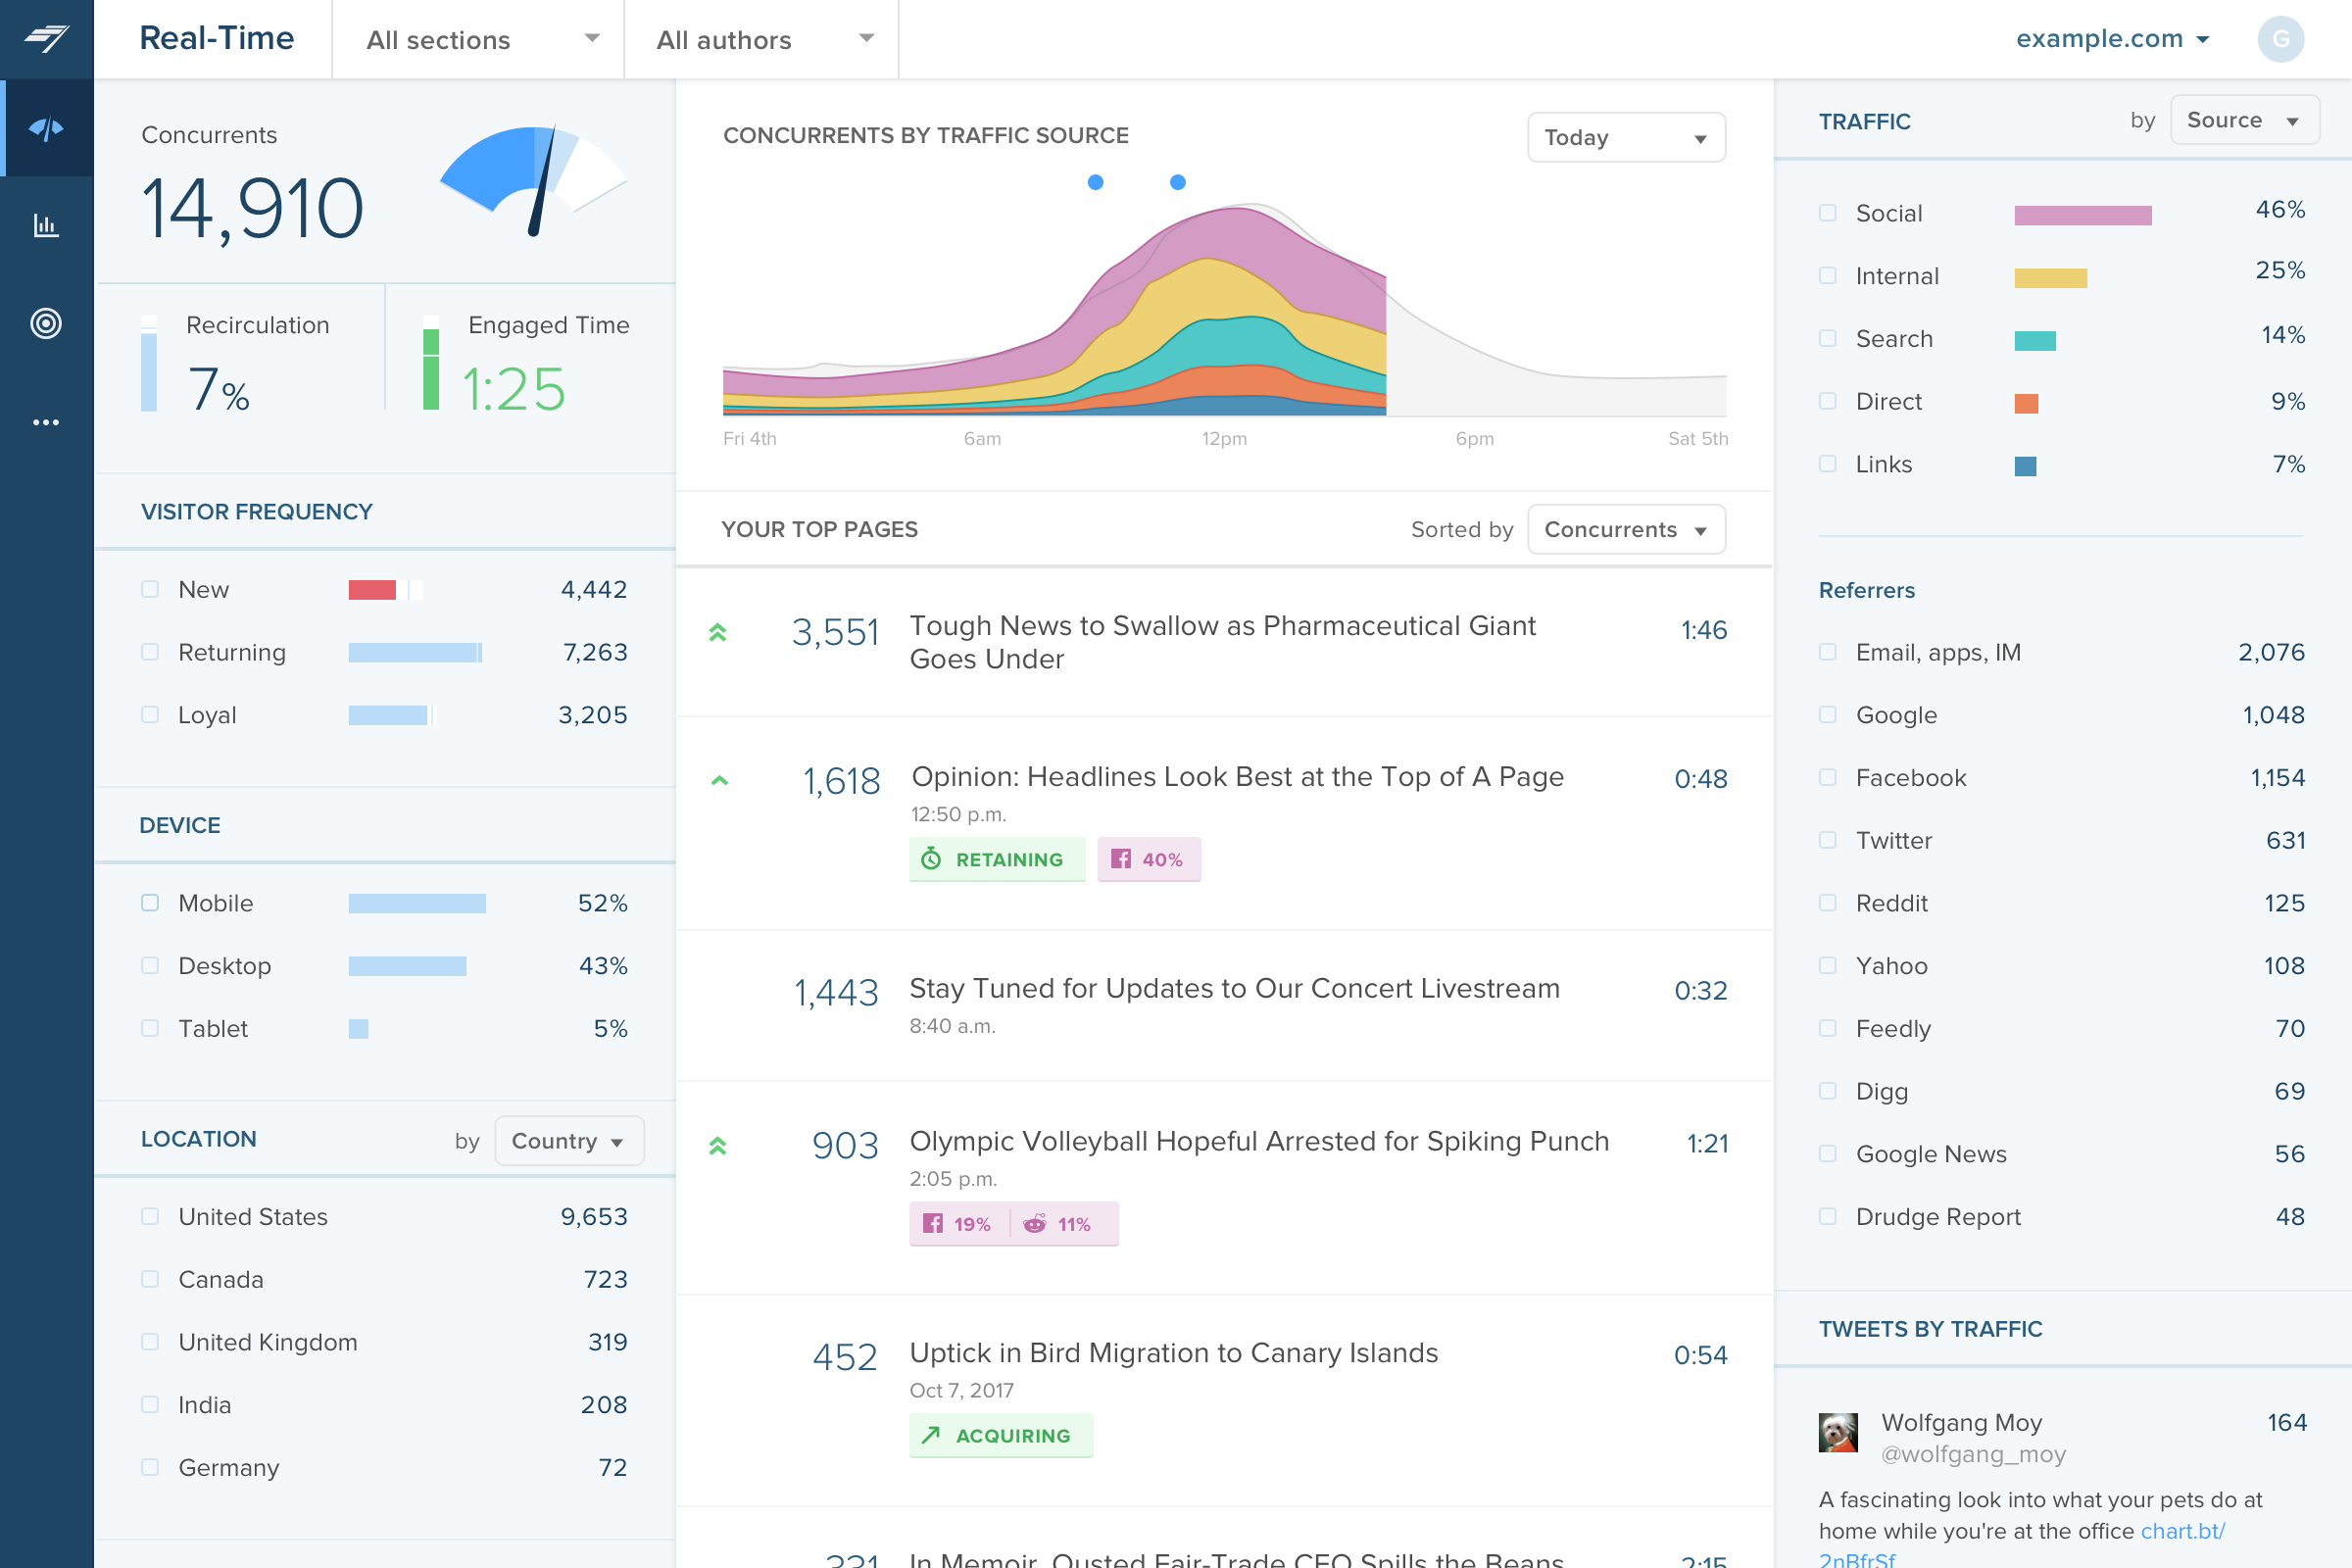
Chartbeat delivers real-time analytics, insights, and transformative tools for content teams around the world, to help improve audience engagement, inform editorial decisions, and increase loyalty.
N/A
Pricing
Amplitude Analytics
Chartbeat
Editions & Modules
Plus
$49
per month (paid annually)
Growth
Contact Sales
Enterprise
Contact Sales
Starter
Free
No answers on this topic
Offerings
Pricing Offerings
Amplitude Analytics
Chartbeat
Free Trial
No
Yes
Free/Freemium Version
Yes
No
Premium Consulting/Integration Services
No
No
Entry-level Setup Fee
No setup fee
No setup fee
Additional Details
—
Chartbeat pricing is based on monthly site page views. Discounts are applied to multi-year contracts. The Basic Plan includes the Real-time Dashboard, Historical Dashboard, Heads Up Display, Reports, Big Board, iOS and Android app, and Real-time API endpoints.
The Plus Plan includes all of the Basic Plan features, plus ONE of the following Premium features: Headline Testing, Advanced Queries, or Multi-Site View.
The Premium Plan includes all of the Basic Plan features, plus ALL Premium features: Headline Testing, Advanced Queries, Multi-Site View, and enterprise-level support and custom trainings.
Amplitude Analytics is a robust platform that can take your data reporting beyond what's currently capable in GA. Heap is a great intermediate tool, that takes data analysis a step further and is an excellent product in it's own right. Mixpanel is the most comparable both have …
Mixpanel was the top competitor to Amplitude when my organization was reviewing analytics tools. We went with Amplitude because it was more robust when it came to experimentation features and proactive insights. Amplitude also had an edge in team collaboration and data …
Amplitude provides better capabilities to consume real time event data and provide meaningful insights compared to other products like Mixpanel. It also provides better data governance capabilities to maintain accurate and high data quality.
I think i am not the only one who loves it and want to stay with it. Go see for yourself. This really is a good one and the rest are good but i see that they lack productivity
Amplitude Analytics provides much more granular data than Google Analytics and gives you much more flexibility in how you can segment and splice the data. It also provides the ability to create closed funnels, which I have yet to find out how to do in Google Analytics. …
Amplitude Analytics & Mixpanel are both evenly matched in terms of features and value. Amplitude Analytics scores better in terms of conversion drives and cohort analysis in my opinion. In addition to that, Amplitude Analytics has done a lot more in terms of guiding …
It's the best in class with all the bells and whistles. Other options could suit you just fine at a lower price point, but you need to be sure of what you are not getting and the switching cost associated with when you do need it.
I think Adobe Analytics is ok for web analytics but just not nearly as good as Amplitude for mobile apps. I much prefer the Amplitude user experience. I think that it is much more well-designed for use with mobile apps and easier to set up the dashboards I need in order to …
Amplitude has more advanced reporting whereas Mixpanel is mostly a “do-it-all” analytics tool. Choose Amplitude if you have enterprise-level marketing/users. Choose Mixpanel if you want to send notifications.
I would say it's largely different; Looker was able to be embedded directly into the platform and was valuable for people creating their own dashboards whereas Amplitude is more valuable for understanding usage, performance, and health of the platform itself -- more for …
Amplitude Analytics has a better database than Adobe Analytics. Amplitude Analytics works a lot faster and is much easier to work with than the Splunk tool.
I find Amplitude much easier to use than Mixpanel or GA are. The UX is easy to grasp and as long as you have an intuitive set-up or good documentation on how your events are set up it makes for quick onboarding. Looker does a better job of easily allowing customization with SQL …
Amplitude is easy to implement and simple as compare to Adobe analytics(AEM)although there is a vast difference in terms of UI, functionality and cost. Most of the user specially product team like Amplitude as compare to AEM.
A lot of data can be tracked via manual tracking or linking to an excel sheet, but with such a huge amount of data, it is far easier to have all of it laid out in an easy to read format. The charts and graphs are easy to use and are really pretty user-friendly. The hardest part …
Amplitude Analytics is an easier tool to use. It requires less knowledge of SQL and as long as you have notions of data analysis and retrieving data in general. It is much more user-friendly and allows for easy and quick reporting. It can be used by different teams and …
We've used a ton of analytics tools and Amplitude allows us to do everything we need for free. The other options we tried were either not robust enough to report on user level stats, or cost $. The platforms in this space are super competitively aligned so functionality wise …
We use Chartbeat in conjuction with these tools. Chartbeat is forward facing and we encourage everyone in the newsroom to use it. It provides the best live view, but lacks depth needed for more longer-term trend reporting and analysis. Domo allows much more advanced data …
Google Analytics 360 had problems, but after it was discontinued, Google Analytics became a shell of its former self. An added benefit of Chartbeat is that it's more "live" (looking at live concurrents rather than in the past however many minutes) and tells you how that number …
We use Chartbeat for real-time evaluation and Adobe Analytics for longer-term performance reporting. Chartbeat is easier to use overall, particularly for content producers. Researchers tend to rely on Adobe Analytics for their reports. We have found that we need to keep using …
Google Analytics has gradually become much more difficult to use, and much slower in its realtime reporting. It was the changes that came in with Google Analytics 4 that gave us the final push to work with Chartbeat - a product some of us were already familiar with from …
Omnilytics is more robust, detailed, and catered for an intermediate media user, while I think Chartbeat is a more user-friendly and beginner-oriented piece of technology. That being said, there is an impressive amount of lift for Chartbeat, and it's evident that simplicity is …
I used Parse.ly before I used Chartbeat. We shifted away from Parse.ly because it's social standing wasn't as good, it was mostly for site readership and we needed a bigger concentration on social media that Parse.ly couldn't provide. It's not listed, but we now use Social Flow …
Chartbeat stands out in terms of real-time tracking and information from which to manage homepages, I found this better than Smart Octo's equivalent. However, the ability to quickly explore past data does not go as deep as Google Analytics.
Chartbeat is better than GA when it comes to ease of use and immediacy. The homepage layover that Chartbeat offers is unique from what I've seen and gives me an instant knowledge of what's working on my site and how to best arrange it.
Other products like Chartbeat that I've used are Parse.ly, GA, and Omniture. Parse.ly is the only tool, in my opinion, that offers more real-time data, but the interface is lacking and isn't as intuitive as Chartbeat.
Chartbeat is certainly better at visualizing content and segmenting the data all on one screen. We can filter by section, author, channel and more without leaving the main dashboard page. Combining properties together in roll up groups is another key feature. We're able to …
I would highly recommend Amplitude to people in the product and business analytics domains who have a need for deep, data-driven insights into customer behavior, accessible in a self-service platform. Amplitude stands out in its comprehensiveness and flexibility; once events are implemented, there are a multitude of options to combine, track, form journeys, and dive deeper into user behavior. Though the barrier for entry is a little bit steep, Amplitude is more friendly to non-technical users than other business insight platforms, without compromising the effectiveness of the analysis tools. Amplitude may not be best suited for web marketing analytics - traffic, page views, etc - since it is more focused on full-platform product analytics.
It is well suited to keeping me toward a specified goal, and gives me concrete numbers and gives me an idea of what we need to do to meet our goals. It's less appropriate if you want something more than pageviews, and doesn't really do a lot for video views.
It provides me great answers about my critical questionnaire, by which I can easily explore behavioral data across any chart, persona, and cohort that are simple and intuitive to understand as they have made easy segmentation.
It offers its services for SQL queries due to which I have reduced the workload and save the time that was spent in finding out the technical aspects.
Source of traffic needs improvement. Search and social make sense, but "internal" and "links" is a grey area. It would be helpful to define those with an organization and provide an information icon so users can easily remember what each of those buckets is tracking.
More ways to customize the real-time board. For example, with video content, that's great that I can see a user has started a video, but what is the completion rate, was that only on O&O or can that track Facebook, too?
Would like to see demo (age) information included as a way to slice the data so I can see what's working with my older and younger demo.
Great product Good value for the cost/initiate Support docs and FAQs are great - they limit the necessity of reaching out to in-person support. So when you do call them ... it is for a legit question/issue, no just a "where is it" or a "how to I do xyz123?"
I gave Chartbeat a 5 for a renewal rating, because, while it delivers clear and understandable content, Google Analytics also provides many of the same features for free. For a small to medium website, I believe it would be more cost effective to use Google Analytics. A website with a high amount of traffic, however, could merit spending the money on Chartbeat to maximize their potential.
It's a fairly straightforward platform that's beginner friendly. The biggest usability hurdle is most often created by your own team, as it's imperative to know what event sources are being sent to Amplitude and what those event names are. Within being properly onboarded by a team member it can be hard to get started using Amplitude. It takes time to understand what data your company may be sending to the product, the naming conventions of events (especially if there are old or deprecated events names
Chartbeat is really pretty straightforward. The only things that may cause confusion are the string of sidebar features and tools at the left of the screen. I mostly use the big leader board in real-time and the historical feature (looking at the monthly or weekly performance of my team's content) and then generate reports automatically from there.
Alway up and running, or if there is a problem we can get back in the game right away. The reliability was a big selling point for me, and it was true when this company got it. Rollouts can be tough, but this was pretty seamless. Good support throughout the process, good documentation to handle questions/tips
No issues, problems, or negative remarks from us!! We had a plan, vendor support was rock solid, our data folks have experience, OCM supported as needed, and we got the rollout done on time, on budget, and with only minor hiccups. SInce the rollout, most of us have already forgotten the hiccups and generally speak highly of the product
I haven't used the Amplitude support other than their training docs so I can't speak too much to the in-person support but the docs are serviceable. Nothing too crazy but between the user tips, email notifications, and the decent number of docs I was able to get the support I needed to ramp up on the tool.
I have had limited experience of support for Chartbeat but whenever I have needed help it has been there. Recently there was an issue of seeing different forms of data in real time - app and otherwise effectively, and the issue was being clearly dealt with and communicated back to us.
Virtual Not bad considering the timeframe and turnaround. The biggest benefit was for my end-users to hear a voice (other than mine/ours! LOL) telling them about the new features and capabilities. The in-person training was really good for having an expert that knows the answers and could refer to past experiences, problems, solutions. THey were a great resource to ease the transition ... basically a "you are gonna be okay with this change ... you got this etc.!" kinda vibe
Good enough to get strong baseline. I always make sure our our users go to and/or focus on the vebndor-provided support docs rather than any formal training. Our instructors come and go, but written policy and how-to docs live much longer in a corporate setting. That said, the online training is sufficient. I like that the training curric is stacked and progressive.
My team members all have background as data analysts, so Amp was pretty easy to for them. There was sufficient online training available. We also used the available support documents. The actual rollout went well. We did significant testing beforehand. We did a phased rollout, with partial silent rollout (part of OCM's plan) for the smallest line of business. THe silent one was "silent" b/c it was done without fanfare or public notices ... it was just a "we're doing some things, it wont impact your work or workday
Amplitude Analytics is a robust platform that can take your data reporting beyond what's currently capable in GA. Heap is a great intermediate tool, that takes data analysis a step further and is an excellent product in it's own right. Mixpanel is the most comparable both have very similar reporting/dashboarding functionality. Amplitude can often be preferred by product and data engineering teams for it's ease of setup and impressive analytics displays.
Google Analytics has gradually become much more difficult to use, and much slower in its realtime reporting. It was the changes that came in with Google Analytics 4 that gave us the final push to work with Chartbeat - a product some of us were already familiar with from previous jobs. Things are just much harder to find in GA, and when time is always tight you can't afford to spend a long time looking for particular data - it should be quick and easy to locate
Like all the other grades, it was mostly an easy implementation ... we have experience people, the rollout in general is well planned, and the vendor was very supportive