Overview
ProductRatingMost Used ByProduct SummaryStarting Price
Bound
Score 10.0 out of 10
N/A
Bound (formerly Get Smart Content) is a website segmentation and targeting platform that enables marketers to read a website visitor's digital body language and serve relevant content based on the person's stage in the buying journey. Using behavioral, demographic, and firmographic data, Bound creates personalized web experiences for both anonymous and known website visitors to increase the effectiveness of marketing efforts and dramatically reduce the buyer's path to conversion. Bound partners…N/A
Chartbeat
Score 9.1 out of 10
N/A
Chartbeat delivers real-time analytics, insights, and transformative tools for content teams around the world, to help improve audience engagement, inform editorial decisions, and increase loyalty.N/A
Pricing
BoundChartbeat
Editions & Modules
No answers on this topic
Offerings
Pricing Offerings
BoundChartbeat
Free Trial
YesYes
Free/Freemium Version
NoNo
Premium Consulting/Integration Services
NoNo
Entry-level Setup FeeOptionalNo setup fee
Additional DetailsChartbeat pricing is based on monthly site page views. Discounts are applied to multi-year contracts. The Basic Plan includes the Real-time Dashboard, Historical Dashboard, Heads Up Display, Reports, Big Board, iOS and Android app, and Real-time API endpoints. The Plus Plan includes all of the Basic Plan features, plus ONE of the following Premium features: Headline Testing, Advanced Queries, or Multi-Site View. The Premium Plan includes all of the Basic Plan features, plus ALL Premium features: Headline Testing, Advanced Queries, Multi-Site View, and enterprise-level support and custom trainings.
More Pricing Information
Community Pulse
BoundChartbeat
Considered Both Products
Bound
Chose Bound
It has the inability to export subject line or ISP complaints that require manual pulling by each campaign when needed. Results from variable tests are also reported only as a percentage of chosen KPI (opens, clicks, etc.). There's no ability to see hard numbers from the tests …
Chose Bound
Get Smart Content is what we primarily use to serve up segmented content. The only other method or tool we've used to do so while leveraging our Demandbase variables is Optimizely. We selected Get Smart Content because they make the process of segmentation using Demandbase …
Chose Bound
Get Smart Content is quite cost effective, simple to use with great support. The support systems and simplicity based on other products used and evaluated is the best in the industry.
Chartbeat
Chose Chartbeat
We use Chartbeat in conjuction with these tools. Chartbeat is forward facing and we encourage everyone in the newsroom to use it. It provides the best live view, but lacks depth needed for more longer-term trend reporting and analysis. Domo allows much more advanced data …
Chose Chartbeat
Google Analytics 360 had problems, but after it was discontinued, Google Analytics became a shell of its former self. An added benefit of Chartbeat is that it's more "live" (looking at live concurrents rather than in the past however many minutes) and tells you how that number …
Chose Chartbeat
Chartbeat gives data in real time while Google has an analysis time. Furthermore, the tool is much easier and more intuitive to use.

O Chartbeat dá o dado em temporeal enquanto o Google tem um tempo de análise. Além disso, a ferramenta é de manuseio muito mais fácil e intuitiva.
Chose Chartbeat
Much easier to use and understand than GA4. We tested Marfeel, but felt Chartbeat was so good there was no reason to change.

I still feel like our audit is still based on GA4 so we do have to still pay attention to that.
Chose Chartbeat
Chartbeat's heads up display feature allows the newsroom to see key data right from our site.
Chose Chartbeat
We use Chartbeat for real-time evaluation and Adobe Analytics for longer-term performance reporting. Chartbeat is easier to use overall, particularly for content producers. Researchers tend to rely on Adobe Analytics for their reports. We have found that we need to keep using …
Chose Chartbeat
Google Analytics has gradually become much more difficult to use, and much slower in its realtime reporting. It was the changes that came in with Google Analytics 4 that gave us the final push to work with Chartbeat - a product some of us were already familiar with from …
Chose Chartbeat
Omnilytics is more robust, detailed, and catered for an intermediate media user, while I think Chartbeat is a more user-friendly and beginner-oriented piece of technology. That being said, there is an impressive amount of lift for Chartbeat, and it's evident that simplicity is …
Chose Chartbeat
I used Parse.ly before I used Chartbeat. We shifted away from Parse.ly because it's social standing wasn't as good, it was mostly for site readership and we needed a bigger concentration on social media that Parse.ly couldn't provide. It's not listed, but we now use Social Flow …
Chose Chartbeat
Chartbeat stands out in terms of real-time tracking and information from which to manage homepages, I found this better than Smart Octo's equivalent. However, the ability to quickly explore past data does not go as deep as Google Analytics.
Chose Chartbeat
I really haven't used anything else quite like Chartbeat. Google Analytics might compare but it is very different.
Chose Chartbeat
Chartbeat is better than GA when it comes to ease of use and immediacy. The homepage layover that Chartbeat offers is unique from what I've seen and gives me an instant knowledge of what's working on my site and how to best arrange it.
Chose Chartbeat
Other products like Chartbeat that I've used are Parse.ly, GA, and Omniture. Parse.ly is the only tool, in my opinion, that offers more real-time data, but the interface is lacking and isn't as intuitive as Chartbeat.
Chose Chartbeat
My company selected Chartbeat after we were acquired by a bigger company. Initially I missed the Parse.ly interface, but I have since adjusted.
Chose Chartbeat
Chartbeat is a lot easier to use.
Chose Chartbeat
Chartbeat is better for live metrics than either Adobe or Google, but Adobe Omniture especially is much better for tracking historic numbers.
Chose Chartbeat
Chartbeat is certainly better at visualizing content and segmenting the data all on one screen. We can filter by section, author, channel and more without leaving the main dashboard page. Combining properties together in roll up groups is another key feature. We're able to …
Features
BoundChartbeat
Testing and Experimentation
Comparison of Testing and Experimentation features of Product A and Product B
Bound
9.7
Ratings
14% above category average
Chartbeat
-
Ratings
a/b experiment testing10.00 Ratings00 Ratings
Split URL testing9.00 Ratings00 Ratings
Multivariate testing9.00 Ratings00 Ratings
Multi-page/funnel testing10.00 Ratings00 Ratings
Cross-browser testing10.00 Ratings00 Ratings
Mobile app testing9.00 Ratings00 Ratings
Test significance10.00 Ratings00 Ratings
Visual / WYSIWYG editor10.00 Ratings00 Ratings
Advanced code editor10.00 Ratings00 Ratings
Page surveys10.00 Ratings00 Ratings
Visitor recordings9.00 Ratings00 Ratings
Preview mode10.00 Ratings00 Ratings
Test duration calculator10.00 Ratings00 Ratings
Experiment scheduler9.00 Ratings00 Ratings
Experiment workflow and approval10.00 Ratings00 Ratings
Dynamic experiment activation9.00 Ratings00 Ratings
Client-side tests10.00 Ratings00 Ratings
Server-side tests10.00 Ratings00 Ratings
Mutually exclusive tests10.00 Ratings00 Ratings
Audience Segmentation & Targeting
Comparison of Audience Segmentation & Targeting features of Product A and Product B
Bound
9.8
Ratings
11% above category average
Chartbeat
-
Ratings
Standard visitor segmentation10.00 Ratings00 Ratings
Behavioral visitor segmentation10.00 Ratings00 Ratings
Traffic allocation control9.00 Ratings00 Ratings
Website personalization10.00 Ratings00 Ratings
Results and Analysis
Comparison of Results and Analysis features of Product A and Product B
Bound
9.4
Ratings
8% above category average
Chartbeat
-
Ratings
Heatmap tool10.00 Ratings00 Ratings
Click analytics10.00 Ratings00 Ratings
Scroll maps9.00 Ratings00 Ratings
Form fill analysis10.00 Ratings00 Ratings
Conversion tracking8.00 Ratings00 Ratings
Goal tracking9.00 Ratings00 Ratings
Test reporting9.00 Ratings00 Ratings
Results segmentation10.00 Ratings00 Ratings
CSV export10.00 Ratings00 Ratings
Experiments results dashboard9.00 Ratings00 Ratings
Web Analytics
Comparison of Web Analytics features of Product A and Product B
Bound
-
Ratings
Chartbeat
7.8
Ratings
4% below category average
Lead Conversion Tracking00 Ratings6.10 Ratings
Bounce Rate Measurement00 Ratings6.90 Ratings
Device and Browser Reporting00 Ratings7.70 Ratings
Pageview Tracking00 Ratings8.80 Ratings
Event Tracking00 Ratings8.30 Ratings
Reporting in real-time00 Ratings9.40 Ratings
Referral Source Tracking00 Ratings8.40 Ratings
Customizable Dashboards00 Ratings6.70 Ratings
Best Alternatives
BoundChartbeat
Small Businesses
Convert Experiences
Convert Experiences
Score 9.9 out of 10
StatCounter
StatCounter
Score 9.0 out of 10
Medium-sized Companies
Dynamic Yield
Dynamic Yield
Score 9.0 out of 10
Siteimprove
Siteimprove
Score 9.1 out of 10
Enterprises
Dynamic Yield
Dynamic Yield
Score 9.0 out of 10
Optimal
Optimal
Score 9.0 out of 10
All AlternativesView all alternativesView all alternatives
User Ratings
BoundChartbeat
Likelihood to Recommend
10.0
(0 ratings)
10.0
(0 ratings)
Likelihood to Renew
-
(0 ratings)
9.9
(0 ratings)
Usability
-
(0 ratings)
10.0
(0 ratings)
Support Rating
-
(0 ratings)
8.1
(0 ratings)
User Testimonials
BoundChartbeat
Likelihood to Recommend
I think the customer service and relationship we have with Get Smart Content is great
Read full review
It is well suited to keeping me toward a specified goal, and gives me concrete numbers and gives me an idea of what we need to do to meet our goals. It's less appropriate if you want something more than pageviews, and doesn't really do a lot for video views.
Read full review
Pros
  • Tracking/Data Analysis
  • Unique experiences
  • Reaching many demographics
Read full review
  • Provides easy at-a-glance look at what people are reading right now
  • Heads-up Display allows you to make sure the homepage is showing the content people want to read
  • Headline testing tool provides fascinating insight into what makes people read a story and improves headline-writing ability
Read full review
Cons
  • There are some additions we would like to see, such as a better experience in the Performance section. It'd be great if we could see an overall view of the metrics instead of having to drill down. We do a monthly KPI report which takes me a while to create due to the back and forth nature of comparing metrics within Get Smart Content. I also have to use Google Analytics to help with this.
  • We had some issues with the tool not updating Eloqua contacts, but that has since been resolved. The process for discovering the cause of the problem was lengthy and frustrating.
  • It would be great if you could see metrics of an A/B test within the campaign/rule, instead of having to go to the Performance section and find it. A small snapshot of info would be very helpful and it would allow us to compare and update the rule without leaving that page.
Read full review
  • Source of traffic needs improvement. Search and social make sense, but "internal" and "links" is a grey area. It would be helpful to define those with an organization and provide an information icon so users can easily remember what each of those buckets is tracking.
  • More ways to customize the real-time board. For example, with video content, that's great that I can see a user has started a video, but what is the completion rate, was that only on O&O or can that track Facebook, too?
  • Would like to see demo (age) information included as a way to slice the data so I can see what's working with my older and younger demo.
Read full review
Likelihood to Renew
No answers on this topic
I gave Chartbeat a 5 for a renewal rating, because, while it delivers clear and understandable content, Google Analytics also provides many of the same features for free. For a small to medium website, I believe it would be more cost effective to use Google Analytics. A website with a high amount of traffic, however, could merit spending the money on Chartbeat to maximize their potential.
Read full review
Usability
No answers on this topic
Chartbeat is really pretty straightforward. The only things that may cause confusion are the string of sidebar features and tools at the left of the screen. I mostly use the big leader board in real-time and the historical feature (looking at the monthly or weekly performance of my team's content) and then generate reports automatically from there.
Read full review
Support Rating
No answers on this topic
I have had limited experience of support for Chartbeat but whenever I have needed help it has been there. Recently there was an issue of seeing different forms of data in real time - app and otherwise effectively, and the issue was being clearly dealt with and communicated back to us.
Read full review
Alternatives Considered
Get Smart Content is what we primarily use to serve up segmented content. The only other method or tool we've used to do so while leveraging our Demandbase variables is Optimizely. We selected Get Smart Content because they make the process of segmentation using Demandbase variables easy
Read full review
Google Analytics has gradually become much more difficult to use, and much slower in its realtime reporting. It was the changes that came in with Google Analytics 4 that gave us the final push to work with Chartbeat - a product some of us were already familiar with from previous jobs. Things are just much harder to find in GA, and when time is always tight you can't afford to spend a long time looking for particular data - it should be quick and easy to locate
Read full review
Return on Investment
  • Allows to set up automations for several different scenarios.
  • Allows tracking links and the display of the stats/reporting.
  • It has ability to duplicate campaigns, which saves me a lot of time.
Read full review
  • It has helped us save time in report generation and performance analysis.
  • By helping us evaluate our contributors, we're able to get our money's worth.
  • Seeing our numbers on the Big Board fosters healthy competition among brands, motivating us to distribute our stories better.
Read full review
ScreenShots

Bound Screenshots

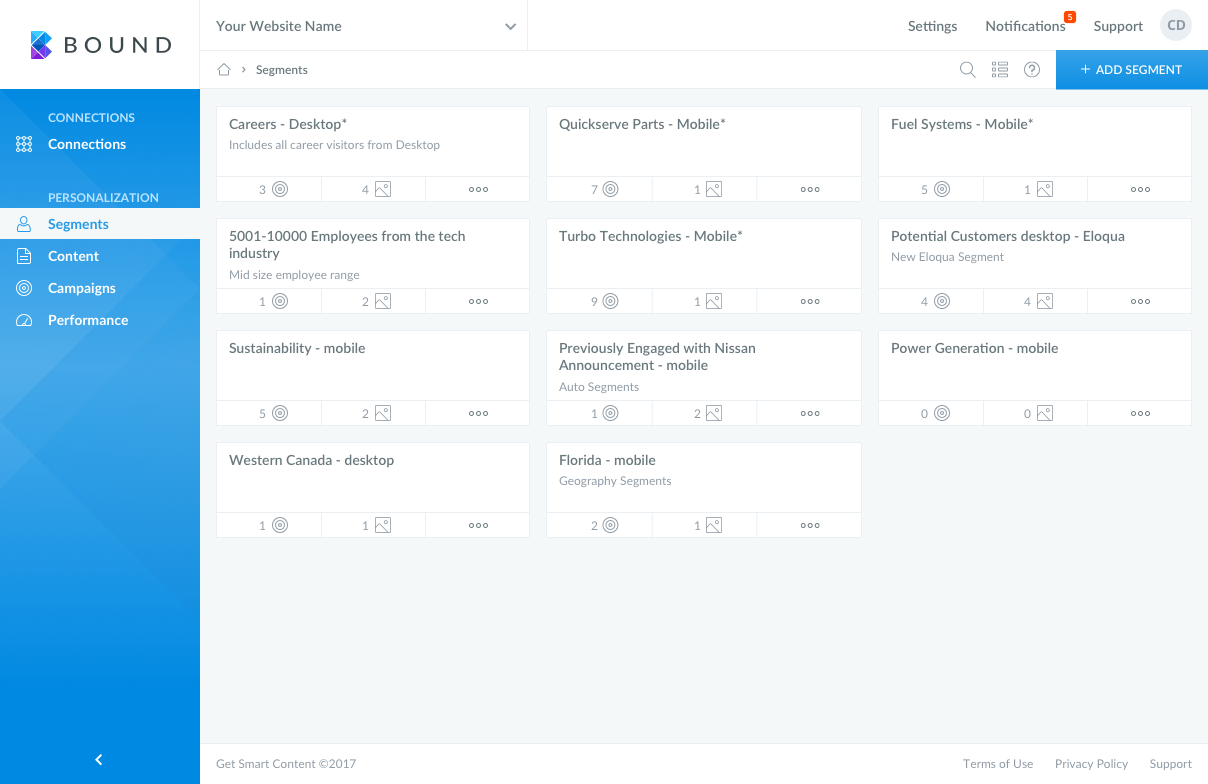
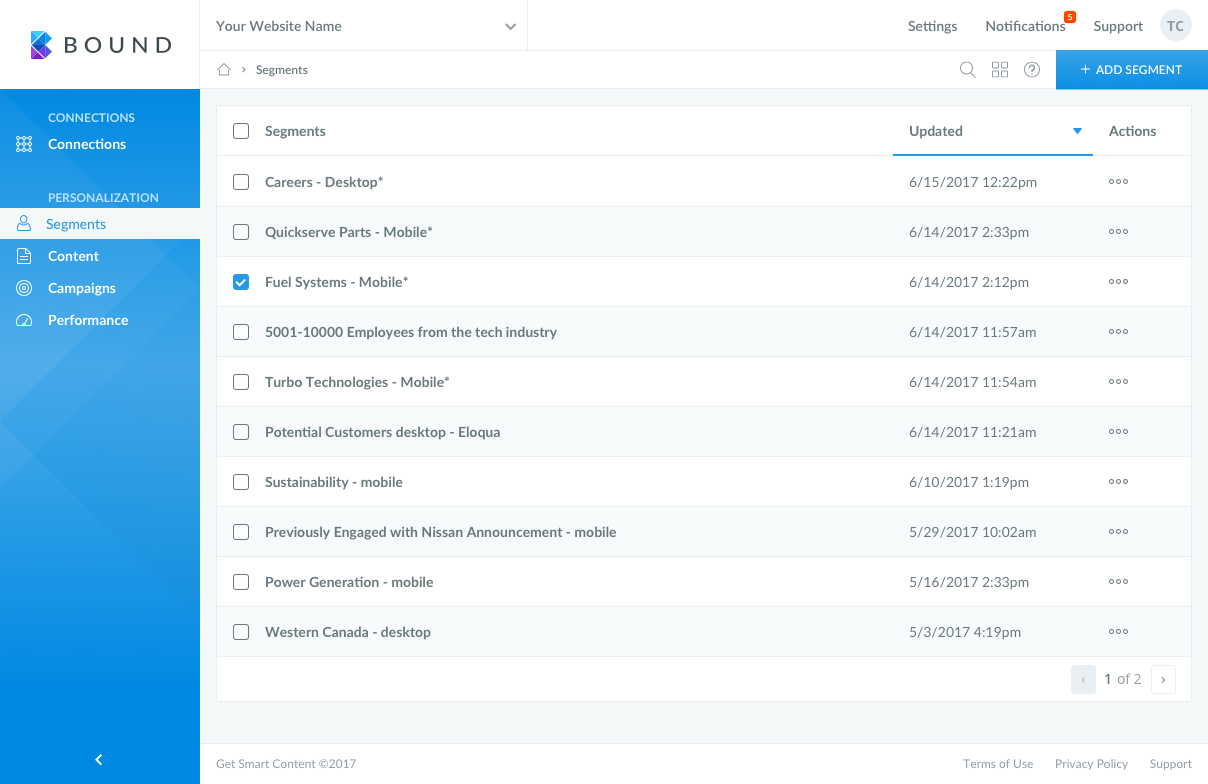
Screenshot of Campaign viewScreenshot of Segment viewScreenshot of Segment list

Chartbeat Screenshots

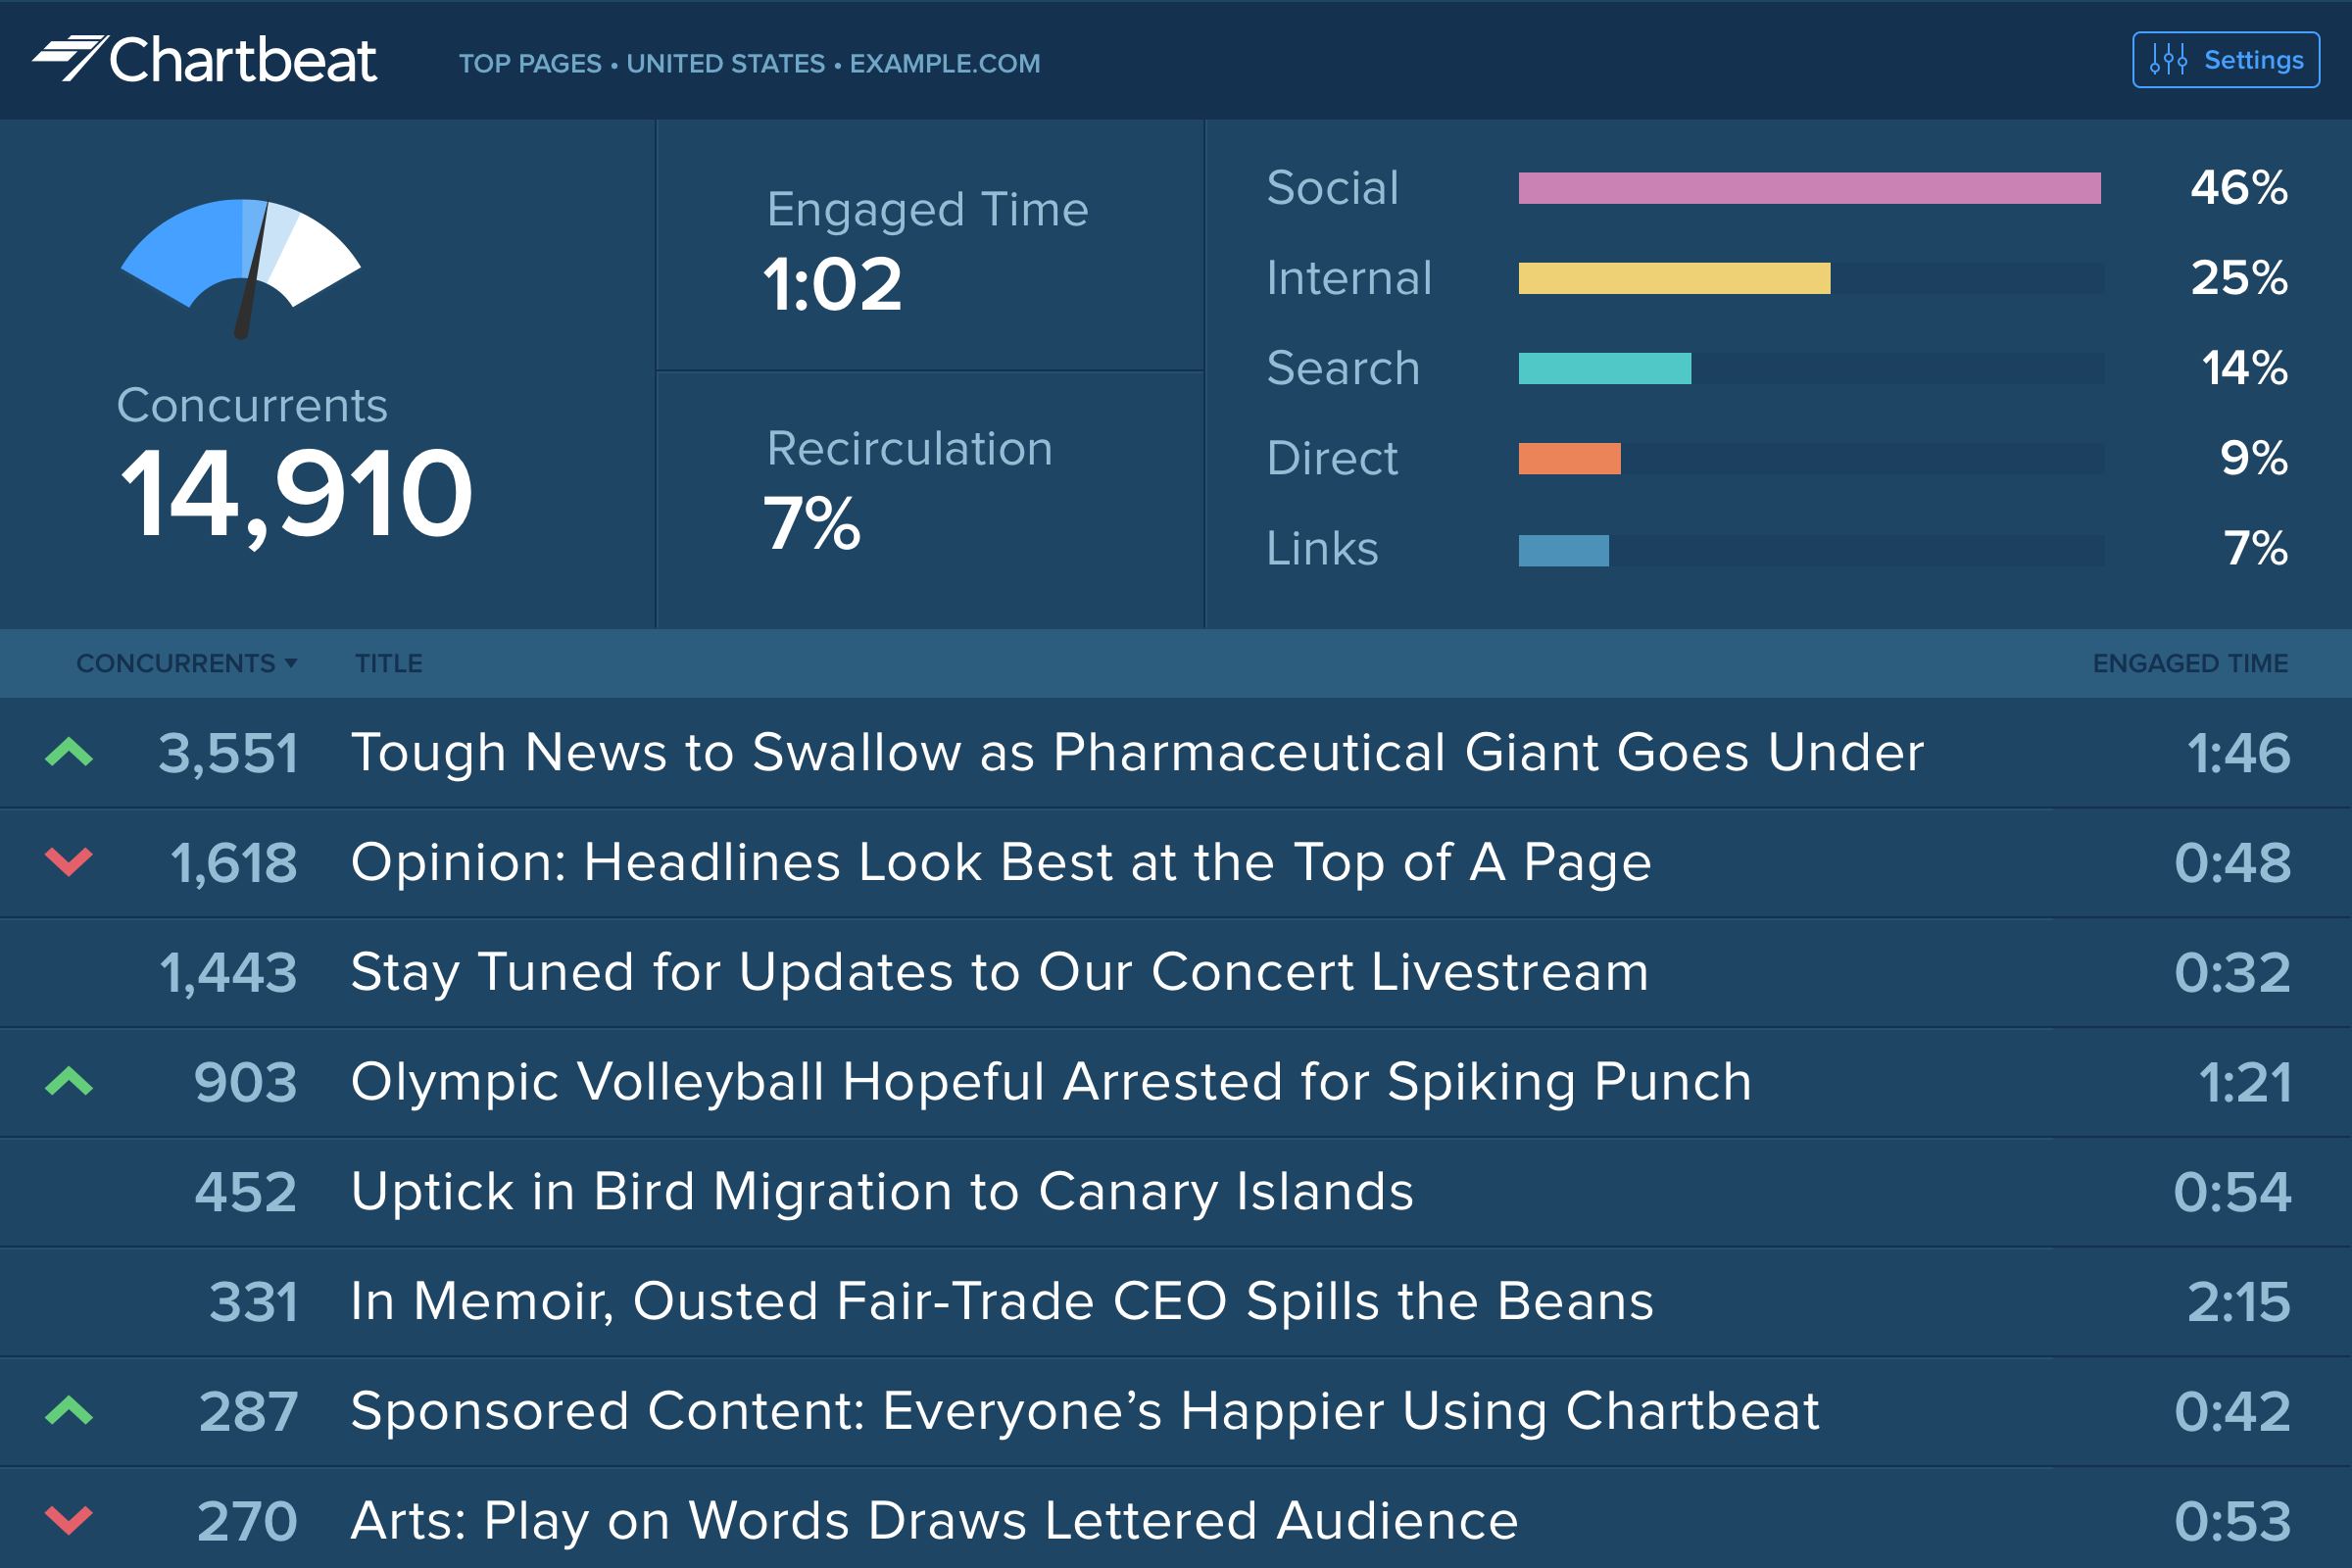
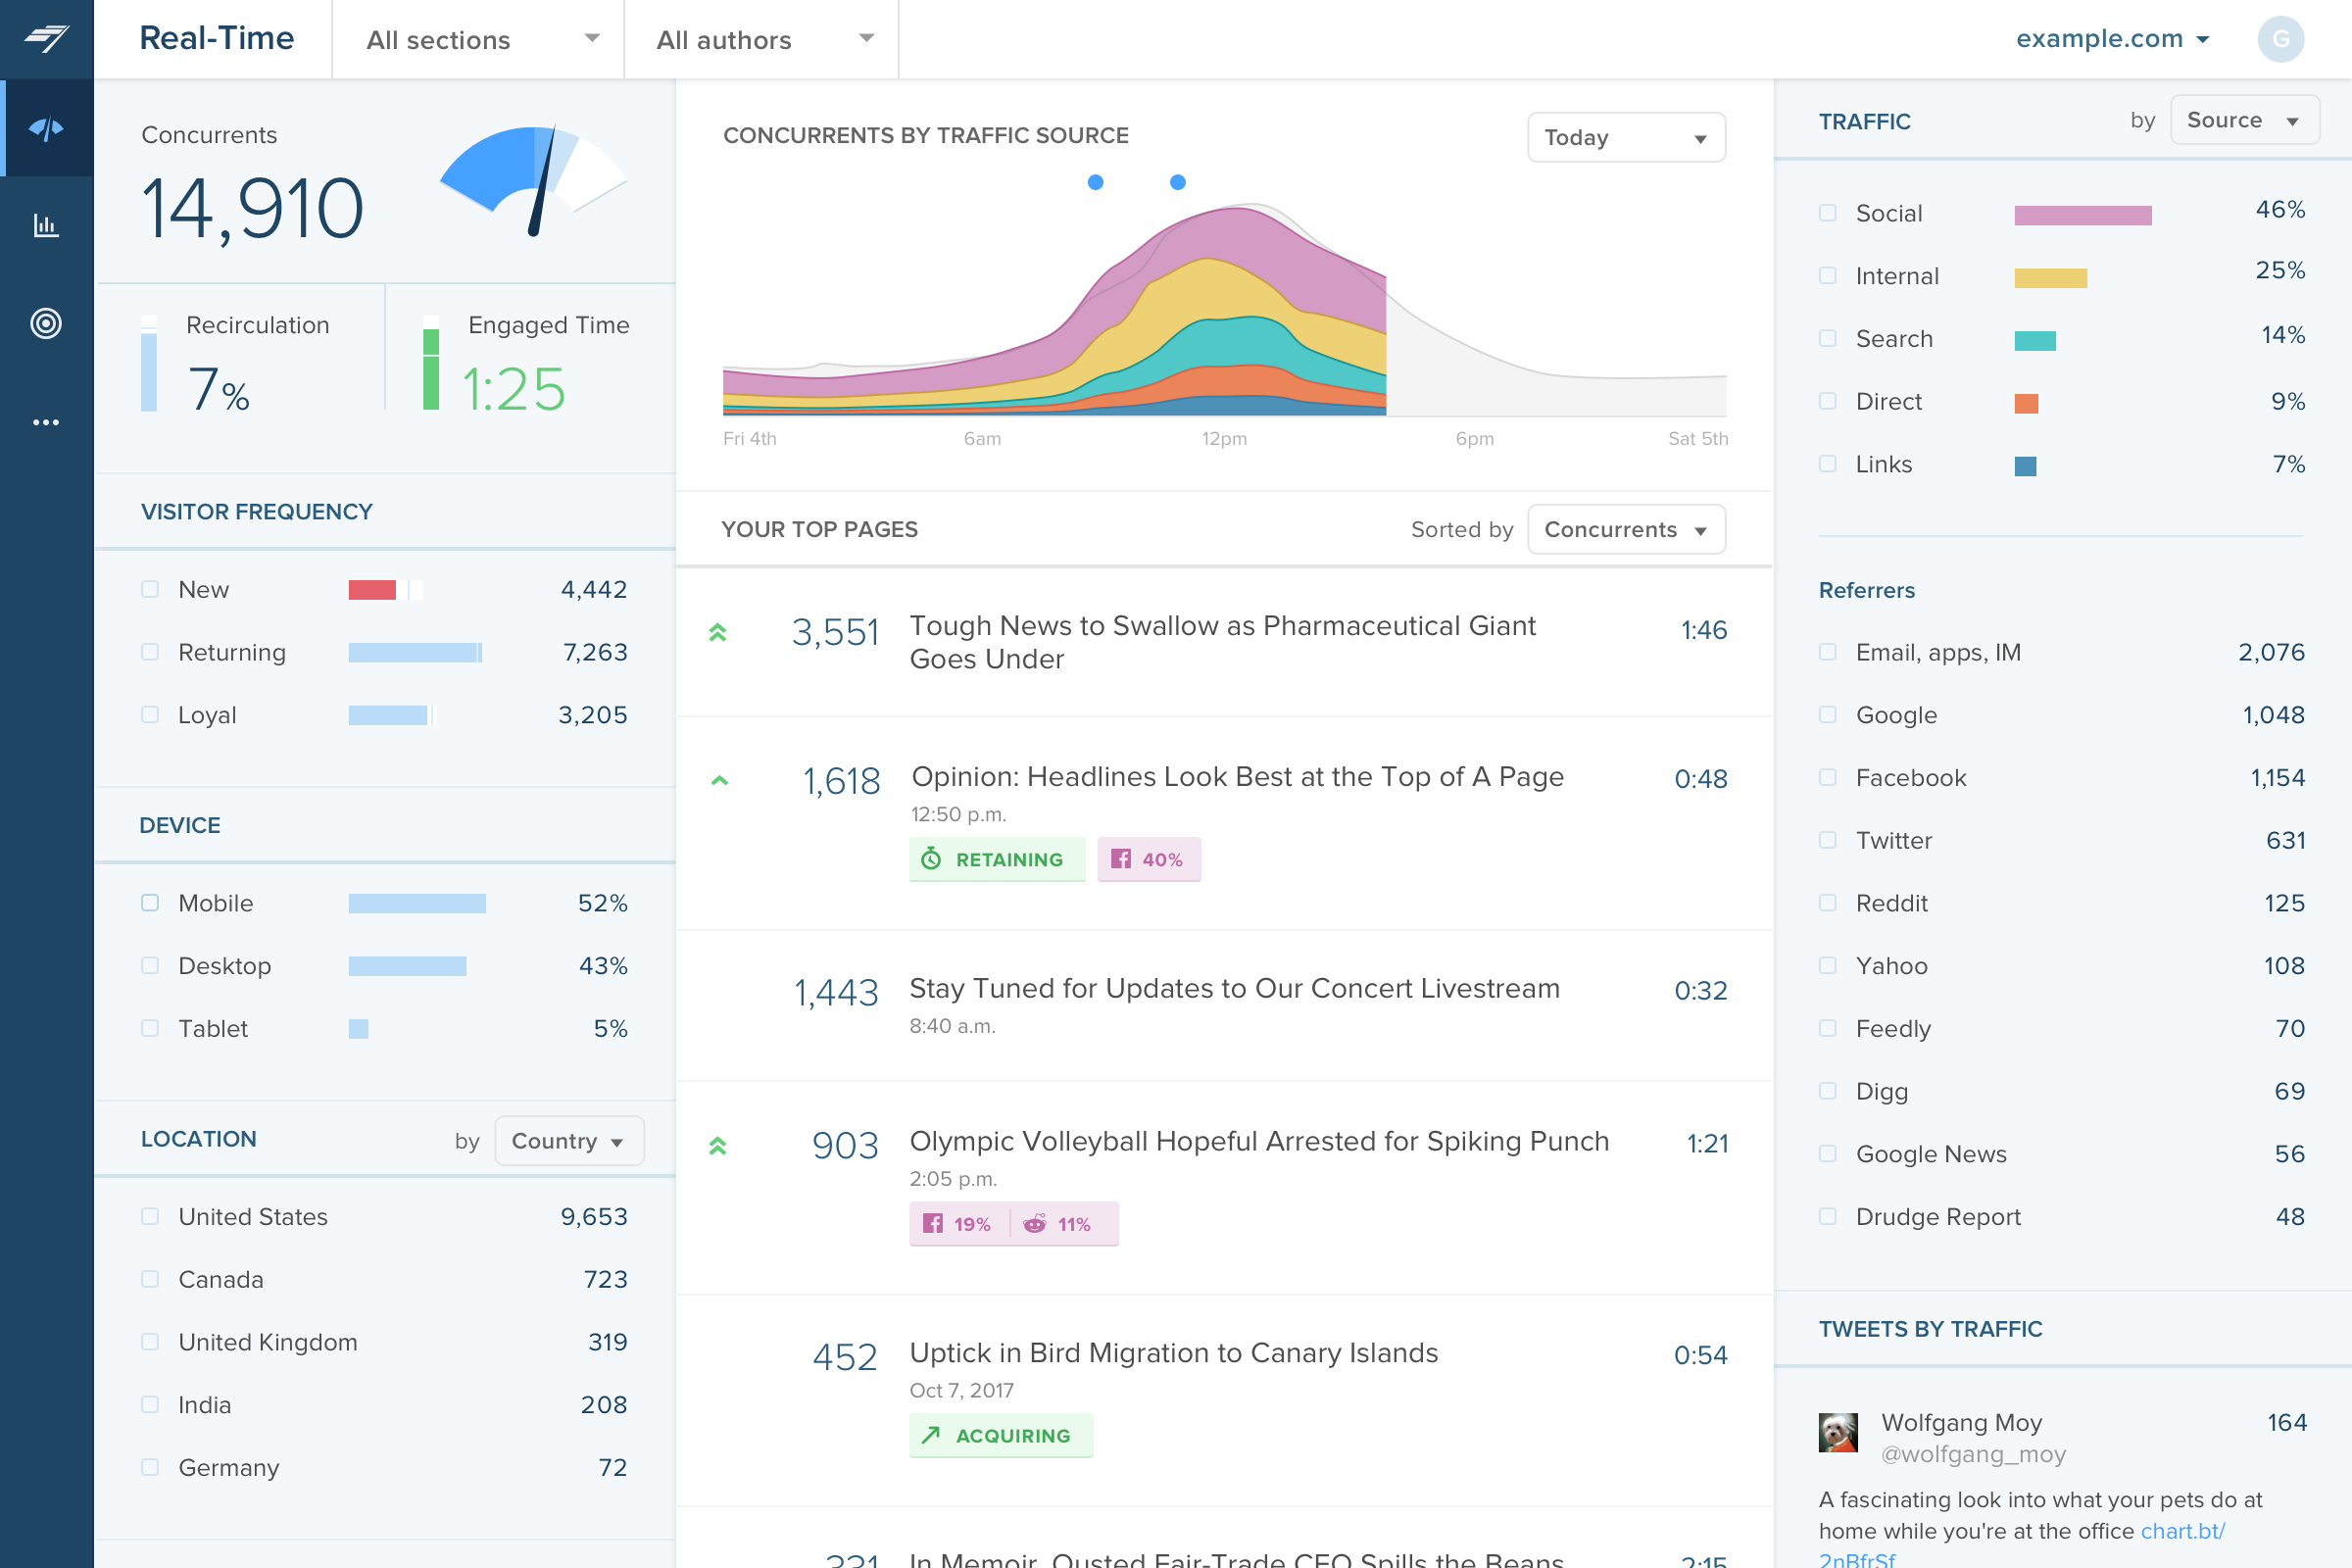
Screenshot of Big Board: For newsrooms, the leaderboard-style visualization shows the top stories on the biggest screen.Screenshot of Real-time dashboard: Displays how an audience is connecting with content in the moment – across platforms, channels, and devices.Screenshot of Historical Dashboard: To assess content performance, KPIs, and valuable trends over the long term.Screenshot of Heads Up Display: Shows which homepage articles are the top performers, how stories are trending up or down in traffic, and how far visitors are scrolling down the page.Screenshot of Video Dashboard: Reveals how video content captures viewer attention.Screenshot of Conversion Dashboard: Tracks conversion metrics and insights.