Clear Analytics vs. Looker
Clear Analytics vs. Looker
| Product | Rating | Most Used By | Product Summary | Starting Price |
|---|---|---|---|---|
 Clear Analytics | Enterprise companies (1,001+ employees) | Clear Analytics is a business intelligence solution that enables non technical end users to perform analytics by leveraging existing knowledge of Excel coupled with a built in query builder. Some key features include: Dynamic Data Refresh, Data Share and In-Excel Collaboration. | $29 Per Seat per Month | |
 Looker | N/A | Looker is a BI application with an analytics-oriented application server that sits on top of relational data stores. It includes an end-user interface for exploring data, a reusable development paradigm for data discovery, and an API for supporting data in other systems. | N/A |
| Clear Analytics | Looker | |||||||||||||||
|---|---|---|---|---|---|---|---|---|---|---|---|---|---|---|---|---|
| Editions & Modules |
| No answers on this topic | ||||||||||||||
| Offerings |
| |||||||||||||||
| Entry-level Setup Fee | $800 Initial OnBoarding | Required | ||||||||||||||
| Additional Details | Certain Enterprise level features can be made available to Small Business edition at additional cost. Such services include Scheduler and OLAP connectivity. Custom adapters can also be created to connect to SaaS services. | Must contact sales team for pricing. | ||||||||||||||
| More Pricing Information | ||||||||||||||||
| Clear Analytics | Looker |
|---|
| Clear Analytics | Looker | |||||||||||||||
|---|---|---|---|---|---|---|---|---|---|---|---|---|---|---|---|---|
| BI Standard Reporting |
| |||||||||||||||
| Ad-hoc Reporting |
| |||||||||||||||
| Report Output and Scheduling |
| |||||||||||||||
| Data Discovery and Visualization |
| |||||||||||||||
| Access Control and Security |
| |||||||||||||||
| Mobile Capabilities |
|
| Clear Analytics | Looker | |
|---|---|---|
| Small Businesses |  Yellowfin Score 8.7 out of 10 | Yellowfin Score 8.7 out of 10 |
| Medium-sized Companies |  Reveal Score 10.0 out of 10 | Reveal Score 10.0 out of 10 |
| Enterprises |  Kyvos Semantic Layer Score 9.5 out of 10 | Kyvos Semantic Layer Score 9.5 out of 10 |
| All Alternatives | View all alternatives | View all alternatives |
| Clear Analytics | Looker | |
|---|---|---|
| Likelihood to Recommend | 9.0 (8 ratings) | 8.3 (132 ratings) |
| Likelihood to Renew | - (0 ratings) | 9.2 (8 ratings) |
| Usability | 9.1 (8 ratings) | 8.8 (12 ratings) |
| Availability | - (0 ratings) | 10.0 (1 ratings) |
| Performance | - (0 ratings) | 6.0 (1 ratings) |
| Support Rating | 9.5 (8 ratings) | 8.8 (14 ratings) |
| Implementation Rating | - (0 ratings) | 10.0 (1 ratings) |
| Configurability | - (0 ratings) | 10.0 (1 ratings) |
| Contract Terms and Pricing Model | - (0 ratings) | 10.0 (1 ratings) |
| Ease of integration | - (0 ratings) | 10.0 (1 ratings) |
| Product Scalability | - (0 ratings) | 10.0 (1 ratings) |
| Professional Services | - (0 ratings) | 10.0 (1 ratings) |
| Vendor post-sale | - (0 ratings) | 10.0 (1 ratings) |
| Vendor pre-sale | - (0 ratings) | 10.0 (1 ratings) |
| Clear Analytics | Looker | |
|---|---|---|
| Likelihood to Recommend |  Clear Analytics
|  Google
 Daniel Dammerman Regional Sales Director |
| Pros | Clear Analytics
 Carlos Begazo Sales Manager | Google
|
| Cons | Clear Analytics
 Salam Mohammed System Solution Architect | Google
|
| Likelihood to Renew | Clear Analytics No answers on this topic | Google
|
| Usability | Clear Analytics
 Carter Halliday Marketing Manager | Google
|
| Reliability and Availability | Clear Analytics No answers on this topic | Google
 David Mynář Head Of Online Marketing |
| Performance | Clear Analytics No answers on this topic | Google
David Mynář Head Of Online Marketing |
| Support Rating | Clear Analytics
| Google
 Anson Abraham Data Lord |
| Implementation Rating | Clear Analytics No answers on this topic | Google
David Mynář Head Of Online Marketing |
| Alternatives Considered | Clear Analytics
| Google
|
| Contract Terms and Pricing Model | Clear Analytics No answers on this topic | Google
David Mynář Head Of Online Marketing |
| Return on Investment | Clear Analytics
 Jitesh Dugar Senior Product Manager | Google
|
| ScreenShots | Clear Analytics Screenshots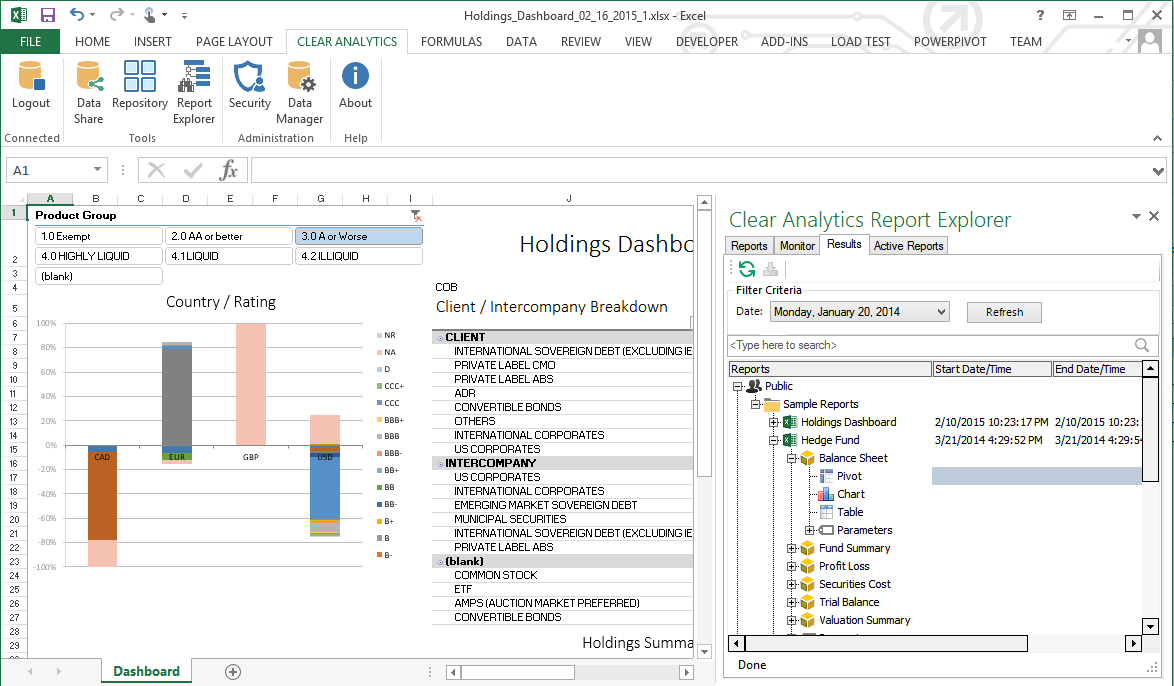 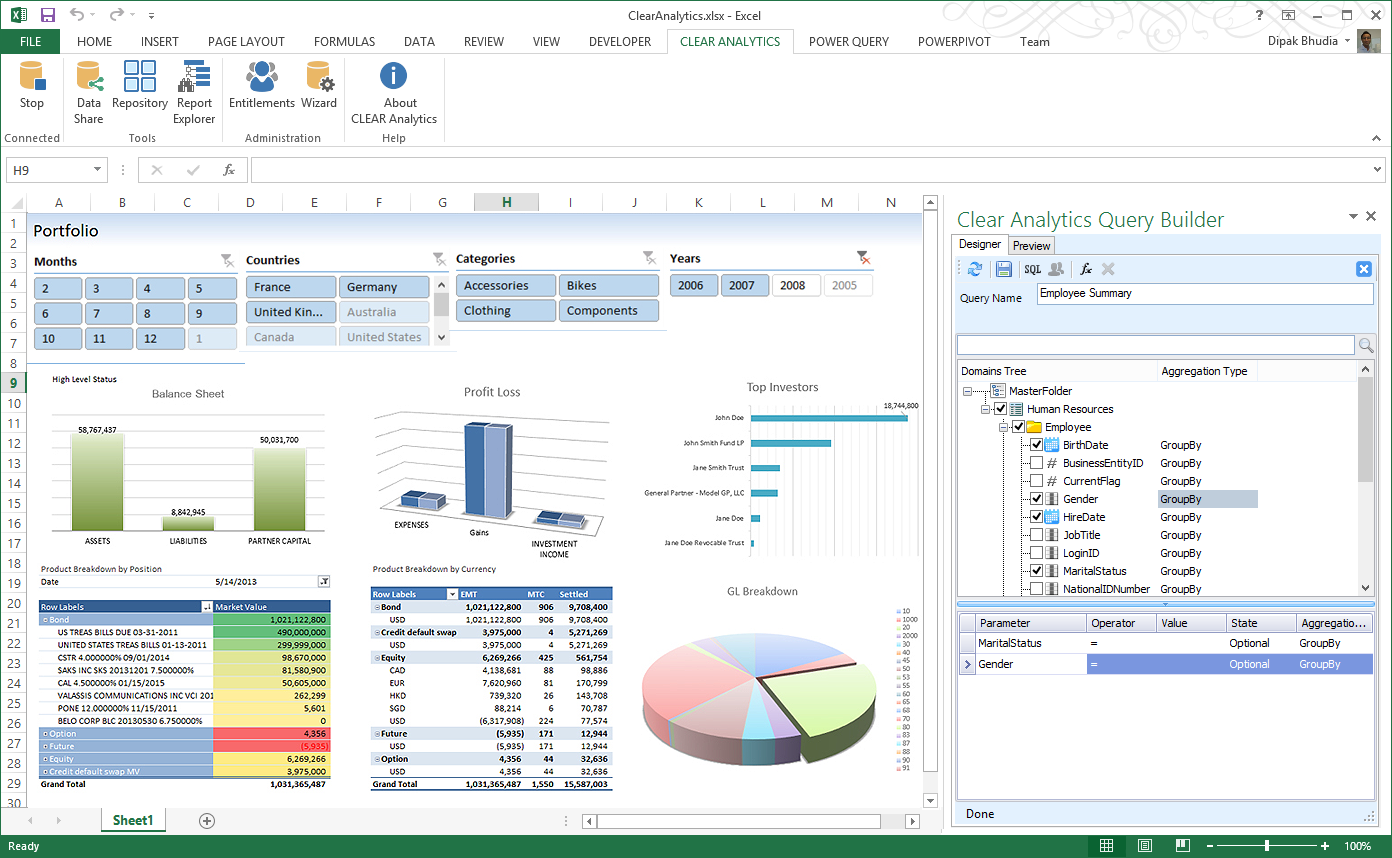 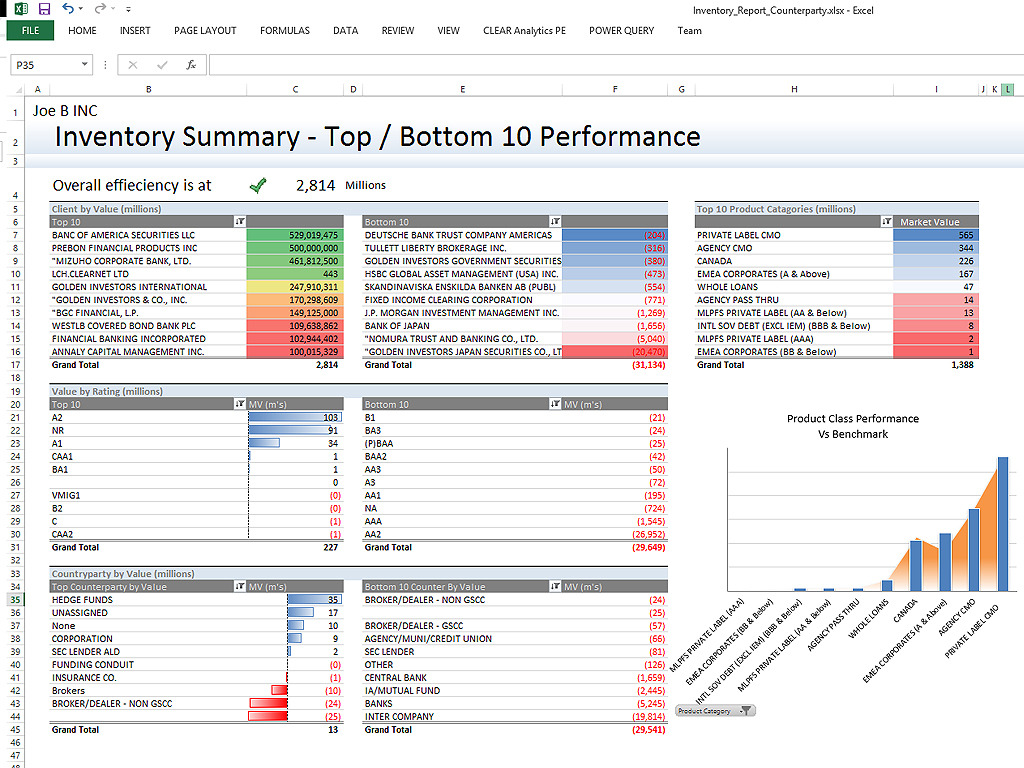   | Looker Screenshots |