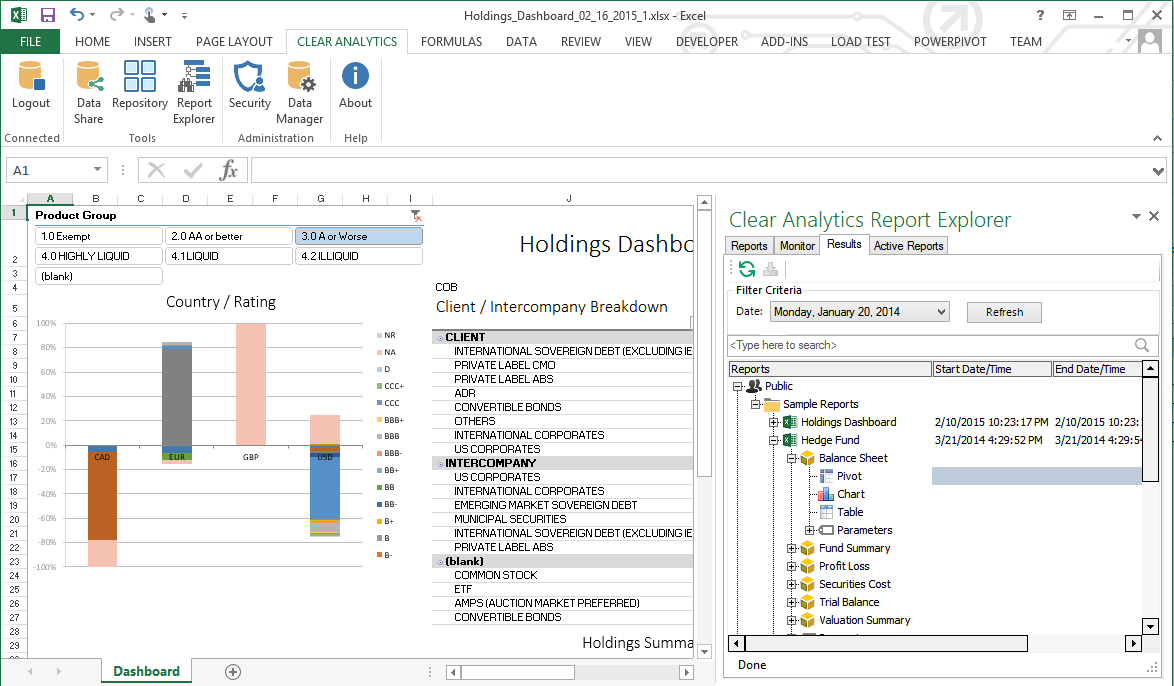
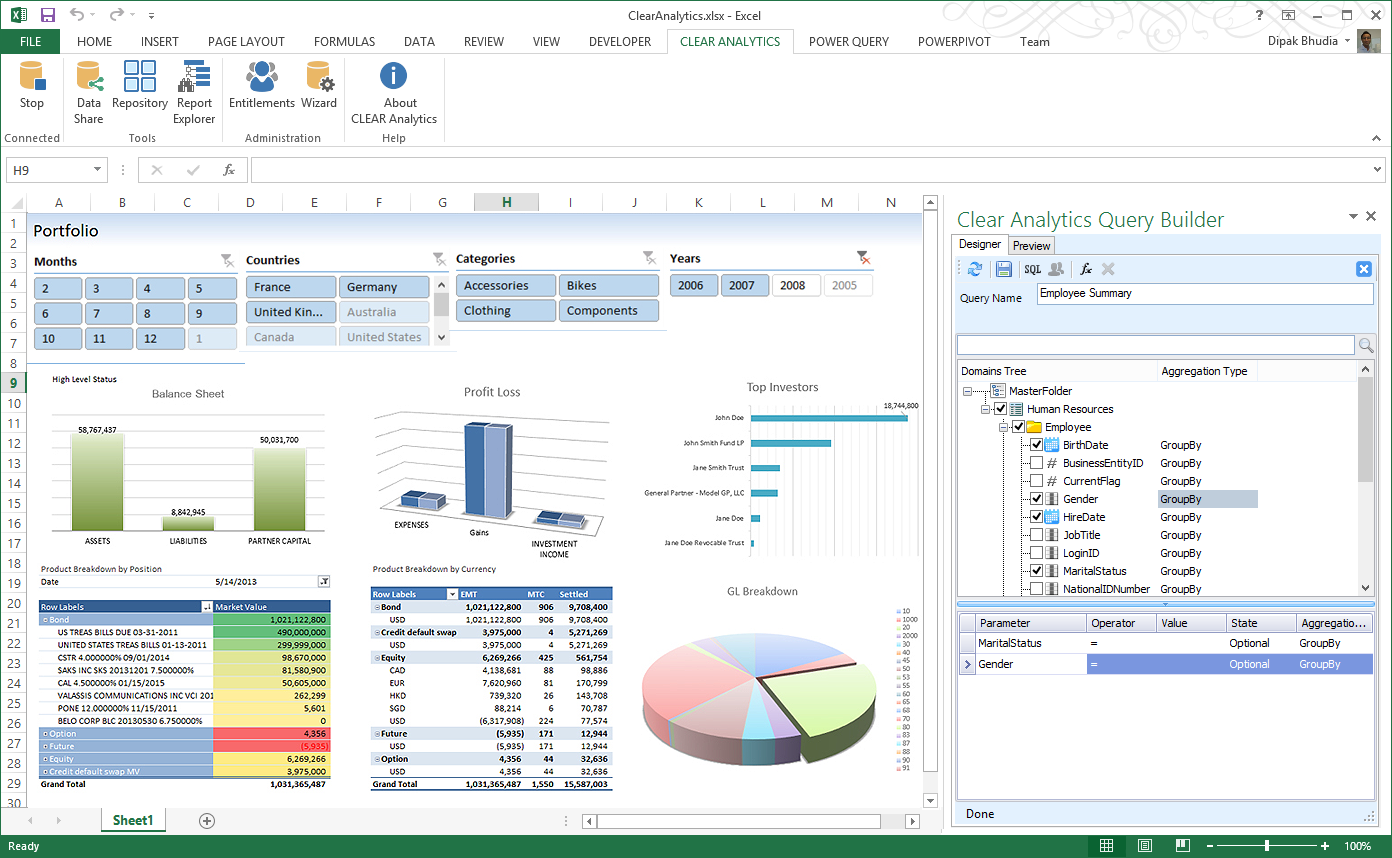
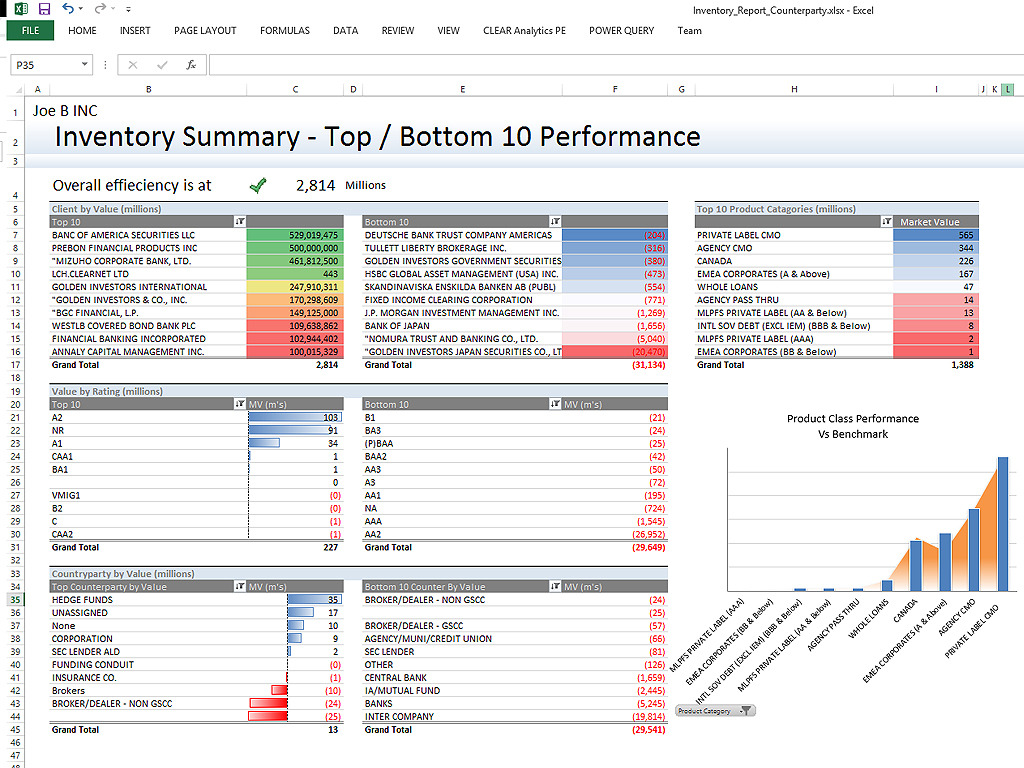
Clear Analytics is a business intelligence solution that enables non technical end users to perform analytics by leveraging existing knowledge of Excel coupled with a built in query builder. Some key features include: Dynamic Data Refresh, Data Share and In-Excel Collaboration.
$29
Per Seat per Month
Microsoft Excel
Score 8.9 out of 10
N/A
Microsoft Excel is a spreadsheet application available as part of Microsoft 365 (Office 365), or standalone, in cloud-based and on-premise editions.
$6.99
per month
Stackby
Score 8.9 out of 10
N/A
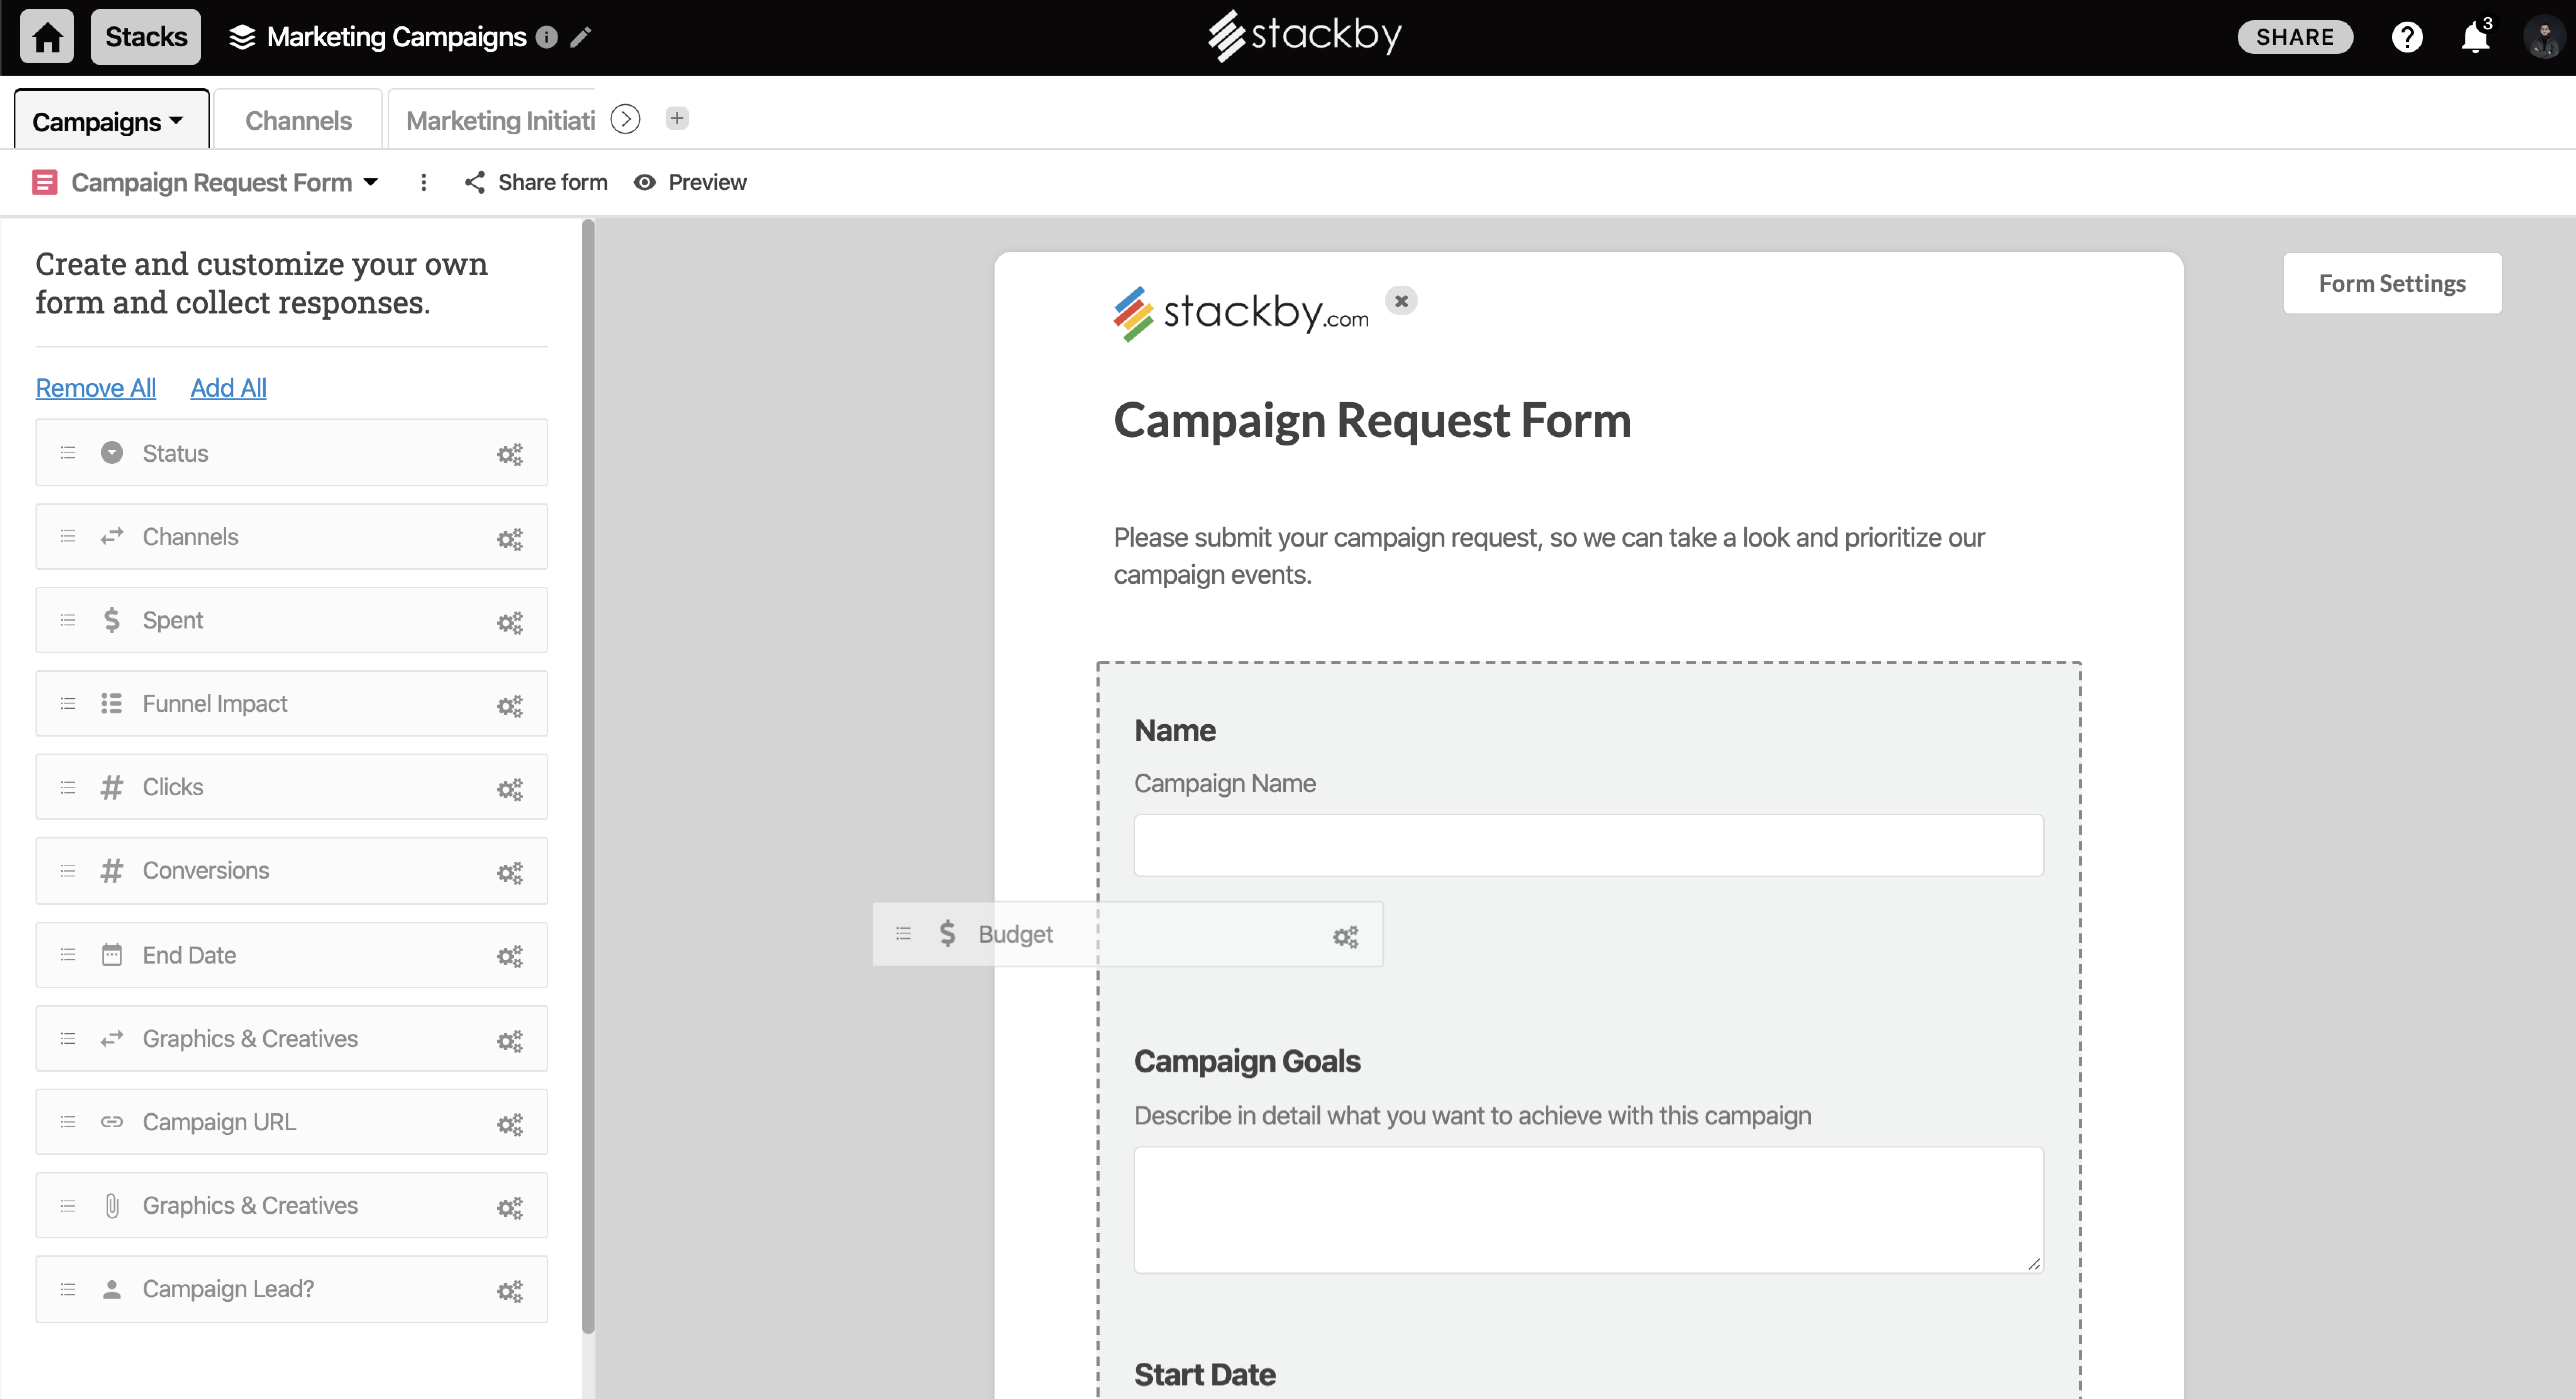
Stackby is designed to bring together the simplicity of spreadsheets, the functionality of databases and integrations with best business APIs to let anyone build their own tools, the way they want. No coding needed. Users can build a database from scratch, import data from pre-existing sources like spreadsheets or Google Sheets, or choose from over 100 pre-built templates across multiple categories. Stackby offers over 25 unique column types like text,…
$5
per month per user
Pricing
Clear Analytics
Microsoft Excel
Stackby
Editions & Modules
Personal
$29
Per Seat per Month
Team
$165
upto 10 Seat per Month
Department
$265
upto 25 Seat per month
Organization
$565
Upto 100 per seat per month
Excel with Microsoft 365
$6.99
per month
Excel for 1 PC or Mac
$139.99
perpetual license
Personal
$6
per month per user
Economy
$10
per month per user
Business
$20
per month per user
Business Plus
$35
per month per user
Enterprise
Custom
Offerings
Pricing Offerings
Clear Analytics
Microsoft Excel
Stackby
Free Trial
Yes
Yes
Yes
Free/Freemium Version
No
Yes
Yes
Premium Consulting/Integration Services
Yes
No
No
Entry-level Setup Fee
$800 Initial OnBoarding
No setup fee
No setup fee
Additional Details
Certain Enterprise level features can be made available to Small Business edition at additional cost. Such services include Scheduler and OLAP connectivity.
Custom adapters can also be created to connect to SaaS services.
Clear Analytics has almost all the features which are mostly required by the organizations for their data analytics and transformation activities. Clear Analytics is built on the support of a parallel query engine which makes it handle large volume requests and also provides optimized results. However, every solution has some limitations, Clear Analytics lacks advanced features such as Predictive Analytics which is a very demanding feature in the market as most organizations are adopting AI/ML automation for their businesses. Also, it needs to add a lot of advanced visualizations so that the user has the choice of selection. Overall a good solution to be recommended.
I don't really know another program as powerful as Excel. I've used Google Doc programs but do not feel they come close. So far, anytime I've needed a table of some sort for data, whether it's budget oriented or information off a survey, the best system has been Excel. We do web audits on occasion and we create an Excel worksheet featuring every URL of the pages we're auditing, notes, data about the content, information about files attached to the page and other information to help us determine what pages need updating, deleting or otherwise. We also use Excel primarily to export our Google Analytics to in order for us to create reports for clients that need to see specific information about their traffic.
Based on my experience, I can provide specific scenarios where Stackby is well suited and others where it may be less appropriate: Project Management: Stackby is an excellent choice for project management scenarios. Its ability to create custom databases, track tasks, assign responsibilities, and collaborate in real-time makes it highly effective for managing and monitoring project progress. CRM and Sales: Stackby is well suited for managing customer relationships and sales processes. Its customizable database structure allows for organizing customer information, tracking leads, managing deals, and generating reports. The ability to integrate with other tools further enhances its usefulness in CRM and sales workflows. Content Planning: Stackby is a great fit for content planning scenarios. Users can create databases to manage editorial calendars, track content ideas, assign tasks to team members, and monitor content performance. Collaboration features facilitate seamless content collaboration and ensure timely publishing.
It is very good at embedded formulas and tying cells to one another
It allows me to compare deals terms on a side-by-side basis and talk my clients through it easily.
It is very helpful as well in terms of allowing me to filter/sort results in many different ways depending on what specific information I am most interested in prioritizing.
Excel offers collaboration features that allow multiple users to work on the same spreadsheet, but managing changes made by different users can be challenging. Excel could improve its features by offering more granular control, better tracking of changes, and more robust conflict resolution tools.
Itcan be a barrier to productivity when importing and exporting data from other applications or file formats. To improve its features, it should offer better support for standard file formats and more robust error handling and reporting tools.
Excel can be challenging for finance students and working professionals, but it can be improved by offering more robust tutorials, better documentation, and more user communities and support forums.
Implement the same views available on desktop into the mobile app
Internal automations (like Airtable)
Ability to implement and display info as a dashboard (like Airtable)
Polish up the formatting of formulas, inputting them causes user frustration due to the formula input cursor jumping around
Better intelligence and ease of inputting data in bulk i.e have the fields automatically identify what data is being input and format appropriately (like Airtable does)
Excel remains the industry standard for spreadsheets and has maintained simple and straight-forward formula writing methods. Although there is a learning curve to do more complex calculations, there are countless help sites and videos on the Internet for almost any need.
I have really enjoyed working with Clear Analytics. This platform has contributed to increased production and reliable data control processes. It has flexible user interface that can be operated by any organization member. Reports are shared on simple and transparent way in the dashboard for easy access. Data analytics from all departments have created manageable working environment that have increased production.
I'm giving it a 7 because it is my go to. But the fact other prefer Google Sheets when working with a team does get irritating. I've used the online version of Microsoft Excel that other teams can get into and it still seems behind Google Sheets. It's a little clanky and slow? If that's even a term.
Stackby is overall pretty easy to use, especially if you're used to something like Airtable or SmartSuite. Some of the pages seem like near exact clones (though they put their own creative spin on things). I'd prefer a slighty fresher interface (like SmartSuite), but I'm willing to sacrifice that for the better price and great customer service.
I have had multiple scenarios where I had to reach out to the support team of Clear Analytics, be it access-related, general queries, during initial implementation, etc. My overall experience has always been good. I got the needed support every time without any delay. I can definitely recommend Clear Analytics simply on the basis of its excellent support team.
There are other great tools that are out there but Clear Analytics is reasonable for our business and provides a lot of features that we specifically needed
Out of Microsoft Excel, Microsoft Power BI, IBM SPSS, and Google Sheets, Microsoft Excel is by far the most common tool used for anything data-related across organizations. Accordingly, our organization has also implemented Microsoft Excel as a first-step tool. We recently adopted Microsoft Power BI (the free version), and use it occasionally (mostly for creating dashboards), but it is less commonly understood by stakeholders across our organization and by our clients. Accordingly, Microsoft Excel is more user-friendly and because of its popularity, we can easily look up how to do things in the program online. Google Sheets is a comparable alternative to Microsoft Excel, but because it's cloud-based and we have sensitive data that needs to be protected, we chose against using this software. Finally, a few users (including myself) have access to and utilize IBM's SPSS. For my role, it's a helpful tool to do more rigorous analyses. However, because of its cost and limited functionality as a simple spreadsheet, we only use it for more complex analyses.
I have also tried Ora.Pm. Infinity has better graphical interface, but nowhere near as many features and the UI isn't as effective (i.e, moving around with keys). Grist has a much more technical interface and it comes from being more of a database/interactive spreadsheet vs Stackby. Grist has much more functionality in terms of formulas, but is much harder to learn to use and less other functionalities. Ora.PM is more of a test at a task management app, and doesn't compare - Stackby is much better.
Each user can use it to whatever level of expertise they have. It remains the same so users can contribute to another's work regardless of whether they have more or less expertise