Chose QlikView
The only other product I have used for reporting is putting data into Excel and creating pivot tables. The ability to connect directly to multiple databases and other data sources is vastly superior.
| Product | Rating | Most Used By | Product Summary | Starting Price |
|---|---|---|---|---|
 QlikView | N/A | QlikView® is Qlik®’s original BI offering designed primarily for shared business intelligence reports and data visualizations. It offers guided exploration and discovery, collaborative analytics for sharing insight, and agile development and deployment. | N/A | |
 SAP Crystal | N/A | SAP Crystal is an analytics and reporting software solution for SMBs. SAP Crystal comprises Crystal Reports for pixel-perfect reporting, and SAP Crystal Server for automated distribution and self-service access to reports, dashboards and data exploration. | $295 per single user license |
| QlikView | SAP Crystal | |||||||||||||||
|---|---|---|---|---|---|---|---|---|---|---|---|---|---|---|---|---|
| Editions & Modules |
|
| ||||||||||||||
| Offerings |
| |||||||||||||||
| Entry-level Setup Fee | Optional | Optional | ||||||||||||||
| Additional Details | On an perpetual license basis, based on server plus number of users. Contact vendor for pricing. | * SAP Crystal Reports 2020 Viewer allows you to view static data within a SAP Crystal Reports file. * SAP Crystal Reports 2020 - Full version allows you to create powerful, richly formatted, and dynamic reports from virtually any data source, delivered in dozens of formats, in up to 28 languages. If you already have an older version of Crystal Reports, buy a license for SAP Crystal Reports 2020 - Upgrade at a discounted, upgrade price. * SAP Crystal Server 2020, 1 NUL includes 1 license of: SAP Crystal Reports 2020 - SAP Crystal Server 2020. * As an add-on to SAP Crystal Server 2020 1 NUL, SAP Crystal Server 2020 5 CAL allows you to support a wider, intermittent audience of end users, up to five logged on at the same time. | ||||||||||||||
| More Pricing Information | ||||||||||||||||
| QlikView | SAP Crystal | |
|---|---|---|
| Considered Both Products |  QlikView  Luke Fitzwater Business Analyst Chose QlikView I have used Crystal Reports and SSRS at previous organizations. They were not considered here at my current company because we do not have any SQL servers housing any data. | SAP Crystal  Miguel De La Garza Rodriguez IT Manager Chose SAP Crystal Fully integrates into SAP B1 menus, it is the only reporting tool that fully integrates with B1 client, otherwise if you dont run SAP you can have all the reporting power and run reports from the crystal report viewer tool but you will not have menu like reports and you …  Ercole Lugari SQL & Business Objects Analyst Developer Chose SAP Crystal SAP Crystal Reports has a long service experience and is graphically superior.  Vasco Mendes Senior Consultant Chose SAP Crystal This is usually the easier software to have a consensus across different departments. The scheduled reports capabilities is also a very important feature when it comes to the time to decide. Despite some minor problems, SAP Crystal Server reports are usually very easy to … |
| QlikView | SAP Crystal | |||||||||||||||||||||
|---|---|---|---|---|---|---|---|---|---|---|---|---|---|---|---|---|---|---|---|---|---|---|
| BI Standard Reporting |
| |||||||||||||||||||||
| Ad-hoc Reporting |
| |||||||||||||||||||||
| Report Output and Scheduling |
| |||||||||||||||||||||
| Data Discovery and Visualization |
| |||||||||||||||||||||
| Access Control and Security |
| |||||||||||||||||||||
| Mobile Capabilities |
| |||||||||||||||||||||
| Application Program Interfaces (APIs) / Embedding |
|
| QlikView | SAP Crystal | |
|---|---|---|
| Small Businesses |  Yellowfin Score 8.7 out of 10 | Yellowfin Score 8.7 out of 10 |
| Medium-sized Companies |  Reveal Score 10.0 out of 10 | Reveal Score 10.0 out of 10 |
| Enterprises |  Kyvos Semantic Layer Score 9.5 out of 10 | Kyvos Semantic Layer Score 9.5 out of 10 |
| All Alternatives | View all alternatives | View all alternatives |
| QlikView | SAP Crystal | |
|---|---|---|
| Likelihood to Recommend | 7.7 (88 ratings) | 7.0 (159 ratings) |
| Likelihood to Renew | 8.8 (29 ratings) | 10.0 (19 ratings) |
| Usability | 8.0 (15 ratings) | 7.3 (31 ratings) |
| Availability | 9.8 (4 ratings) | 8.0 (1 ratings) |
| Performance | 8.6 (4 ratings) | 8.0 (1 ratings) |
| Support Rating | 3.3 (15 ratings) | 8.6 (21 ratings) |
| In-Person Training | - (0 ratings) | 10.0 (1 ratings) |
| Online Training | 8.0 (3 ratings) | - (0 ratings) |
| Implementation Rating | 7.4 (13 ratings) | 8.8 (14 ratings) |
| Configurability | - (0 ratings) | 8.0 (1 ratings) |
| Ease of integration | - (0 ratings) | 7.0 (1 ratings) |
| Product Scalability | 8.9 (2 ratings) | 7.0 (1 ratings) |
| Vendor post-sale | - (0 ratings) | 8.0 (1 ratings) |
| Vendor pre-sale | - (0 ratings) | 7.0 (1 ratings) |
| QlikView | SAP Crystal | |
|---|---|---|
| Likelihood to Recommend | Qlik
| SAP
|
| Pros | Qlik
 Jake Tolbert Director of Development - Data Services | SAP
|
| Cons | Qlik
| SAP
 Frank Hunt Business Development Manager |
| Likelihood to Renew | Qlik
 Debbie Pyykkonen, MBA Director of Business Analytics | SAP
|
| Usability | Qlik
| SAP
 Greg Goss SQL Database and Business Intelligence Manager |
| Reliability and Availability | Qlik
 Bill Chamberlain Partner | SAP No answers on this topic |
| Performance | Qlik
| SAP No answers on this topic |
| Support Rating | Qlik
| SAP
 Nathan Patrick Taylor Clinical Informatics Consultant |
| In-Person Training | Qlik
| SAP
|
| Online Training | Qlik
 Robert Goodman Director, Business Intelligence & Analytics | SAP No answers on this topic |
| Implementation Rating | Qlik
 David Worrell CFO (Chief Financial Officer) | SAP
|
| Alternatives Considered | Qlik
| SAP
|
| Return on Investment | Qlik
 Mark McHenry Marketing | SAP
 Rohit Narang Assistant Vice President |
| ScreenShots | QlikView Screenshots   | SAP Crystal Screenshots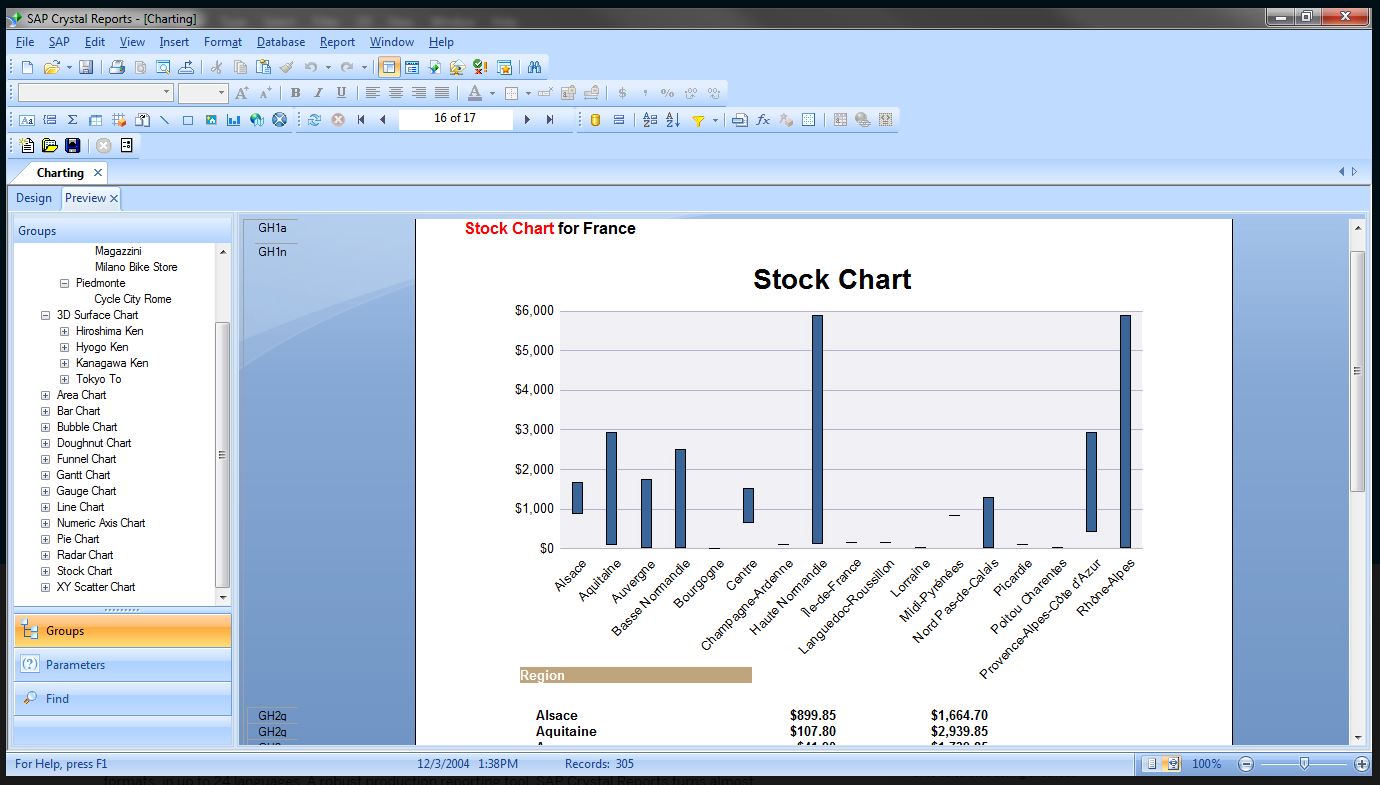   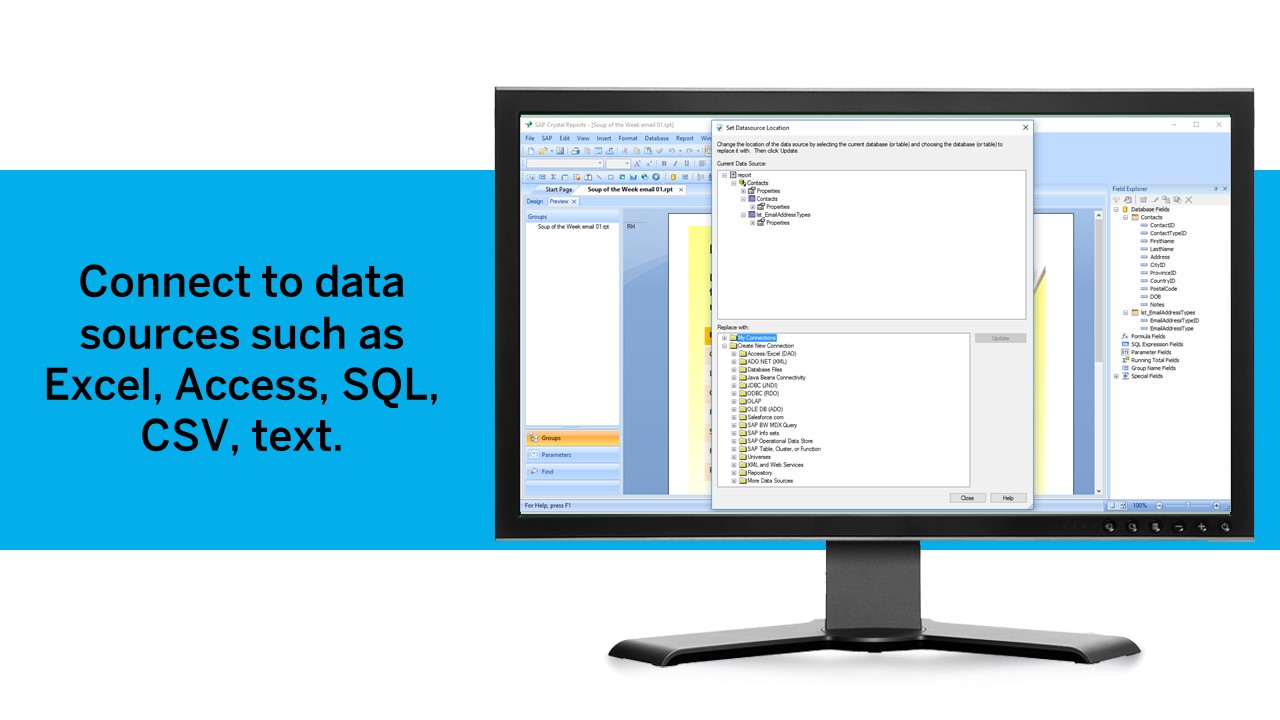 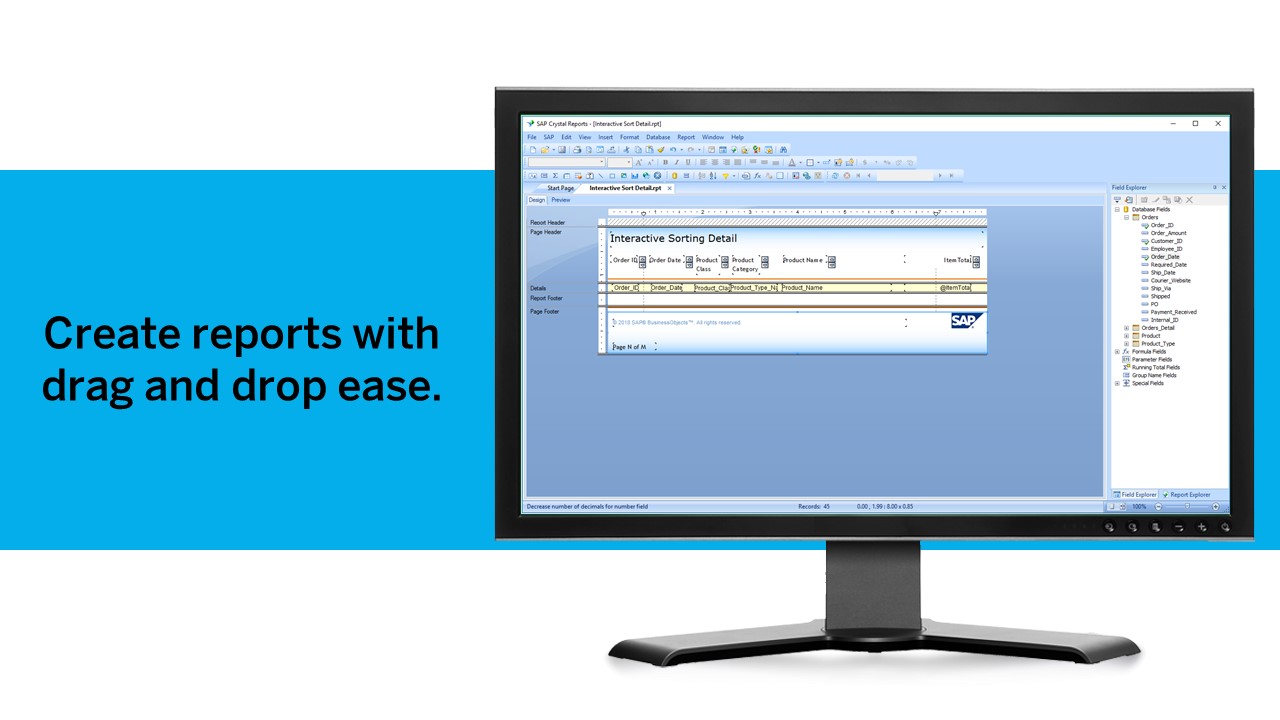  |