Datadog is a monitoring service for IT, Dev and Ops teams who write and run applications at scale, and want to turn the massive amounts of data produced by their apps, tools and services into actionable insight.
$18
per month per host
Progress WhatsUp Gold
Score 7.9 out of 10
Mid-Size Companies (51-1,000 employees)
WhatsUp Gold developed by Ipswitch (acquired by Progress Software May 2019) offers network performance monitoring and mapping. It supports core monitoring features, including automated workflows and network capacity planning, and monitors across hybrid environments.
N/A
Pricing
Datadog
Progress WhatsUp Gold
Editions & Modules
Log Management
$1.27
per month (billed annually) per host
Infrastructure
$15.00
per month (billed annually) per host
Standard
$18
per month per host
Enterprise
$27
per month per host
DevSecOps Pro
$27
per month per host
APM
$31.00
per month (billed annually) per host
DevSecOps Enterprise
$41
per month per host
No answers on this topic
Offerings
Pricing Offerings
Datadog
Progress WhatsUp Gold
Free Trial
Yes
Yes
Free/Freemium Version
Yes
No
Premium Consulting/Integration Services
No
Yes
Entry-level Setup Fee
Optional
Optional
Additional Details
Discount available for annual pricing. Multi-Year/Volume discounts available (500+ hosts/mo).
Datadog may be better suited for teams that have a more out-of-the-box infrastructure, on the primary platforms Datadog supports. You may also have better results if you have a bigger team dedicated to devops and/or a bigger budget. We found that trying to adapt it to our use case (small team, .NET on AWS Fargate) wasn't feasible. We continually ran into roadblocks that required us to dig through documentation (and at times, having to figure out some documentation was wrong), go back and forth with support, and in my opinion, waste money on excessive and unintended usages due to opaque pricing models and inaccurate usage reports, as well as broken/non-functional rate sampling controls.
[Progress WhatsUp Gold (formerly Ipswitch WhatsUp Gold)] is good for what it is. An inexpensive but accurate monitor for alerting on systems and services. However, it is time consuming to configure, The GUI leaves a lot to be desired and the formatting for txt alerts stinks (I just use it now as an alert to check my email to view the actual alert.)
The thing which Datadog does really well, one of them are its broad range of services integrations and features which makes it one step observability solution for all. We can monitor all types of our application, infrastructure, hosts, databases etc with Datadog.
Its custom dashboard feature which helps us to visualize the data in a better way . It supports different types of charts through those charts we can create our dashboard more attractive.
Its AI powered alerting capability though that we can easily identify the root cause and also it has a low noise alerting capability which means it correlated the similar type of issues.
Monitoring the connection; performance, switching, and issues. We use a broadband connection for our primary and a cellular backup for the secondary. While we use routing protocols to make this switch and WhatsUp isn't used for Syslog monitoring. it alerts us within seconds.
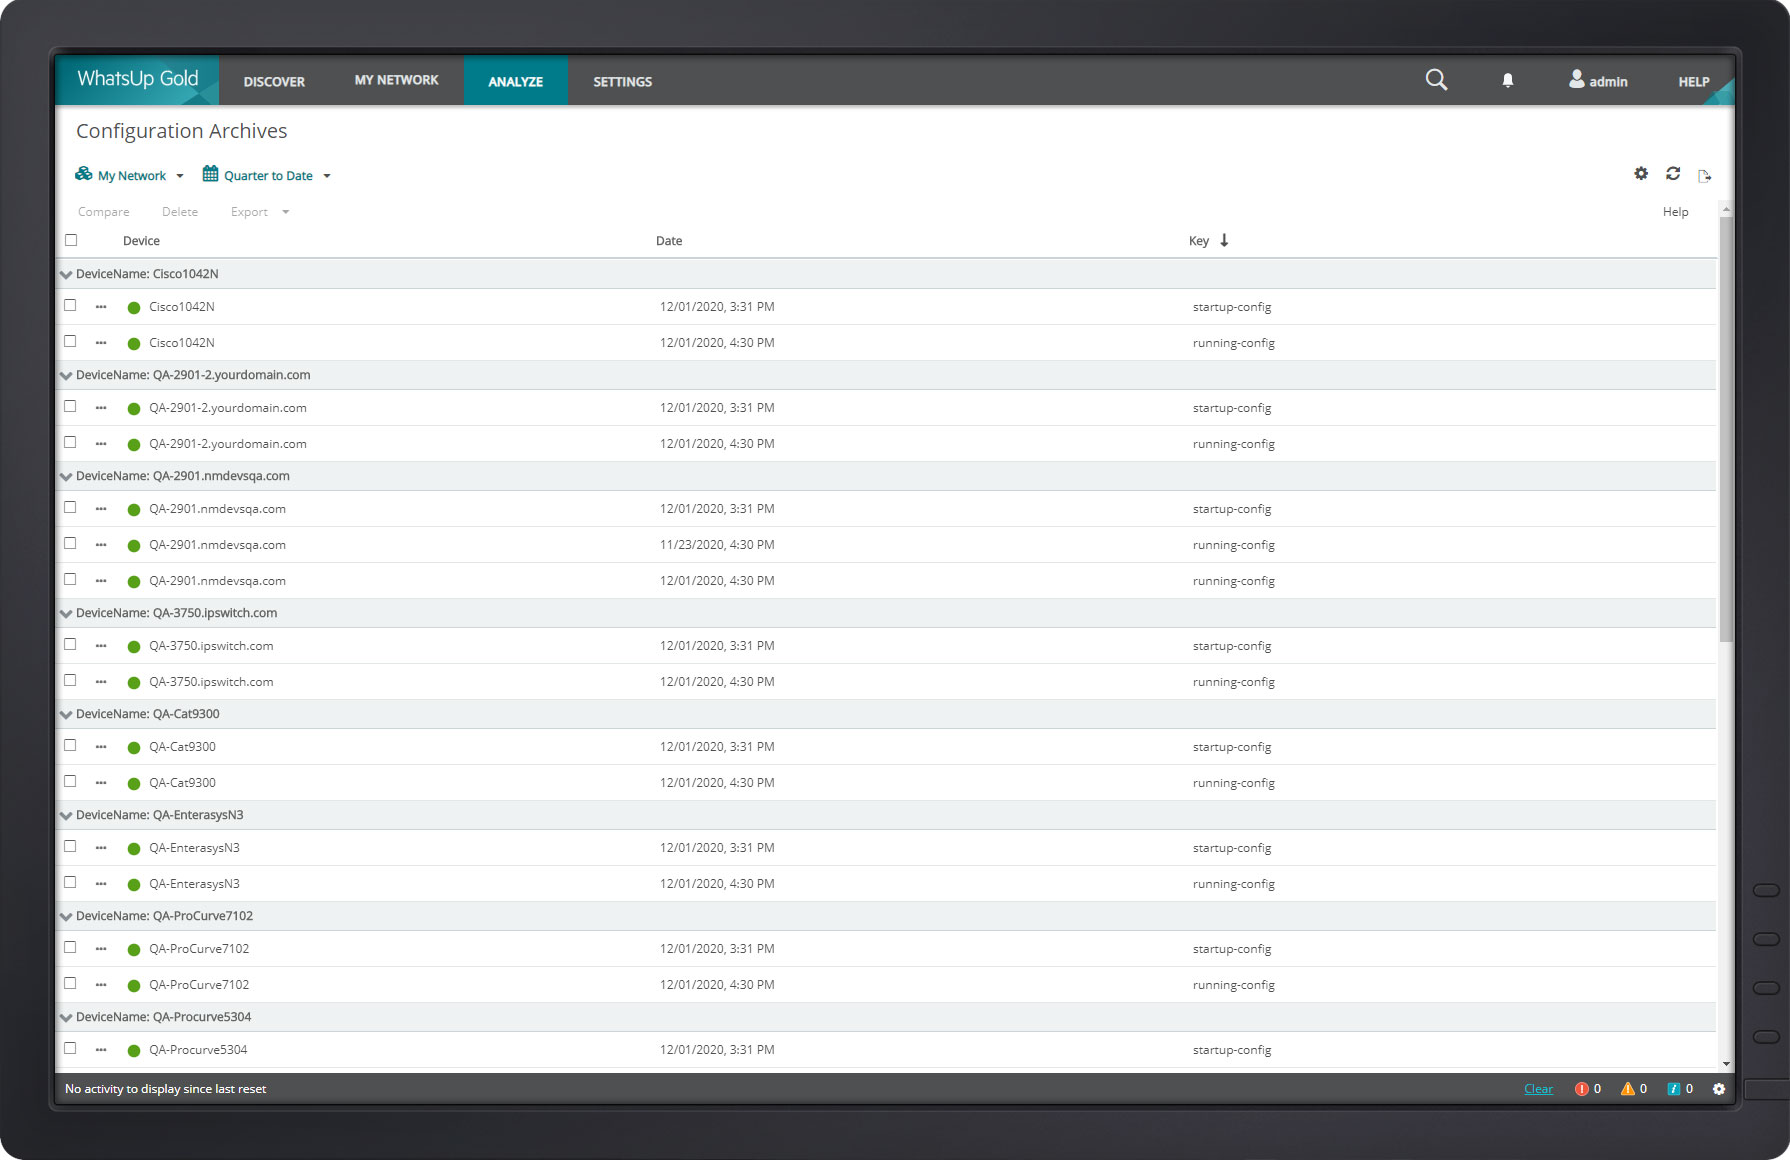
Backup configurations and archiving. WhatsUp does this particularly well. I use it for both Cisco routers and switches.
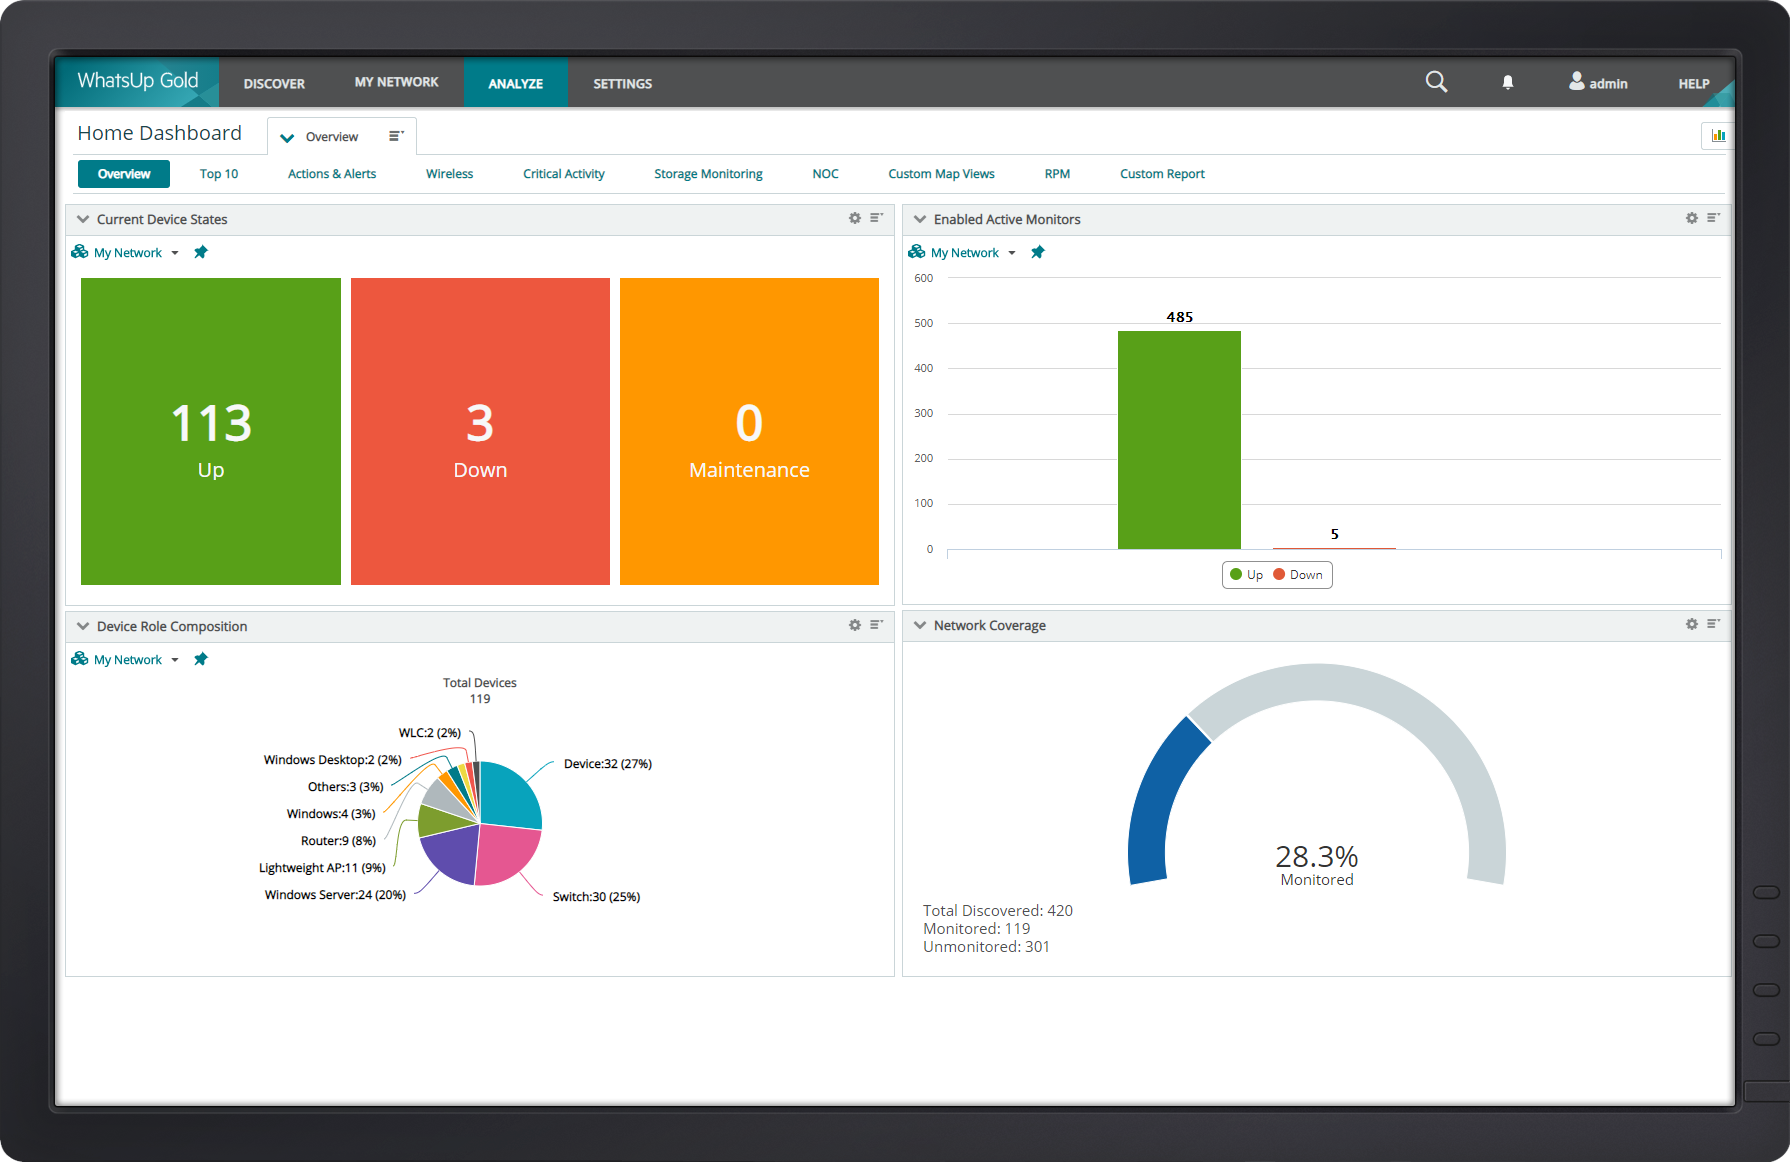
The diagram feature is nice. Though I don't use it as much because of the size of our structure, it does come in handy for mapping routes of all traffic.
Alert windows cause lag in notifications (e.g. if the alert window is X errors in 1 hour, we won't get alerted until the end of the 1 hour range)
I would appreciate more supportive examples for how to filter and view metrics in the explorer
I would like a more clear interface for metrics that are missing in a time frame, rather than only showing tags/etc. for metrics that were collected within the currently viewed time frame
Navigating the new WhatsUp Gold 2018 is a bit complicated and not user-friendly. The best part about using a software is the user's ability to use it with ease.
You cannot click sites being monitored from Map Dashboard View. This feature was previously possible in the older version.
There are so many features that it can be hard to figure out where you need to go for your own use case. For example, RUM monitoring us buried in a "Digital Experience" sidebar setting when this is one of our key use cases that I sometimes struggle to find in the application. It appears that ECS + Fargate monitoring was recently released which is great because we had to build a lambda reporting solution for ephemeral task monitoring. But this new feature was never on my radar until I starting clicking around the application.
The web interface is really good, there are a few areas that could use a bit of polish but overall it is well designed and easy to navigate and use, even for a new user.
The support team usually gets it right. We did have a rather complicate issue setting up monitoring on a domain controller. However, they are usually responsive and helpful over chat. The downside would be I don’t think they have any phone support. If that is important to you this might not be a good fit.
Our logs are very important, and Datadog manages them exceptionally well. We frequently use Datadog services for our investigations. Use case: Monitor your apps, infrastructure, APIs, and user experience.
Key features:
Logs, metrics, and APM (Application Performance Monitoring)
Real-time alerting and dashboards
Supports Kubernetes, AWS, GCP, and other integrations
RUM (Real User Monitoring) and Synthetics
✅ Best for backend, server, and distributed systems monitoring.
Progress WhatsUp Gold (formerly Ipswitch WhatsUp Gold) is more network focused than some of the other products we looked at, which had basic capabilities but were not as strong on the reporting or programmatic resolution of issues. Progress WhatsUp Gold (formerly Ipswitch WhatsUp Gold) is cost effective compared to some of the other upmarket solutions.