Google Charts provides a way to visualize data on your website - for free. From simple line charts to complex hierarchical tree maps, the chart gallery provides a large number of ready-to-use chart types. The most common way to use Google Charts is with simple JavaScript that you embed in your web page.
N/A
SharePoint
Score7.9 out of 10
N/A
Microsoft's SharePoint is an Intranet solution that enables users to share and manage content, knowledge, and applications to empower teamwork, quickly find information, and collaborate across the organization.
$5
Per User Per Month
Qlik Cloud Analytics (Qlik Sense)
Score8.1 out of 10
N/A
Qlik Sense® is a self-service BI platform for data discovery and visualization. It supports a full range of analytics use cases—data governance, pixel-perfect reporting, and collaboration. Its Associative Engine indexes and connects relationships between data points for creating actionable insights.
A de minimis incentive was given to thank the reviewer for their time. The incentive was not used to bias or drive a particular response, nor was the incentive contingent on a positive endorsement. More Info
Verified User
Chose Qlik Cloud Analytics (Qlik Sense)
Qlik Sense has a better/easier user interface than Power BI or Tableau, however, these 2 offer much more customization than Qlik does.
A de minimis incentive was given to thank the reviewer for their time. The incentive was not used to bias or drive a particular response, nor was the incentive contingent on a positive endorsement. More Info
Verified User
Chose Qlik Cloud Analytics (Qlik Sense)
We selected QlikView and Qlik Sense hands down over the competition.
A de minimis incentive was given to thank the reviewer for their time. The incentive was not used to bias or drive a particular response, nor was the incentive contingent on a positive endorsement. More Info
Comparison of Mobile Capabilities features of Google Charts and Microsoft SharePoint and Qlik Cloud Analytics (Qlik Sense)
Feature
Google Charts
8.2
48 Ratings
6% above category average
Microsoft SharePoint
-
Ratings
Qlik Cloud Analytics (Qlik Sense)
7.5
221 Ratings
3% below category average
Responsive Design for Web Access
7.046 Ratings
00 Ratings
8.0215 Ratings
Mobile Application
9.629 Ratings
00 Ratings
8.0133 Ratings
Dashboard / Report / Visualization Interactivity on Mobile
8.044 Ratings
00 Ratings
9.0185 Ratings
Application Program Interfaces (APIs) / Embedding
Comparison of Application Program Interfaces (APIs) / Embedding features of Google Charts and Microsoft SharePoint and Qlik Cloud Analytics (Qlik Sense)
We can easily recommend Google Charts to any company that needs a way to visually represent their data. Another great thing about Google Charts is that it is free to use and does not require any membership fees. Although it requires a skilled used to be able to use the charts, the results are great and can be beneficial to any company who is looking to make better decisions.
It's Microsoft, so it rarely goes down or unnecessarily limits access. It works, though page load times can be long if you have lots of data. I feel like the Mac vs. PC divide has started to show up for MS products, but SharePoint works well with both.
Qlik Sense is a program whose purpose is to greatly improve all your operations and use of all data in an organic way. The mission will always be to increase the economic and commercial processes of the company in a short time. I recommended it for its high technology, which was Created for this area, the results are successful. We have noticed how it has increased relationships with our clients thanks to the credibility and security that we provide.
A de minimis incentive was given to thank the reviewer for their time. The incentive was not used to bias or drive a particular response, nor was the incentive contingent on a positive endorsement. More Info
they're free with Google suite and they have backing in terms of powerful Google apps which can be plugged in to perform multiple actions like using Google sheets to import raw data into Google Charts
they're the most simple app to use when it comes to creating charts and visual dashboards
ease of customization
ease of using custom APIs from developers side to help make any types of charts and dashboards you want
A de minimis incentive was given to thank the reviewer for their time. The incentive was not used to bias or drive a particular response, nor was the incentive contingent on a positive endorsement. More Info
A de minimis incentive was given to thank the reviewer for their time. The incentive was not used to bias or drive a particular response, nor was the incentive contingent on a positive endorsement. More Info
A de minimis incentive was given to thank the reviewer for their time. The incentive was not used to bias or drive a particular response, nor was the incentive contingent on a positive endorsement. More Info
I would like a couple more introductory videos or a live chat option for when you run into an issue. I think this is a Google-wide problem, not only linked to Google Charts.
I have run into some issues with the Dynamic Data but also admittedly could potentially dive in deeper and investigate.
It would be great if Google Charts made it possible to integrate Google Chat into the platform.
A de minimis incentive was given to thank the reviewer for their time. The incentive was not used to bias or drive a particular response, nor was the incentive contingent on a positive endorsement. More Info
Windows Explorer users have some difficulty having to constantly UPLOAD / DOWNLOAD files. Specifically on the DOWNLOAD when they are used to Drag & Drop in & out of LOCAL folders via Window's explorer.
Microsoft SharePoint supports multiple "library" types. When implementing our "image" library the search function is done via "tags" and boolean logic. This is challenging to most end users. I'd like our users to be able to search our Microsoft SharePoint image library without having to enter KEYWORD or other BOOLEAN logic.
Microsoft SharePoint can also be an internal website for each department or company wide communication tool but I believe these features are geared for much larger organizations. Since we are a SMB we really aren't using these features. So maybe something more useful to SMBs would be nice.
A de minimis incentive was given to thank the reviewer for their time. The incentive was not used to bias or drive a particular response, nor was the incentive contingent on a positive endorsement. More Info
A de minimis incentive was given to thank the reviewer for their time. The incentive was not used to bias or drive a particular response, nor was the incentive contingent on a positive endorsement. More Info
Google Charts is a good product. It's widely supported with deep documentation and a large community. But for me, it wasn't customizable enough. When we started with simple charts, it was great, but as we got deeper and more complex, our needs outgrew the library. If I was going forward, I would choose a more barebones library with more freedom and extensibility.
A de minimis incentive was given to thank the reviewer for their time. The incentive was not used to bias or drive a particular response, nor was the incentive contingent on a positive endorsement. More Info
It's integral to our business. It's already included with most of the Office 365 licensing we buy, so the cost is effectively zero. It stores our files, it is the foundation for custom applications, and Microsoft only continues to enhance its functionality and its connections to other Microsoft tools. SharePoint just keeps getting better and better.
A de minimis incentive was given to thank the reviewer for their time. The incentive was not used to bias or drive a particular response, nor was the incentive contingent on a positive endorsement. More Info
Qlik Sense is a constantly improving it's software and working with its' users to make it better. They are great at keeping their users informed of progress and care about delivering a quality product
A de minimis incentive was given to thank the reviewer for their time. The incentive was not used to bias or drive a particular response, nor was the incentive contingent on a positive endorsement. TR verified that a representative sample of customers was invited. More Info
Google Charts is about as easy to use as the rest of their applications. The UI is very well thought out, allowing you to add what you need, and customize it to your exact liking. The default theme is actually really nice, which helps as most of the time, customizing is not needed.
A de minimis incentive was given to thank the reviewer for their time. The incentive was not used to bias or drive a particular response, nor was the incentive contingent on a positive endorsement. More Info
No usability issues reported. Individual teams also have allocated areas which replace legacy shared drives on local LANs. Access to Sharepoint resources is fully integrated with corporate Active Directory with additional two-factor authentication required for administrative users. Users have access to Microsoft Services Hub which allows you to create, manage, and track support requests while staying current on Microsoft technologies with access to select self-paced learning paths
A de minimis incentive was given to thank the reviewer for their time. The incentive was not used to bias or drive a particular response, nor was the incentive contingent on a positive endorsement. More Info
Qlik Sense has a better and easy to learn user interface compared with other analytics tool which always help us to create regular and adhoc reports within the stipulated time frame and can be easily refreshed at a scheduled time and sent to multiple stakeholders for timely update regarding the Key metrics indicator.
A de minimis incentive was given to thank the reviewer for their time. The incentive was not used to bias or drive a particular response, nor was the incentive contingent on a positive endorsement. More Info
As a free tool with massively powerful, infinitely customisable charts that can be dynamically updated - Google Charts is my favourite data visualisation tool. However, my hatred of JavaScript does jade my view on it. This is the price of the tool though, and I'm glad it's available for me.
A de minimis incentive was given to thank the reviewer for their time. The incentive was not used to bias or drive a particular response, nor was the incentive contingent on a positive endorsement. More Info
A de minimis incentive was given to thank the reviewer for their time. The incentive was not used to bias or drive a particular response, nor was the incentive contingent on a positive endorsement. More Info
Qlik is great for companies with lots of business domains and departments because it scales well, especially if data that is reported is saved in SQL and similar structures. Its ease of use and good UI enables business units to create and manage their own reports. That removes a great burden of creating and managing/modifying these pages from the IT team. Overall, it's a win-win for both IT and business units.
A de minimis incentive was given to thank the reviewer for their time. The incentive was not used to bias or drive a particular response, nor was the incentive contingent on a positive endorsement. More Info
The face to face training I received was on SharePoint Administration. It was rushed as there was a lot of information to cover and the application of the labs weren't that great either. I like to be able to relate what I am learning to what I am currently doing.
A de minimis incentive was given to thank the reviewer for their time. The incentive was not used to bias or drive a particular response, nor was the incentive contingent on a positive endorsement. More Info
I like to learn at my own pace and online training allows for that. Additionally, you can skip through pieces of content that you already know or are already comfortable with. Microsoft actually offers great videos on their website for basic fundamental SharePoint Training. I have used these training videos in some of my own training sessions with end users.
A de minimis incentive was given to thank the reviewer for their time. The incentive was not used to bias or drive a particular response, nor was the incentive contingent on a positive endorsement. More Info
A de minimis incentive was given to thank the reviewer for their time. The incentive was not used to bias or drive a particular response, nor was the incentive contingent on a positive endorsement. More Info
Google Charts stacks up better since it is free and does not have the constant pressure for cost overruns, add-ons, annual maintenance and implementation services. The speed of using Google Charts is quick, saving users potentially weeks in getting up and going. For the readers of websites with limited resources, the application shows up nicely is look and feel with charts. Great way of showing data visually.
A de minimis incentive was given to thank the reviewer for their time. The incentive was not used to bias or drive a particular response, nor was the incentive contingent on a positive endorsement. More Info
The reasons for selecting MS SharePoint are: SharePoint provides ease of use and web design assistance and support SharePoint helps you schedule your content for publishing. enables users to share documents with external parties and offers a better internal structure of the content and better indexing and searching capabilities.
A de minimis incentive was given to thank the reviewer for their time. The incentive was not used to bias or drive a particular response, nor was the incentive contingent on a positive endorsement. More Info
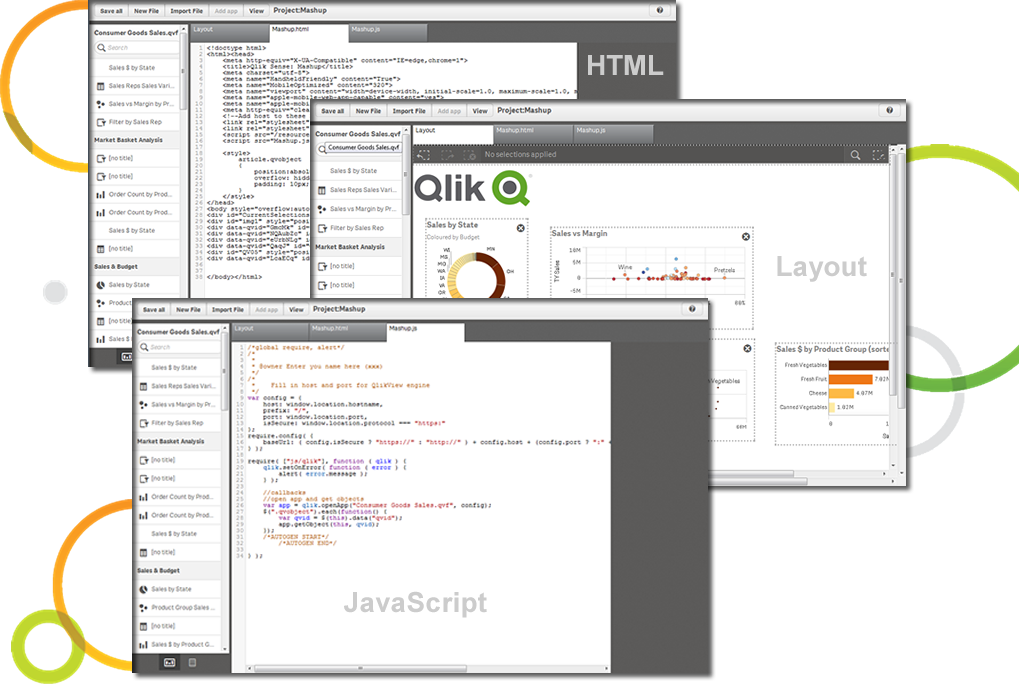
The customization of the platform opens up plenty of other options depending on the use cases. The API layer is incredibly rich and makes integration of Qlik based visualization into web pages a simple and effective pattern. It's been very easy to use with a great community made up of professionals. Qlik Sense has introduces artificial Intelligence into my data visualization and reporting activity.
A de minimis incentive was given to thank the reviewer for their time. The incentive was not used to bias or drive a particular response, nor was the incentive contingent on a positive endorsement. More Info
A de minimis incentive was given to thank the reviewer for their time. The incentive was not used to bias or drive a particular response, nor was the incentive contingent on a positive endorsement. More Info
A de minimis incentive was given to thank the reviewer for their time. The incentive was not used to bias or drive a particular response, nor was the incentive contingent on a positive endorsement. TR verified that a representative sample of customers was invited. More Info