Overview
ProductRatingMost Used ByProduct SummaryStarting Price
Grist
Score 9.9 out of 10
N/A
Grist combines the capabilities of spreadsheets, databases and app builders. Using a familiar spreadsheet interface, information can be organized as a relational database, and dashboards built using drag-and-drop. Solving spreadsheet problems Ensures data is well-structured and stored in one place with no duplication, no spreadsheet-wrangling, no merging documents. Collaboration on sensitive data Data is protected…
$8
per month per user
Microsoft Power BI
Score 8.5 out of 10
N/A
Microsoft Power BI is a visualization and data discovery tool from Microsoft. It allows users to convert data into visuals and graphics, visually explore and analyze data, collaborate on interactive dashboards and reports, and scale across their organization with built-in governance and security.
$168
per year per user
Mode
Score 9.0 out of 10
N/A
Mode, or Mode Analytics, from ThoughtSpot since the June 2023 acquisition, is a business intelligence platform that unifies company analytics by bringing data teams and business teams together, so analysts can provide rapid answers to strategic, ad hoc questions. And, business stakeholder can access relevant data to answer their own questions which can often detract more impactful work.N/A
Pricing
GristMicrosoft Power BIMode Analytics
Editions & Modules
Pro
$8
per month per user
Enterprise
Contact Sales
Power BI Pro
$14
per month (billed annually) per user
Power BI Premium
$24
per month (billed annually) per user
No answers on this topic
Offerings
Pricing Offerings
GristMicrosoft Power BIMode
Free Trial
YesYesYes
Free/Freemium Version
YesYesYes
Premium Consulting/Integration Services
NoNoNo
Entry-level Setup FeeNo setup feeNo setup feeNo setup fee
Additional DetailsPower BI Desktop is the data exploration and report authoring experience for Power BI, and is available as a free download.
More Pricing Information
Community Pulse
GristMicrosoft Power BIMode Analytics
Considered Multiple Products
Grist

No answer on this topic

Microsoft Power BI

No answer on this topic

Mode
Chose Mode Analytics
Mode Analytics is better for us than most -- because of its white-label feature, its security-first posture, and the fact that you can go directly to SQL.
Features
GristMicrosoft Power BIMode Analytics
BI Standard Reporting
Comparison of BI Standard Reporting features of Product A and Product B
Grist
-
Ratings
Microsoft Power BI
8.2
198 Ratings
0% above category average
Mode Analytics
8.5
9 Ratings
4% above category average
Pixel Perfect reports00 Ratings8.2169 Ratings9.34 Ratings
Customizable dashboards00 Ratings8.7197 Ratings8.49 Ratings
Report Formatting Templates00 Ratings7.8180 Ratings7.86 Ratings
Ad-hoc Reporting
Comparison of Ad-hoc Reporting features of Product A and Product B
Grist
-
Ratings
Microsoft Power BI
7.9
196 Ratings
2% below category average
Mode Analytics
7.4
9 Ratings
8% below category average
Drill-down analysis00 Ratings8.3193 Ratings7.18 Ratings
Formatting capabilities00 Ratings7.7193 Ratings6.79 Ratings
Integration with R or other statistical packages00 Ratings7.4143 Ratings7.39 Ratings
Report sharing and collaboration00 Ratings8.3191 Ratings8.78 Ratings
Report Output and Scheduling
Comparison of Report Output and Scheduling features of Product A and Product B
Grist
-
Ratings
Microsoft Power BI
8.0
189 Ratings
3% below category average
Mode Analytics
7.9
8 Ratings
4% below category average
Publish to Web00 Ratings8.1179 Ratings8.15 Ratings
Publish to PDF00 Ratings7.9174 Ratings5.88 Ratings
Report Versioning00 Ratings7.7145 Ratings7.74 Ratings
Report Delivery Scheduling00 Ratings8.3148 Ratings9.68 Ratings
Delivery to Remote Servers00 Ratings7.9111 Ratings8.34 Ratings
Data Discovery and Visualization
Comparison of Data Discovery and Visualization features of Product A and Product B
Grist
-
Ratings
Microsoft Power BI
7.7
189 Ratings
4% below category average
Mode Analytics
6.5
9 Ratings
20% below category average
Pre-built visualization formats (heatmaps, scatter plots etc.)00 Ratings8.3183 Ratings7.79 Ratings
Location Analytics / Geographic Visualization00 Ratings8.1168 Ratings5.56 Ratings
Predictive Analytics00 Ratings7.3138 Ratings6.46 Ratings
Pattern Recognition and Data Mining00 Ratings7.339 Ratings00 Ratings
Access Control and Security
Comparison of Access Control and Security features of Product A and Product B
Grist
-
Ratings
Microsoft Power BI
8.4
180 Ratings
1% below category average
Mode Analytics
9.5
2 Ratings
11% above category average
Multi-User Support (named login)00 Ratings8.7169 Ratings10.02 Ratings
Role-Based Security Model00 Ratings8.2148 Ratings9.02 Ratings
Multiple Access Permission Levels (Create, Read, Delete)00 Ratings8.2160 Ratings9.02 Ratings
Report-Level Access Control00 Ratings8.249 Ratings00 Ratings
Single Sign-On (SSO)00 Ratings8.6141 Ratings9.82 Ratings
Mobile Capabilities
Comparison of Mobile Capabilities features of Product A and Product B
Grist
-
Ratings
Microsoft Power BI
7.9
162 Ratings
2% above category average
Mode Analytics
-
Ratings
Responsive Design for Web Access00 Ratings7.6152 Ratings00 Ratings
Mobile Application00 Ratings7.5133 Ratings00 Ratings
Dashboard / Report / Visualization Interactivity on Mobile00 Ratings7.9155 Ratings00 Ratings
Application Program Interfaces (APIs) / Embedding
Comparison of Application Program Interfaces (APIs) / Embedding features of Product A and Product B
Grist
-
Ratings
Microsoft Power BI
7.6
116 Ratings
2% below category average
Mode Analytics
9.0
1 Ratings
15% above category average
REST API00 Ratings7.9104 Ratings9.01 Ratings
Javascript API00 Ratings7.585 Ratings00 Ratings
iFrames00 Ratings8.055 Ratings00 Ratings
Java API00 Ratings6.869 Ratings00 Ratings
Themeable User Interface (UI)00 Ratings7.491 Ratings00 Ratings
Customizable Platform (Open Source)00 Ratings8.444 Ratings00 Ratings
Best Alternatives
GristMicrosoft Power BIMode Analytics
Small Businesses
Stackby
Stackby
Score 8.9 out of 10
Yellowfin
Yellowfin
Score 8.7 out of 10
Yellowfin
Yellowfin
Score 8.7 out of 10
Medium-sized Companies
Microsoft Excel
Microsoft Excel
Score 8.9 out of 10
Reveal
Reveal
Score 10.0 out of 10
Reveal
Reveal
Score 10.0 out of 10
Enterprises
Microsoft Excel
Microsoft Excel
Score 8.9 out of 10
Kyvos Semantic Layer
Score 9.5 out of 10
Kyvos Semantic Layer
Score 9.5 out of 10
All AlternativesView all alternativesView all alternativesView all alternatives
User Ratings
GristMicrosoft Power BIMode Analytics
Likelihood to Recommend
9.9
(2 ratings)
8.5
(197 ratings)
8.1
(9 ratings)
Likelihood to Renew
-
(0 ratings)
9.5
(3 ratings)
-
(0 ratings)
Usability
-
(0 ratings)
8.3
(113 ratings)
8.1
(4 ratings)
Support Rating
-
(0 ratings)
10.0
(52 ratings)
7.4
(5 ratings)
Implementation Rating
-
(0 ratings)
9.0
(1 ratings)
-
(0 ratings)
User Testimonials
GristMicrosoft Power BIMode Analytics
Likelihood to Recommend
Grist Labs
This is well suited to someone (or a team) who are technically minded and have a dataset that they need to be able to use in many ways. It's less appropriate for a team who isn't technically minded and/or don't have the data they need to manipulate. It would be useful for things that you could use a database or spreadsheet for such as CRM, Advertising database, Business tracking, Health tracking etc.
Read full review
Microsoft
Has significantly improved collation of data and visualisation especially with business across Europe. Has given me the ability to see the Site availability at the click of a button to see which Site is in the "money" and seize opportunities based on Market data
Read full review
ThoughtSpot
Mode is a clear category winner for how it easy it is to go from interactive analysis to professional quality reporting. You can easily do all your SQL and quite a bit of R/Python. If you want to quickly go from your database to simple charts, this is your pick. If you need to do heavier data modeling, scheduling jobs, or ML, you'll need something else, like Databricks. In my opinion, the quality of visualizations and some developer/analyst features make Databricks an unacceptable substitute.
Read full review
Pros
Grist Labs
  • Provides amazing customer service, help, examples, and explains what they are having you do
  • The layout is easy
Read full review
Microsoft
  • Options for data source connections are immense. Not just which sources, but your options for *how* the data is brought in.
  • Constant updates (this is both good and bad at times).
  • User friendliness. I can get the data connections set up and draft some quick visuals, then release to the target audience and let them expand on it how they want to.
Read full review
ThoughtSpot
  • It allows me to undertake data visualization tasks by creating really insightful charts and dashboards
  • It allows for easy sharing and work collaboration on data analysis tasks
  • Mode has an easier to use SQL editor as well
  • I love how it organizes all our SQL data tables into easy-to-view data we can draw insights on
Read full review
Cons
Grist Labs
  • Making the user permissions more obvious on how to use them - They are highly adaptable, but hard to understand how to use them
  • Small changes such as auto colouring the choices/toggles options and being able to edit them once set.
  • Being able to copy the formatting from one column to the next
Read full review
Microsoft
  • It would be easier for users could Microsoft Power BI and Excel used the same programming languages.
  • Would like to see the online version of Microsoft Power BI be as powerful as the desktop version.
  • Publishing a Microsoft Power BI file online and then having to save the file is somewhat redundant.
  • Would like to export each page or chart as an image.
Read full review
ThoughtSpot
  • Date ranges aren't always the most intuitive to set, strangely
  • Faster refresh rates would be ideal
  • Would love more dynamic mobile device integration (alerts, etc)
Read full review
Likelihood to Renew
Grist Labs
No answers on this topic
Microsoft
Microsoft Power BI is an excellent and scalable tool. It has a learning curve, but once you get past that, the sky is the limit and you can build from the most simple to the most complex dashboards. I have built everything from simple reports with only a few data points to complex reports with many pages and advanced filtering.
Read full review
ThoughtSpot
No answers on this topic
Usability
Grist Labs
No answers on this topic
Microsoft
Automating reporting has reduced manual data processing by 50-70%, freeing up analysts for higher-value tasks. A finance team that previously spent 20+ hours per week on Excel-based reports now does it in minutes with Microsoft Power BI's automated Real-time dashboards have shortened decision cycles by 30-40%, enabling leadership to react quickly to sales trends, operational bottlenecks, and customer behavior.
Read full review
ThoughtSpot
For the advanced user already familiar with Python. It is just the same tool, already managed and connected to the data.
Read full review
Support Rating
Grist Labs
No answers on this topic
Microsoft
It is a fantastic tool, you can do almost everything related with data and reports, it is a perfect substitutive of Power Point and Excel with a high evolution and flexibility, and also it is very friendly and easy to share. I think all companies should have Power BI (or other BI tool) in their software package and if they are in the MS Suite, for sure Power BI should be the one due to all the benefits of the MS ecosystem.
Read full review
ThoughtSpot
Mode has dedicated agents who are online in a chatroom, ready to take on any questions and provide helpful feedback.
Read full review
Implementation Rating
Grist Labs
No answers on this topic
Microsoft
It was integrated with our erp easily and was accessible on cloud.
Read full review
ThoughtSpot
No answers on this topic
Alternatives Considered
Grist Labs
Grist is easier to use, faster, and loads quicker with heavy data.
Read full review
Microsoft
Microsoft Power BI is free. If I didn't want to create a custom platform (i.e. my organization insisted on an existing platform that I *had* to use), I'd use Microsoft Power BI. For any start-up or SMB, I'd just use Claude & Grok to build it quickly, also for free. Would not pay for Tableau or Sigma anymore. Not worth it at all.
Read full review
ThoughtSpot
We used both Qlik and Mode at our organization. The mode was used a quick analysis SQL tool while Qlik was our enterprise BI solution.
Read full review
Return on Investment
Grist Labs
  • It's saved a lot of time in both creating an advertising database and managing it week to week effectively. I had previously created in others that haven't worked, and this does, saving me a good 1 hour weekly, and 5 hours or more each time I had problems with the last ones
  • Being able to stay on track with this has meant I'm following up at the right time (advertisers) and keeping a professional manner and not losing business due to missed communication
  • Saving me $ from buying a program like Access (or Airtable monthly) and then the learning curve that that has. This has a much easier learning curve to say the least.
Read full review
Microsoft
  • Power BI usage reduced the effort of analytical reports creation by about 80%
  • Empowered all the level of employee to be more vigilant of the data and business insights, gained the profit of 8% overall.
  • AI-powered predictive analytics improved forecasting accuracy by 17%, that topped the overall sales.
Read full review
ThoughtSpot
  • Extremely positive. It's a key feature in our application.
  • Were it not for the account management bit, Mode would be hands-down our recommendation for anyone looking for cloud BI.
Read full review
ScreenShots

Grist Screenshots

Screenshot of the drag and drop dashboard editor used to build layouts.Screenshot of the custom user permissions that determine who can see what, down to each column and row.Screenshot of dynamic charts and reports that update with the click of a mouse.Screenshot of Grist's formula support for Excel-like functions or Python formulas. Technical users can drill into database structure in code view.

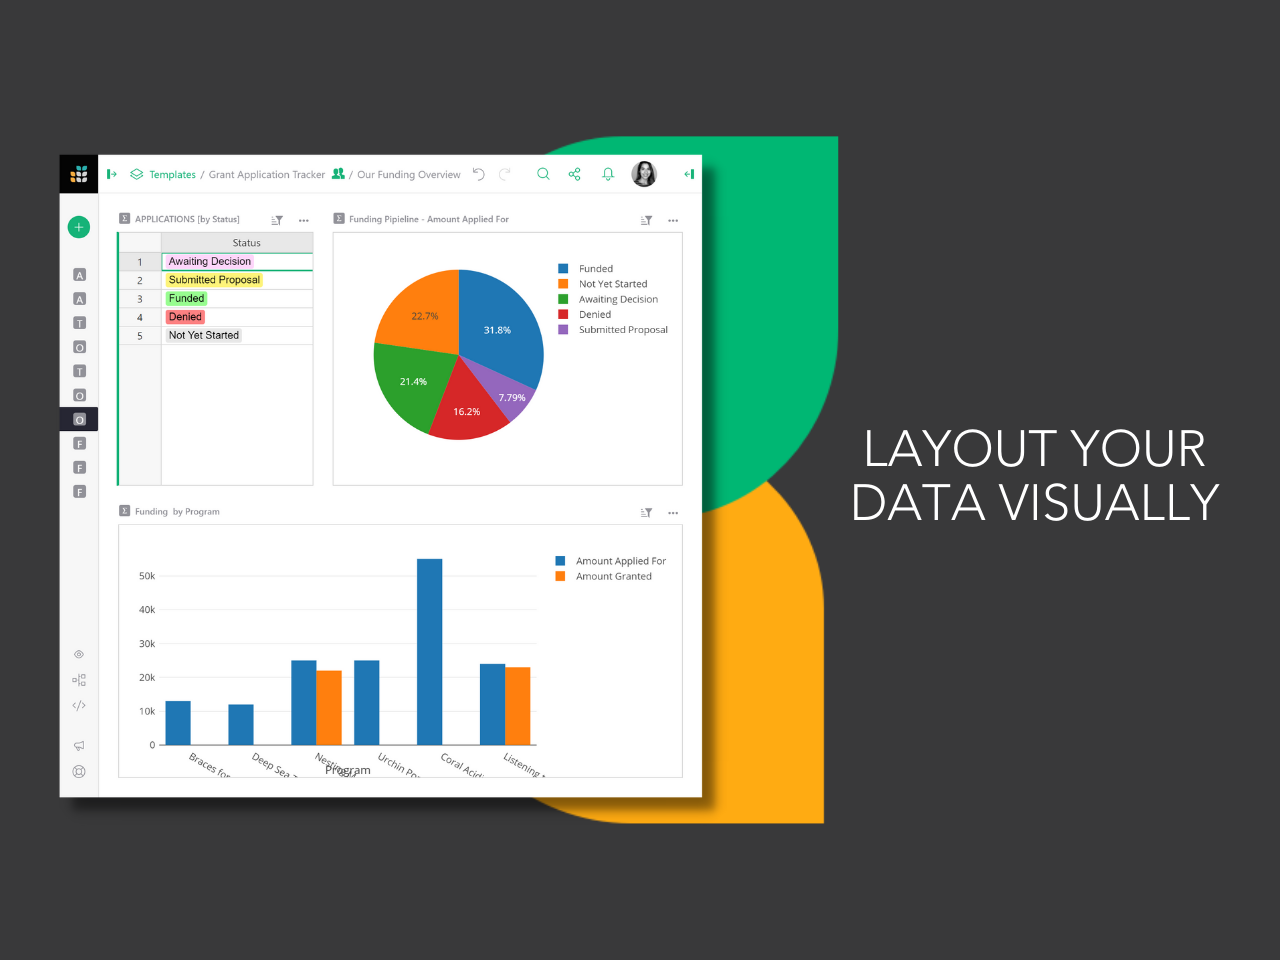
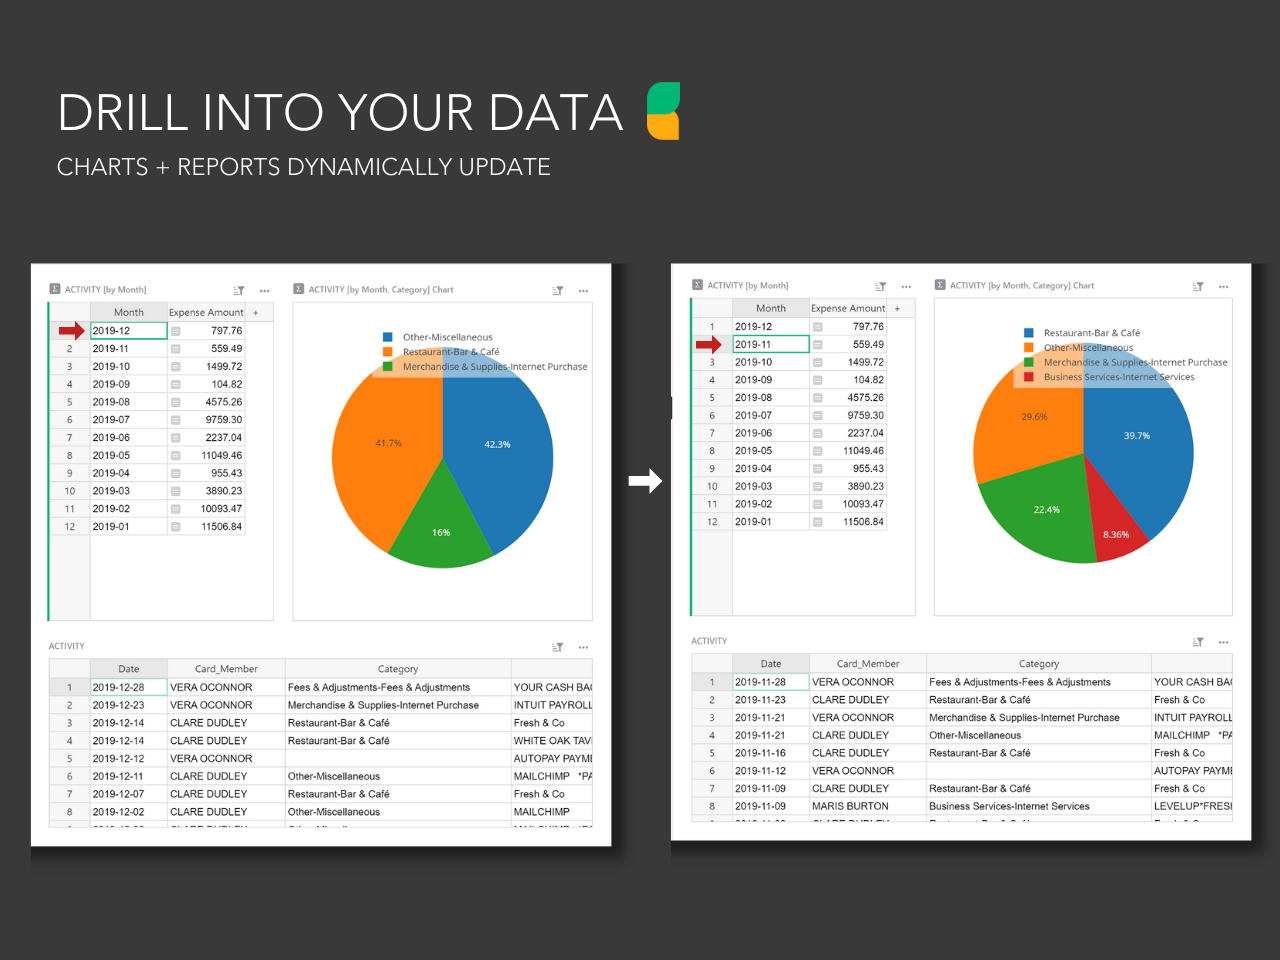
Microsoft Power BI Screenshots

Screenshot of Microsoft Power BI - Turns insights into impact for business usersScreenshot of Power BI integrates easily with Microsoft 365Screenshot of Microsoft Power BI - AI-Powered CapabilitiesScreenshot of Microsoft Power BI - Copilot can be used to create reportsScreenshot of Microsoft Power BI - Data HubScreenshot of Microsoft Power BI - Scales as organizational needs grow