
Robert Paul
Technical Administrator
Chose ManageEngine Site24x7
| Product | Rating | Most Used By | Product Summary | Starting Price |
|---|---|---|---|---|
 Icinga | N/A | Icinga is an open source network monitoring platform. It includes automation, modularized integration packages, and prebuilt alerts and reporting capabilities. | N/A | |
 ManageEngine Site24x7 | N/A | Site24x7 from ManageEngine is a full-stack application, website, server, cloud and network monitoring tool. Site24x7 offers code-level diagnostics and customizable error thresholds, end-to-end monitoring with topology visualization tools, and mobile accessibility. | $9 10 monitors | |
 Prometheus | N/A | Prometheus is a service monitoring and time series database, which is open source. | N/A |
| Icinga | ManageEngine Site24x7 | Prometheus | ||||||||||||||||||||||
|---|---|---|---|---|---|---|---|---|---|---|---|---|---|---|---|---|---|---|---|---|---|---|---|---|
| Editions & Modules | No answers on this topic |
| No answers on this topic | |||||||||||||||||||||
| Offerings |
| |||||||||||||||||||||||
| Entry-level Setup Fee | No setup fee | $1 monitors | No setup fee | |||||||||||||||||||||
| Additional Details | — | Each Pack will also support additional benefits such as Network interfaces, Applogs, Alert credits etc. You can also, purchase add-ons to create custom pricing options. Please visit the vendor's pricing page, for more information. | — | |||||||||||||||||||||
| More Pricing Information | ||||||||||||||||||||||||
| Icinga | ManageEngine Site24x7 | Prometheus | |
|---|---|---|---|
| Considered Multiple Products |  Icinga No answer on this topic |  ManageEngine Site24x7 Robert Paul Technical Administrator Chose ManageEngine Site24x7 | Prometheus No answer on this topic |
| Icinga | ManageEngine Site24x7 | Prometheus | |||||||||||||||||||||||
|---|---|---|---|---|---|---|---|---|---|---|---|---|---|---|---|---|---|---|---|---|---|---|---|---|---|
| Monitoring Tasks |
| ||||||||||||||||||||||||
| Management Tasks |
| ||||||||||||||||||||||||
| Reporting |
| ||||||||||||||||||||||||
| Security |
|
| Icinga | ManageEngine Site24x7 | Prometheus | |
|---|---|---|---|
| Small Businesses |  ConnectWise Automate Score 8.4 out of 10 |  Panda Systems Management Score 7.6 out of 10 |  InfluxDB Score 8.8 out of 10 |
| Medium-sized Companies |  Logz.io Score 8.5 out of 10 |  ManageEngine ADAudit Plus Score 9.0 out of 10 | No answers on this topic |
| Enterprises |  ScienceLogic SL1 Score 8.8 out of 10 | ManageEngine ADAudit Plus Score 9.0 out of 10 | No answers on this topic |
| All Alternatives | View all alternatives | View all alternatives | View all alternatives |
| Icinga | ManageEngine Site24x7 | Prometheus | |
|---|---|---|---|
| Likelihood to Recommend | 8.0 (7 ratings) | 8.6 (13 ratings) | 7.7 (35 ratings) |
| Likelihood to Renew | 9.0 (1 ratings) | - (0 ratings) | - (0 ratings) |
| Usability | - (0 ratings) | - (0 ratings) | 6.8 (3 ratings) |
| Support Rating | - (0 ratings) | 8.0 (2 ratings) | 5.0 (1 ratings) |
| Icinga | ManageEngine Site24x7 | Prometheus | |
|---|---|---|---|
| Likelihood to Recommend | Icinga GmbH
| ManageEngine, A Div of Zoho Corporation Pvt Ltd
| Open Source
 Mauricio Lozada System Engineer |
| Pros | Icinga GmbH
 Gabriel Ortiz Senior Infrastructure Engineer | ManageEngine, A Div of Zoho Corporation Pvt Ltd
 Rob Bates Public & Private Cloud Senior Engineer | Open Source
|
| Cons | Icinga GmbH
 Jamin Becker System Administrator | ManageEngine, A Div of Zoho Corporation Pvt Ltd
 Rob Domenico Senior Systems Administrator | Open Source
|
| Likelihood to Renew | Icinga GmbH
Jamin Becker System Administrator | ManageEngine, A Div of Zoho Corporation Pvt Ltd No answers on this topic | Open Source No answers on this topic |
| Usability | Icinga GmbH No answers on this topic | ManageEngine, A Div of Zoho Corporation Pvt Ltd No answers on this topic | Open Source
 Animesh Kumar Senior Member of Technical Staff |
| Support Rating | Icinga GmbH No answers on this topic | ManageEngine, A Div of Zoho Corporation Pvt Ltd
 Wes Dunaway Senior System Architect | Open Source
|
| Alternatives Considered | Icinga GmbH
| ManageEngine, A Div of Zoho Corporation Pvt Ltd
Robert Paul Technical Administrator | Open Source
|
| Return on Investment | Icinga GmbH
| ManageEngine, A Div of Zoho Corporation Pvt Ltd
| Open Source
|
| ScreenShots | ManageEngine Site24x7 Screenshots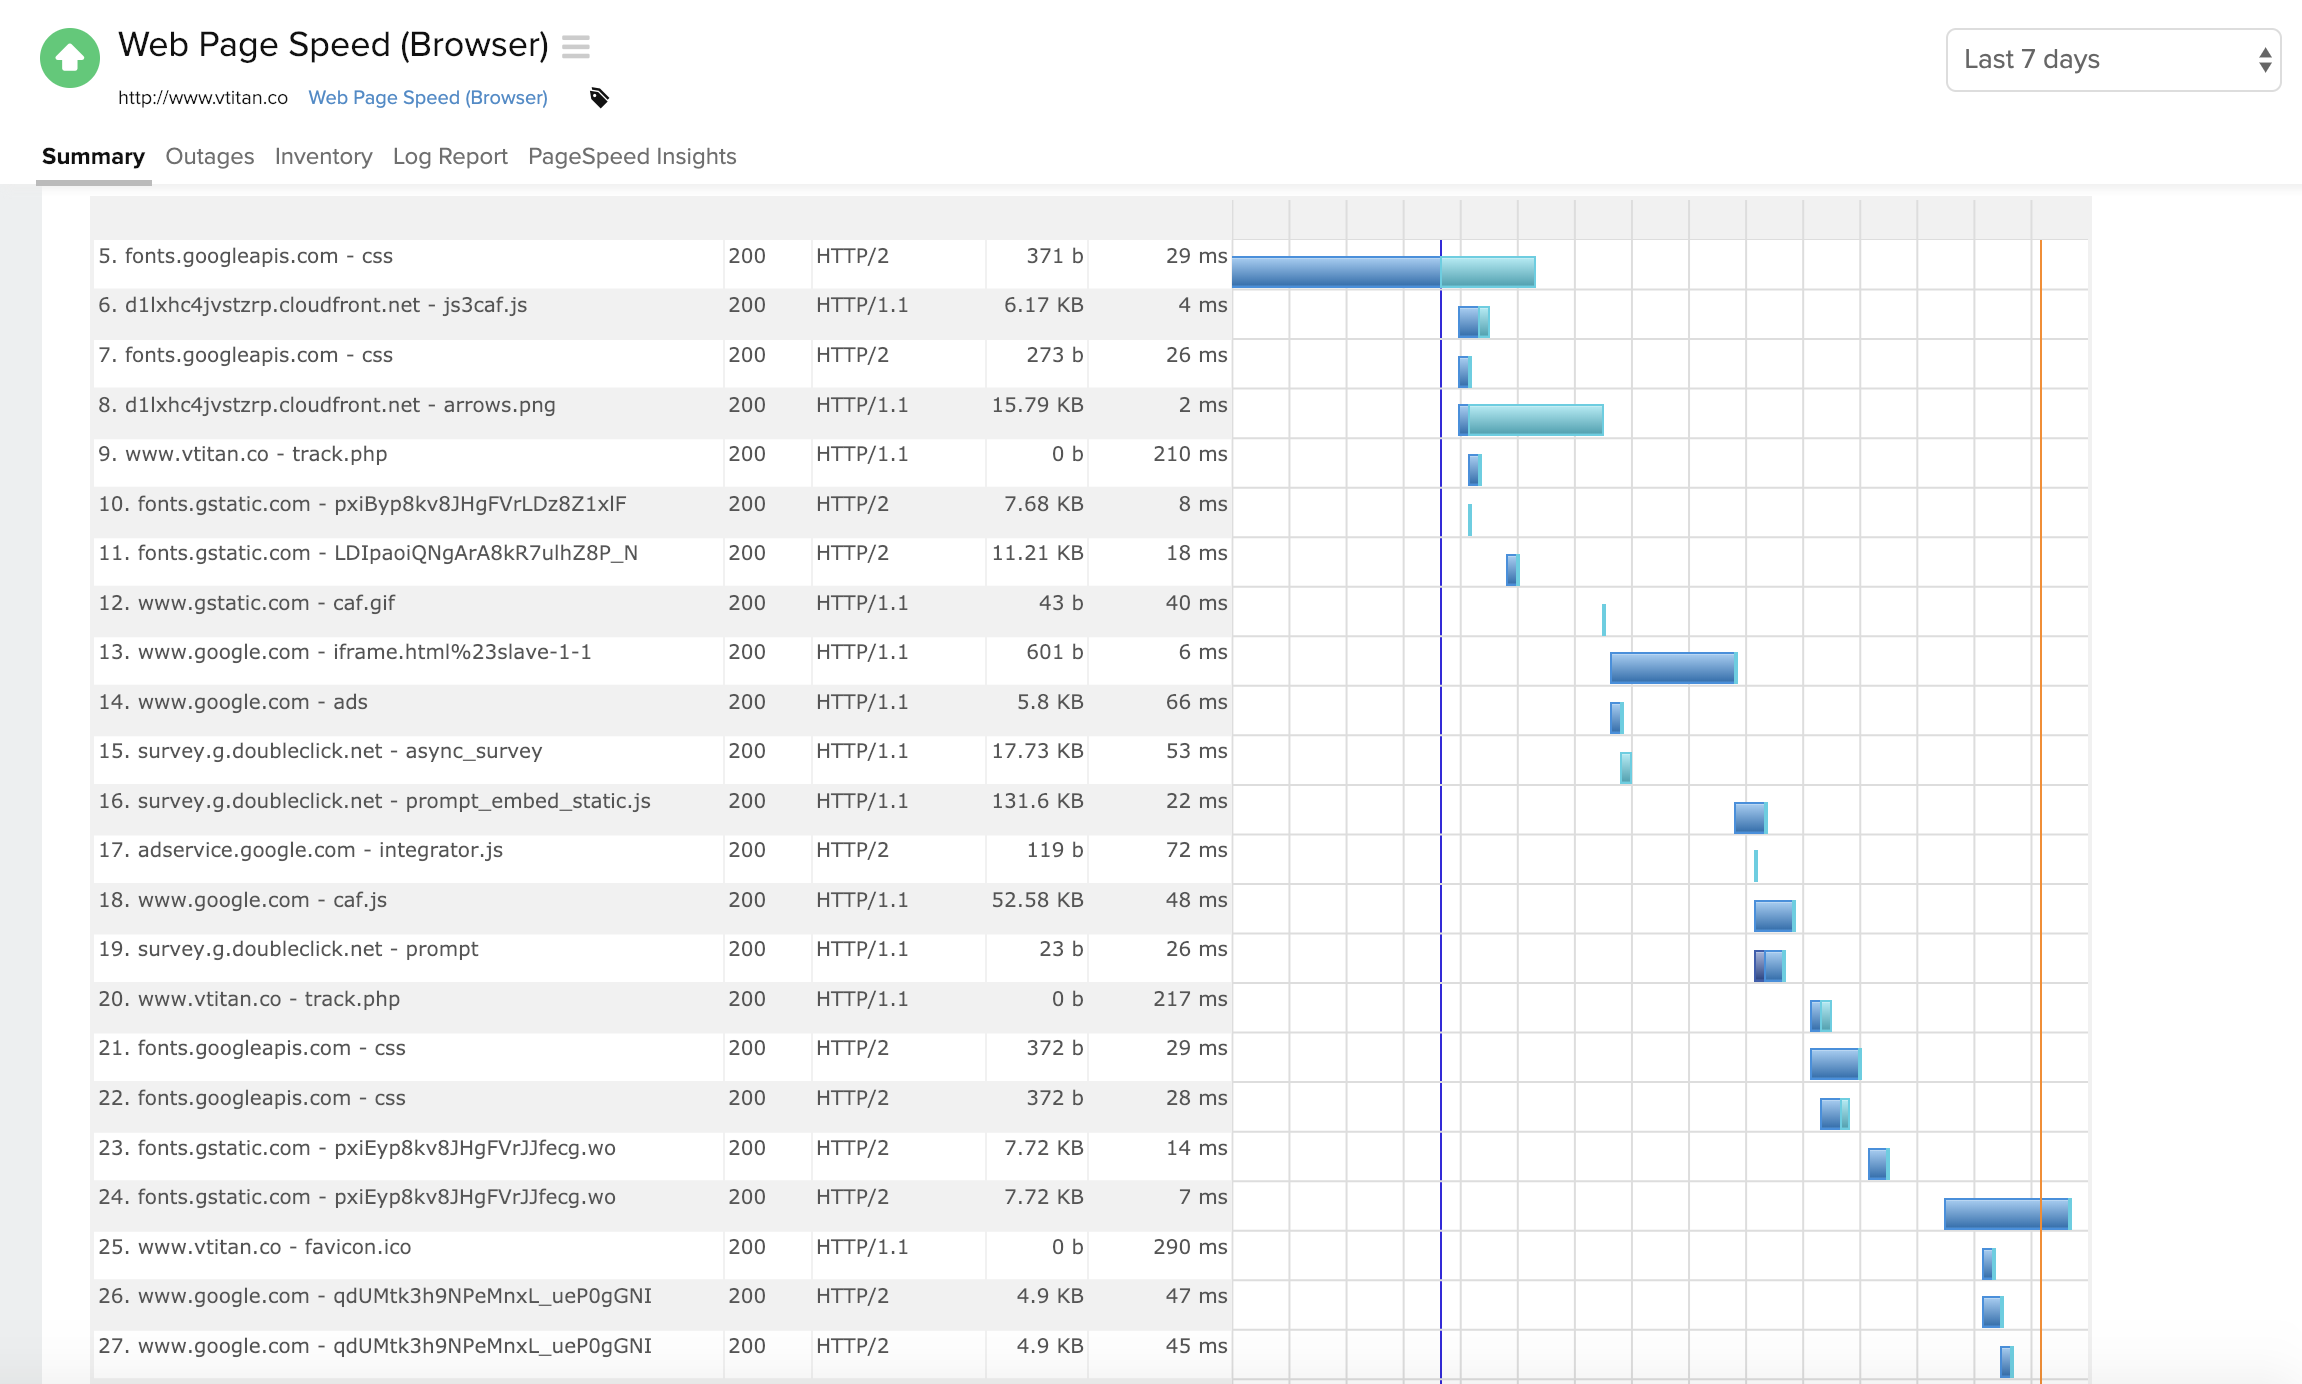      |