Looker is a BI application with an analytics-oriented application server that sits on top of relational data stores. It includes an end-user interface for exploring data, a reusable development paradigm for data discovery, and an API for supporting data in other systems.
N/A
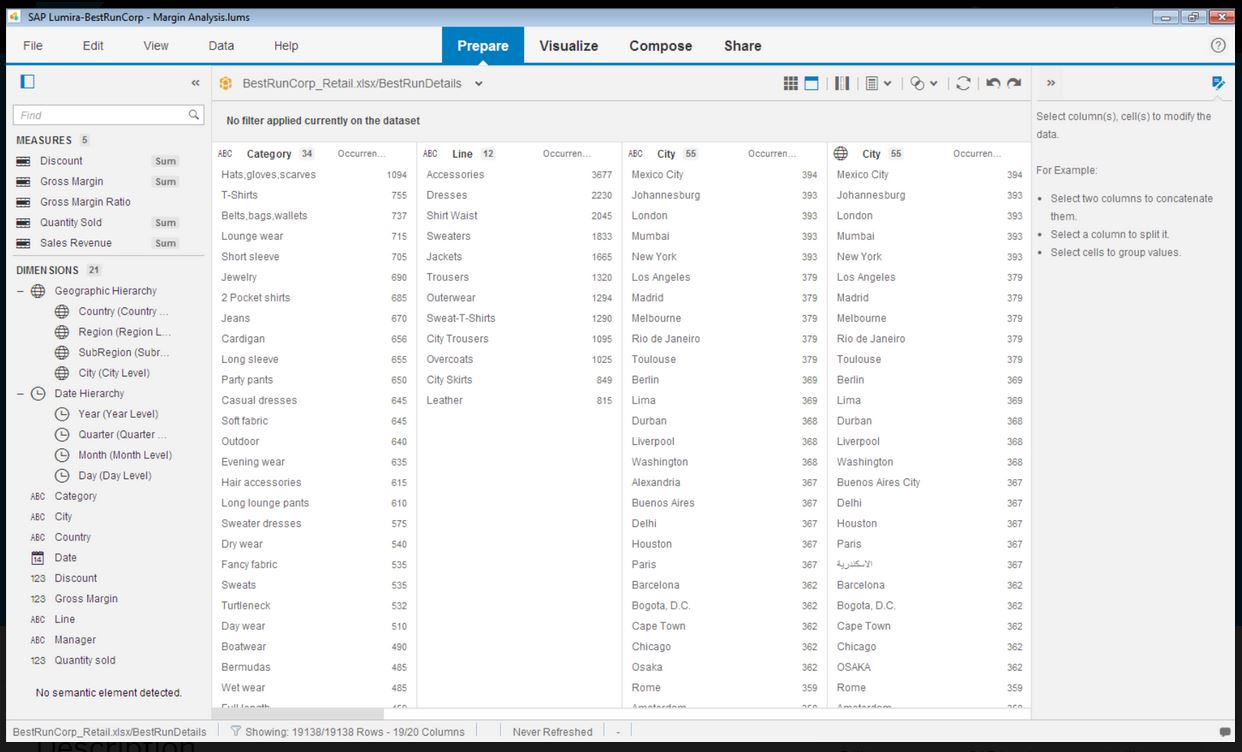
SAP Lumira Discovery
Score 7.2 out of 10
N/A
SAP Lumira Discovery is SAP’s data visualization and discovery application. It facilitates data discovery, visualization, and analysis by assisting users with creation of dashboards, infographics, presentations, data facets, tag clouds, and more.
When data drives potential for new orders, Looker earns its place in our tech stack. If, on the other hand, we are hoping for pipeline generation, Looker is useful if you are willing to repeatedly go check customer utilizations .... it is not appropriate if you are hoping to automate data analysis for this purpose.
Infographics derived from specific data sources appears to be well suited for development using Lumira. The development of executive level dashboards was less appropriate from my perspective. The software does not provide sufficient demonstration or samples for the users to learn from in my opinion.
Show visited pages - sessions, pageviews - which programs are viewed the most.
Displays session source/medium views to see where users are coming from.
It shows the video titles, URLs, and event counts so we can monitor the performance of our videos.
It gives a graphic face to the numbers, such as using bar charts, pie graphs, and other charts to show user trends or which channels are driving engagement.
Our clients like to see the top pages visited for a month.
I like the drop-and-drag approach, and building charts is a little easier than it was before.
Even though the process of creating visualizations of data is now greatly improved, it could still be a lot better as users become accustomed to this kind of tool and bring forward edge cases the developers did not anticipate.
It would be awesome to have a cross platform tool that works on more than just Windows.
I give it this rating because it deems as effective, I am able to complete majority of my tasks using this app. It is very helpful when analyzing the data provided and shown in the app and it's just overall a great app for Operational use, despite the small hiccups it has (live data).
Looker is relatively easy to use, even as it is set up. The customers for the front-end only have issues with the initial setup for looker ml creations. Other "looks" are relatively easy to set up, depending on the ETL and the data which is coming into Looker on a regular basis.
SAP Lumira is very good self service analytical tool with powerful capabilities. However need to look into other SAP products in BI space, like SAP SAC. SAP Lumira is more used for custom and complex analytical need in business intelligence area. Also SAP Lumira is going out of maintenance in coming future replaced by SAP SAC.
Lumira is a desktop application runs in its own JVM. It installs its own java runtime libraries to avoid any core java version conflicts. The availability of the application is completely relies on individual machine hardware configuration. On a decent desktop, it performs well and always launches in either 32 or 64 bit environment based on the hosts system's OS
Somehow resources heavy, both on server and client. I recommned at least 50Mbs data rate and high performance desktop comouter to be abke to run comolex tasks and configure larger amount of data. On the other hand, the client does not need to worry when viewing, the performance is usually ok
The performance is linear with amount of data that is being explored. We have done some benchmarks acquiring 10million data cells without having any performance problems. We need to make proper adjustments to jvm run time properties to start with higher heap size and other parameters that optimizes the run time performance
Never had to work with support for issues. Any questions we had, they would respond promptly and clearly. The one-time setup was easy, by reading documentation. If the feature is not supported, they will add a feature request. In this case, LDAP support was requested over OKTA. They are looking into it.
It does not have many bugs or issues since not a lot of new features are being added. The customer support for SAP Lumira Discovery is good and anyone considering this as a self-service tool would be happy. It integrates well in the SAP BI suite of products and the overall experience is positive.
Most of the user guides are pretty comprehensive and very easy to understand. The product itself is designed to be self-serve tool, did not need much of the end-user training. Most of the training we had is to how to read the data, how to explore the data, how to acquire the data etc.
Installing the desktop software on end-user machines is always challenging. The machine specifications are the biggest factor when running Lumira and be able to handle large datasets during data exploration. This often demands beefy machines at least for power-users. Although Lumira software licensing is not a big problem but managing partner's extensions and keeping track of their individual licenses may be an issue. If there is a way to bundle the more popular extensions such as vSQL or vOLAP should be bundled in core product and offer them as part of Lumira license instead of a separate license which causer operational burden.
Looker Studio, you can easily report on data from various sources without programming. Looker Studio is available at no charge for creators and report viewers. Enterprise customers who upgrade to Looker Studio Pro will receive support and expanded administrative features, including team content management. So it's good.
Even though SAP Analytics Cloud is considered to be better in aspects such as data connectivity or analytics, we decided to choose Lumira as it was easier to understand, learn and use. As our business is not really that big and does not require the inclusion of large amounts of data, Lumira was overall the safest and most comfortable option. Also, some members in our team had previous knowledge so it was easier to adapt
Enterprise wide implementation is a challenge with data security and trustedness. No easy installation can be done across the enterprise. no upgrade paths also available from SAP. They have so much of experience with desktop implementation, there it could be a controlled environment with a capital budget. These may be resolved in the upcoming releases
Looker has a poignant impact on our business's ROI objectives. As an advertising exchange we have specific goals for daily requests and fill, and having premade Looks to monitor this is an integral piece of our operational capability
To facilitate an efficient monthly billing cycle in our organization, Looker is essential to track estimated revenue and impression delivery by publisher. Without the Looks we have set up, we would spend considerably more time and effort segmenting revenue by vertical.
Looker's unique value proposition is making analytical tools more digestible to people without conventional analytical experience. Other competing tools like Tableau require considerably more training and context to successfully use, and the ability to easily plot different visualizations is one of its greatest selling points.