Microsoft Power BI is a visualization and data discovery tool from Microsoft. It allows users to convert data into visuals and graphics, visually explore and analyze data, collaborate on interactive dashboards and reports, and scale across their organization with built-in governance and security.
$168
per year per user
Quantrix
Score 7.4 out of 10
N/A
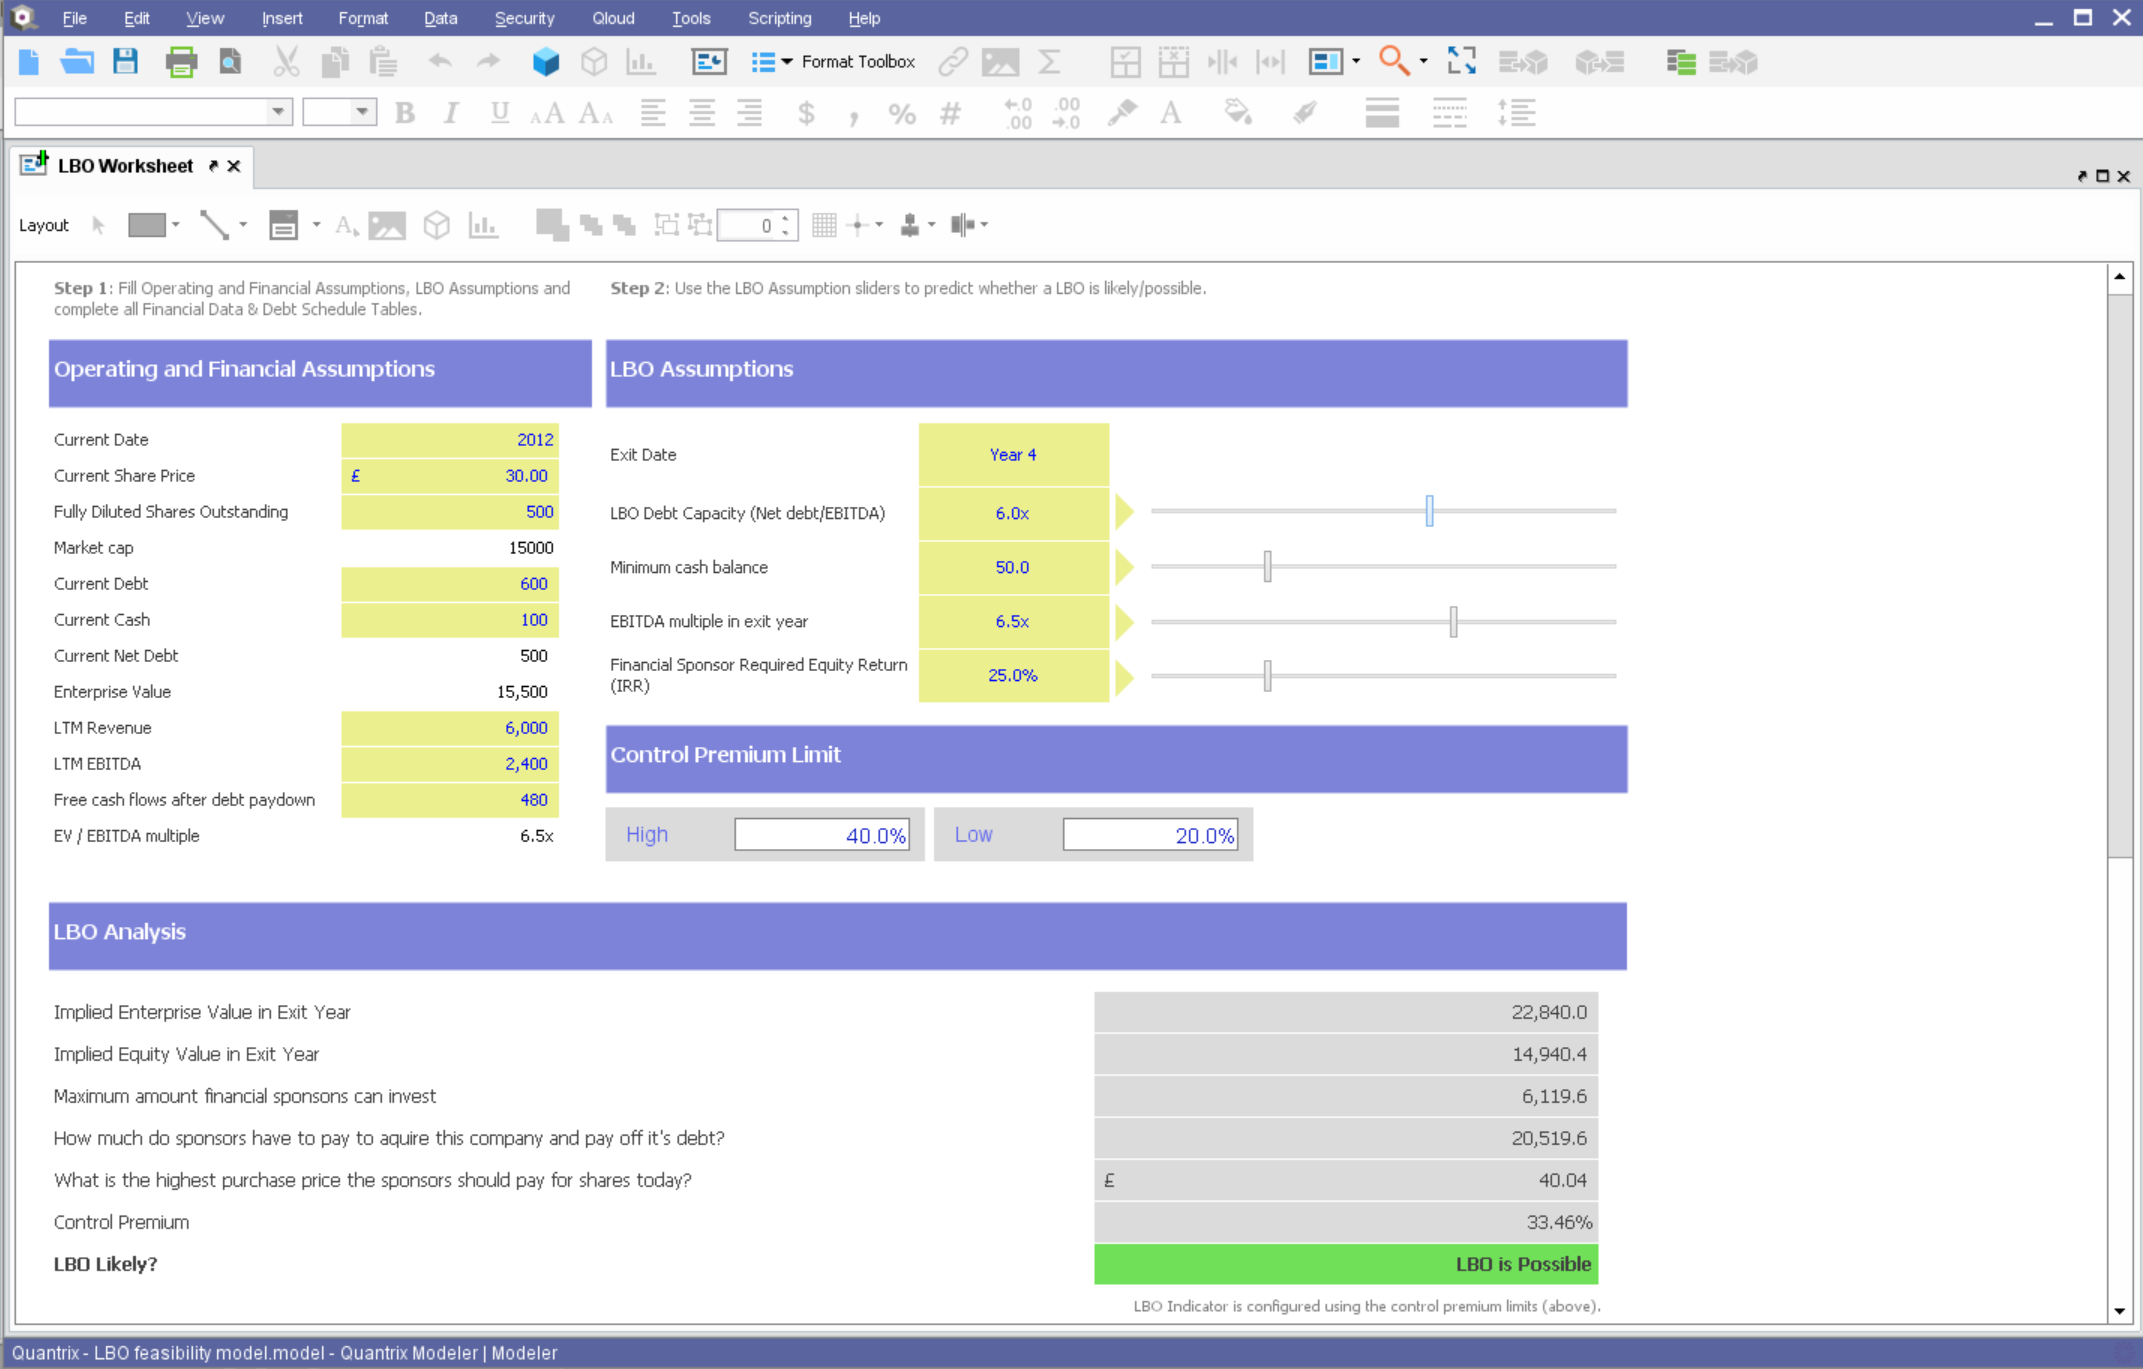
Quantrix is designed to allow users to address the limitations and risks inherent to spreadsheets when developing business-critical models. According to the vendor, this solution offers unmatched capability for forecasting, planning, budgeting, risk modeling and visual analytics, and also allows users to develop ‘what if’ scenarios and model the financial and operational impact of business decisions. Additionally, the vendor says sharing insight is made easier through the creation of interactive…
N/A
SAP Analytics Cloud
Score 8.1 out of 10
N/A
The SAP Analytics Cloud solution brings together analytics and planning with integration to SAP applications and access to heterogenous data sources. As the analytics and planning solution within SAP Business Technology Platform, SAP Analytics Cloud supports trusted insights and integrated planning processes enterprise-wide to help make decisions without doubt.
$36
per month per user
Pricing
Microsoft Power BI
Quantrix
SAP Analytics Cloud
Editions & Modules
Power BI Pro
$14
per month (billed annually) per user
Power BI Premium
$24
per month (billed annually) per user
No answers on this topic
SAP Analytics Cloud for Business Intelligence
$36.00
per month per user
SAP Analytics Cloud for Planning
Price upon request
per month per user
Offerings
Pricing Offerings
Microsoft Power BI
Quantrix
SAP Analytics Cloud
Free Trial
Yes
Yes
Yes
Free/Freemium Version
Yes
No
No
Premium Consulting/Integration Services
No
Yes
No
Entry-level Setup Fee
No setup fee
No setup fee
No setup fee
Additional Details
Power BI Desktop is the data exploration and report authoring experience for Power BI, and is available as a free download.
Quantrix Modeler is licensed on a per user subscription basis.
A 30-day trial with SAP Analytics Cloud is available, supporting analytics enterprise-wide. A trial can be extended up to 90 days on request.
Microsoft BI tool does a better job than most of the other software. The reason is excellent visualizations and its capability to connect with various other software and data sources. Tableau does a better job when it comes to tutorials and being more user-friendly. Also …
SAP Analytics Cloud blends data much better than Mircosoft Power BI because it uses one large dataset in its model instead of the entity-relationship model in Power BI. Everything in Power BI has to be done in the model, which diminishes its capabilities. SAC also has data …
Anaplan is a tool for planning, but with very less reporting options. Integration of Anaplan with SAP source is always a problem and has very less connection possibilities. Even though Anaplan provides very powerful planning features, we have to use multiple tools in the …
I would rate Tableau as number one choice due to intuitive, drag and drop and advanced visualizations. We can build highly customizable reports. Whereas SAP Analytics Cloud(SAC) got less customizable reports but excellent with SAP systems, strong in planning and budgeting tools.
Integration with SAP is the key feature to go for SAC with perks of SAP IQ etc offered from SAP. Usability is quite eased in SAC - makes it easy for users to use and develop their own dashboarding. Cloud is one more feature which enables to the cloud world from SAP and probable …
we have to explicitly publish our data in the form of odata service from SAP system, this require a good amount of work for API development and requirement of SAP Developer skill set. With SAP Analytics Cloud (SAC) this is not needed and the adoption of SAC becomes very easy
All three above examples are market leaders, being an sap consultant and as SAP Analytics Cloud is having tight integration with sap and offers fairly all the important features i use it.
Since we have S4/Hana cloud so accessing data from backend system is seamlessly done in SAP Analytics Cloud with the help of SAP Analytics Cloud cloud connector. We have BI/BW system. Data is loaded into this systems and fetch on SAP Analytics Cloud.
SAC lacks some of the prominent features found in other tools. But a fully functional tool. The way live connections work with SAC and better integration with SAP back-end products makes SAC a preferred choice.
SAC is an extension of our decision to use Datasphere as our Data Warehouse / Data Fabric Solution, which is really an extension of our decision to use SAP as our ERP.
Because the connectivity is natural and is easy to work and develop everything behind the same brand. Also is easy to have all the data under control on this software and easily consume in SAP Analytics Cloud Review. As I said, great advantage of using sap that means all are …
Has significantly improved collation of data and visualisation especially with business across Europe. Has given me the ability to see the Site availability at the click of a button to see which Site is in the "money" and seize opportunities based on Market data
If you find yourself in the ocean of traditional spreadsheets, overwhelmed by broken links, errors, model audit problems, hardwiring, etc. here is a lifebuoy for you. If you want to have full flexibility in your budgeting and forecasting in contrast to ERPs with rigid structures and one-size-fits-all concept. If you are small or medium size company and do not want to invest in costly enterprise solutions. If you need a fast implementation https://youtu.be/5W_q5Xhw5fg
>> Using SAC predictive analytics capabilities for inventory management in a Production line setup has helped generate Purchase Requisitions and Purchase Orders for raw or semi-finished goods without much head-banging into Demand management rules. It does it beautifully with seamless integration with HANA core MM and PP modules, along with BI integration. It has resulted in 30% greater warehouse storage capacity, thereby saving revenue from piled-up inventory and associated manpower costs. >> SAC sometimes shows latency in working out a large data set, thus giving a poor user experience compared to its competition. Also, it may occasionally show misinterpretations when embedding data from 3rd-party systems into the HANA core dataset.
Options for data source connections are immense. Not just which sources, but your options for *how* the data is brought in.
Constant updates (this is both good and bad at times).
User friendliness. I can get the data connections set up and draft some quick visuals, then release to the target audience and let them expand on it how they want to.
Building complex financial planning model availing of a multidimensional data structure coupled with a powerful formula language, with the immediacy and intuitiveness typical of spreadsheets
Implement quickly model modifications (new products, new scenarios, new time periods) simply adding new "items" to "categories" (corresponding to dimensions in a multidimensional data model)
Scale up models to very large datasets with very fast computation times
Easily import data from text files, other Quantrix models and external databases via DataLink and DataNAV
Save snapshots of tables computed in Quantrix to external databases via DataPush
It makes it easier yo analyse order and related records easily.
We can easily maintain and track the performance of employees in organisation.
Can easily track various aspects for the growth of an organisation thus allowing real time analysis and tracking of organisation's growth and performance.
Hard to be critical of the Quantrix team as I know they strive to produce the best product possible. I suppose the next thing on my wish list would be the application of the new Solver functionality to be available in the Qloud.
A big help for new users would be a good book on transitioning from Excel or other environment into Quantrix. I know first hand it can be difficult to transition when having to learn the program through a help guide, forums and tech support. I had a lot of trial and error in my journey to producing the desired models. On one hand it was a valuable method as it taught me a lot of what not to do, but I will admit it was not the most efficient way to do things.
Would also love to see local user groups being formed at some point in the future. Quantrix puts on a fantastic conference once a year in beautiful Maine, but it is a big journey for someone in Southern California (and limited to one or two days a year). I would like to see some local chapters formed in different areas of the country so local Quantrix users can get together more often and collaborate (maybe a quarterly or semi-annual meetup?). Our Quantrix community is still relatively small and may be a difficult task for some areas, but is also the very reason why this would be great idea.
SAC supports various data sources, but improvements in the ease of connecting to and integrating with certain data repositories, especially non-SAP databases, would enhance the platform's versatility and integration capabilities.
An offline mode for SAC could be valuable for users who need to access and analyze data without an internet connection. Additionally, optimizing performance for large datasets and complex visualizations would contribute to a smoother user experience.
Microsoft Power BI is an excellent and scalable tool. It has a learning curve, but once you get past that, the sky is the limit and you can build from the most simple to the most complex dashboards. I have built everything from simple reports with only a few data points to complex reports with many pages and advanced filtering.
We are planning to review the licensing as we have issues with SAC dealing with huge datasets. Analytics area is good for import models but when we have live connections in place that's when we have issue with SAC dealing with huge datasets in live be it BW or be it HANA models in the backend.
Automating reporting has reduced manual data processing by 50-70%, freeing up analysts for higher-value tasks. A finance team that previously spent 20+ hours per week on Excel-based reports now does it in minutes with Microsoft Power BI's automated Real-time dashboards have shortened decision cycles by 30-40%, enabling leadership to react quickly to sales trends, operational bottlenecks, and customer behavior.
On a scale of 1 to 10, I would rate 8 SAP Analytics Cloud's overall usability as a 7. SAC has a clean, modern user interface with drag-and-drop features. It is an integrated platform that combines reporting, planning, and predictive analytics in one tool. It has Real-time connectivity with SAP data sources like S/4HANA.
Self-service analytics capabilities allow non-technical users to build simple dashboards.
I would rate SAP Analytics Cloud an 8 out of 10 for scalability. It offers a flexible, cloud-based architecture that supports expansion across departments and geographies. The platform adapts well to growing data volumes and user needs, making it a strong choice for organizations looking to scale analytics capabilities efficiently.
I would rate SAP Analytics Cloud’s performance an 8 out of 10. Pages generally load quickly, and reports run within a reasonable time frame, even with complex datasets. Integration with other systems is smooth and doesn’t noticeably affect performance. Overall, it’s a responsive and efficient tool for business analytics. But
It is a fantastic tool, you can do almost everything related with data and reports, it is a perfect substitutive of Power Point and Excel with a high evolution and flexibility, and also it is very friendly and easy to share. I think all companies should have Power BI (or other BI tool) in their software package and if they are in the MS Suite, for sure Power BI should be the one due to all the benefits of the MS ecosystem.
Since the implementation stage, the support team has been very helpful and assisting. Even in the later stages, the tech team had quite a rapid response. In general, SAP has provided us with great customer support, let it be for a specific product of SAP or for integration of different modules.
In hindsight, it would have been easier to have someone there in person. Questions were answered, but with 11 participants, it got a bit chaotic online
SAC is a simple solution ad it works fine when connecting it to other SAP tools. On the other hand, connecting it to third party solutions brings difficulties when there's no previous design and the objetives are not clear. It is really important to integrate Business users from the start to provide with valuable business insights
Microsoft Power BI is free. If I didn't want to create a custom platform (i.e. my organization insisted on an existing platform that I *had* to use), I'd use Microsoft Power BI. For any start-up or SMB, I'd just use Claude & Grok to build it quickly, also for free. Would not pay for Tableau or Sigma anymore. Not worth it at all.
Overall, I was not part of the ultimate decision to purchase Quantrix. I terms of user-friendliess and robust reporting capabilities I do think Tableau has Quantrix outclassed. That being said, Quantrix does provide more in-depth analyses for our relevant data and provides better modeling for our forecasts out of the box. The accuracy of the tools output is also much better
SAP Analytics Cloud and Power BI are both tools that help businesses understand their data, but they have some differences. SAC, made by SAP, works well if your company already uses other SAP products. It's in the cloud, easy to use, and has features for analyzing data, getting insights, and planning for the future. Power BI, made by Microsoft, can be used in the cloud or on your own computers. It fits well with Microsoft tools, is easy to use, and can do advanced data analysis. SAC has built-in planning tools, while Power BI needs extra tools for detailed planning
Is good for use across multiple locations. It allows users to access data and reports from anywhere, regardless of their location. Can consolidate data from various sources, including different SAP systems and external sources, which facilitates cross-location analysis. SAC enables access to data and models from SAP Datasphere to create new stories. Detailed permissions can be defined for cross-departmental use.
Capacity forecasting used to take hours to calculate with a ton of manual modifications. Quantrix has automated that so a model can be updated at any time with a click of a button
The accuracy of the models is incredible. It took some tweaking to add in data scubbers, but now it runs almost flawlessly
The confidence the management teams have in the output of the model is amazing. Before, people would question the output, have you rebuild it, and then compare. Now the report comes out and the output has high confidence.
Many manual data manipulations and exports in Excel have been replaced by the tool, providing management with improved insight into the amount of time spent at each stage of an invoice's lifetime, allowing bottlenecks to be discovered.
We now have more insight into the data, and people with little technical experience can easily build stories.