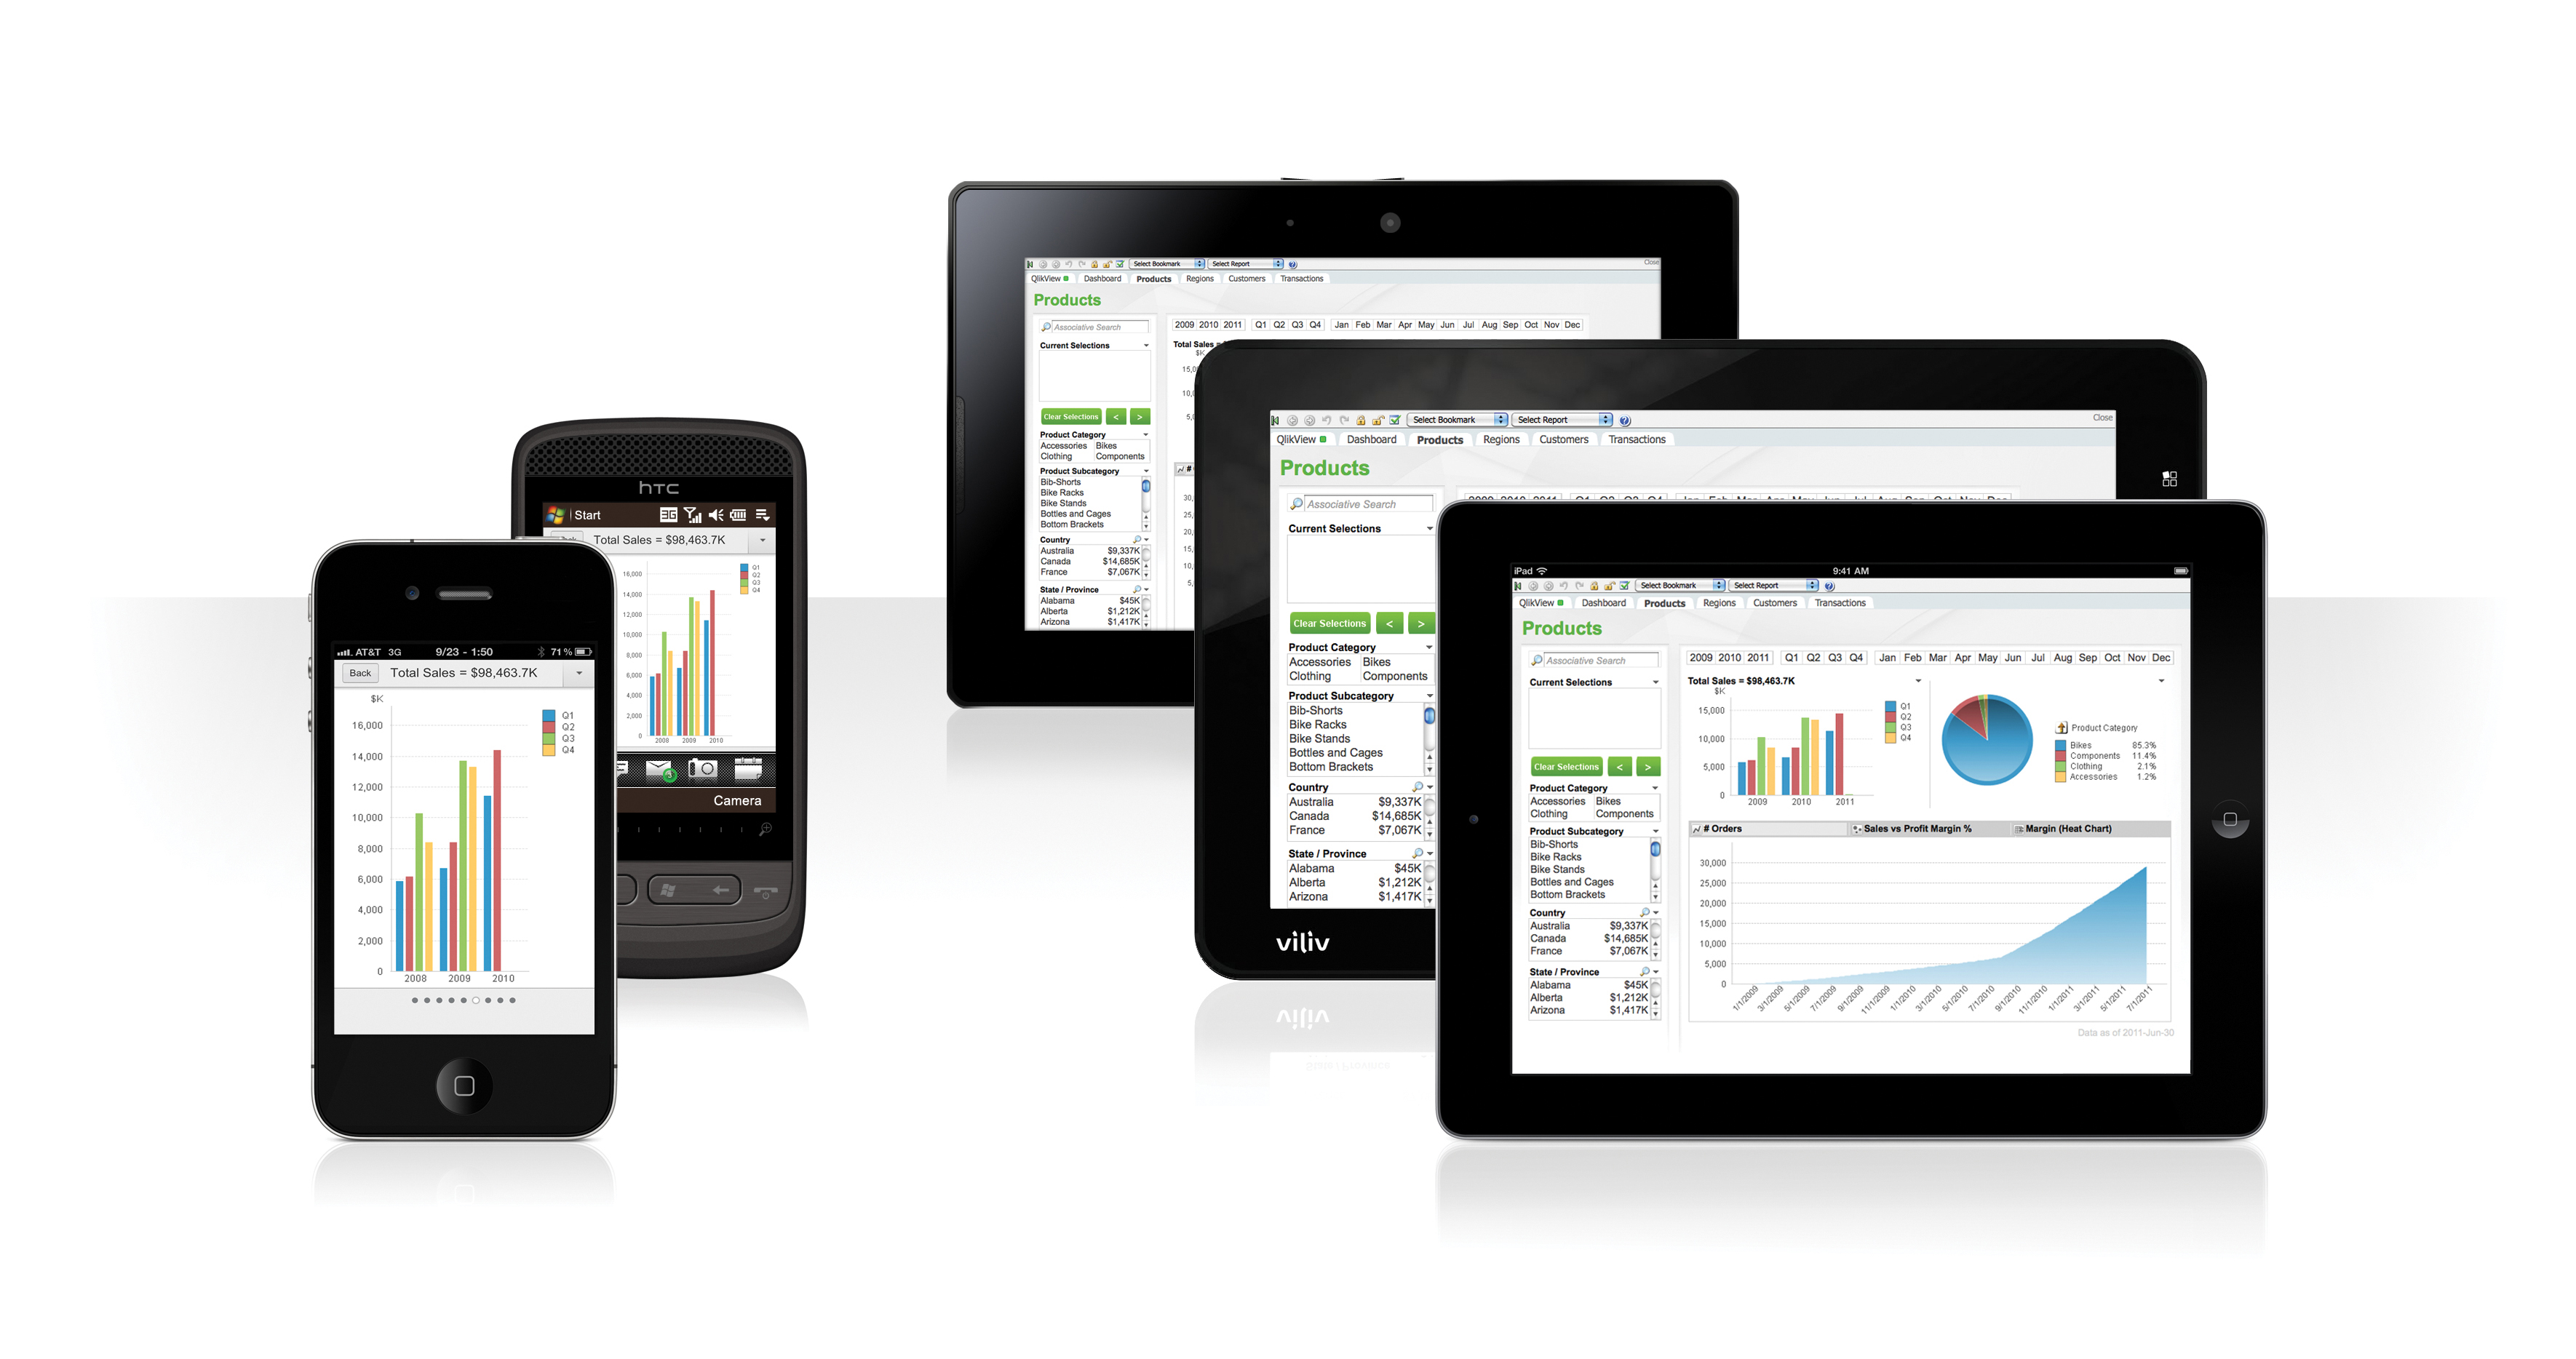
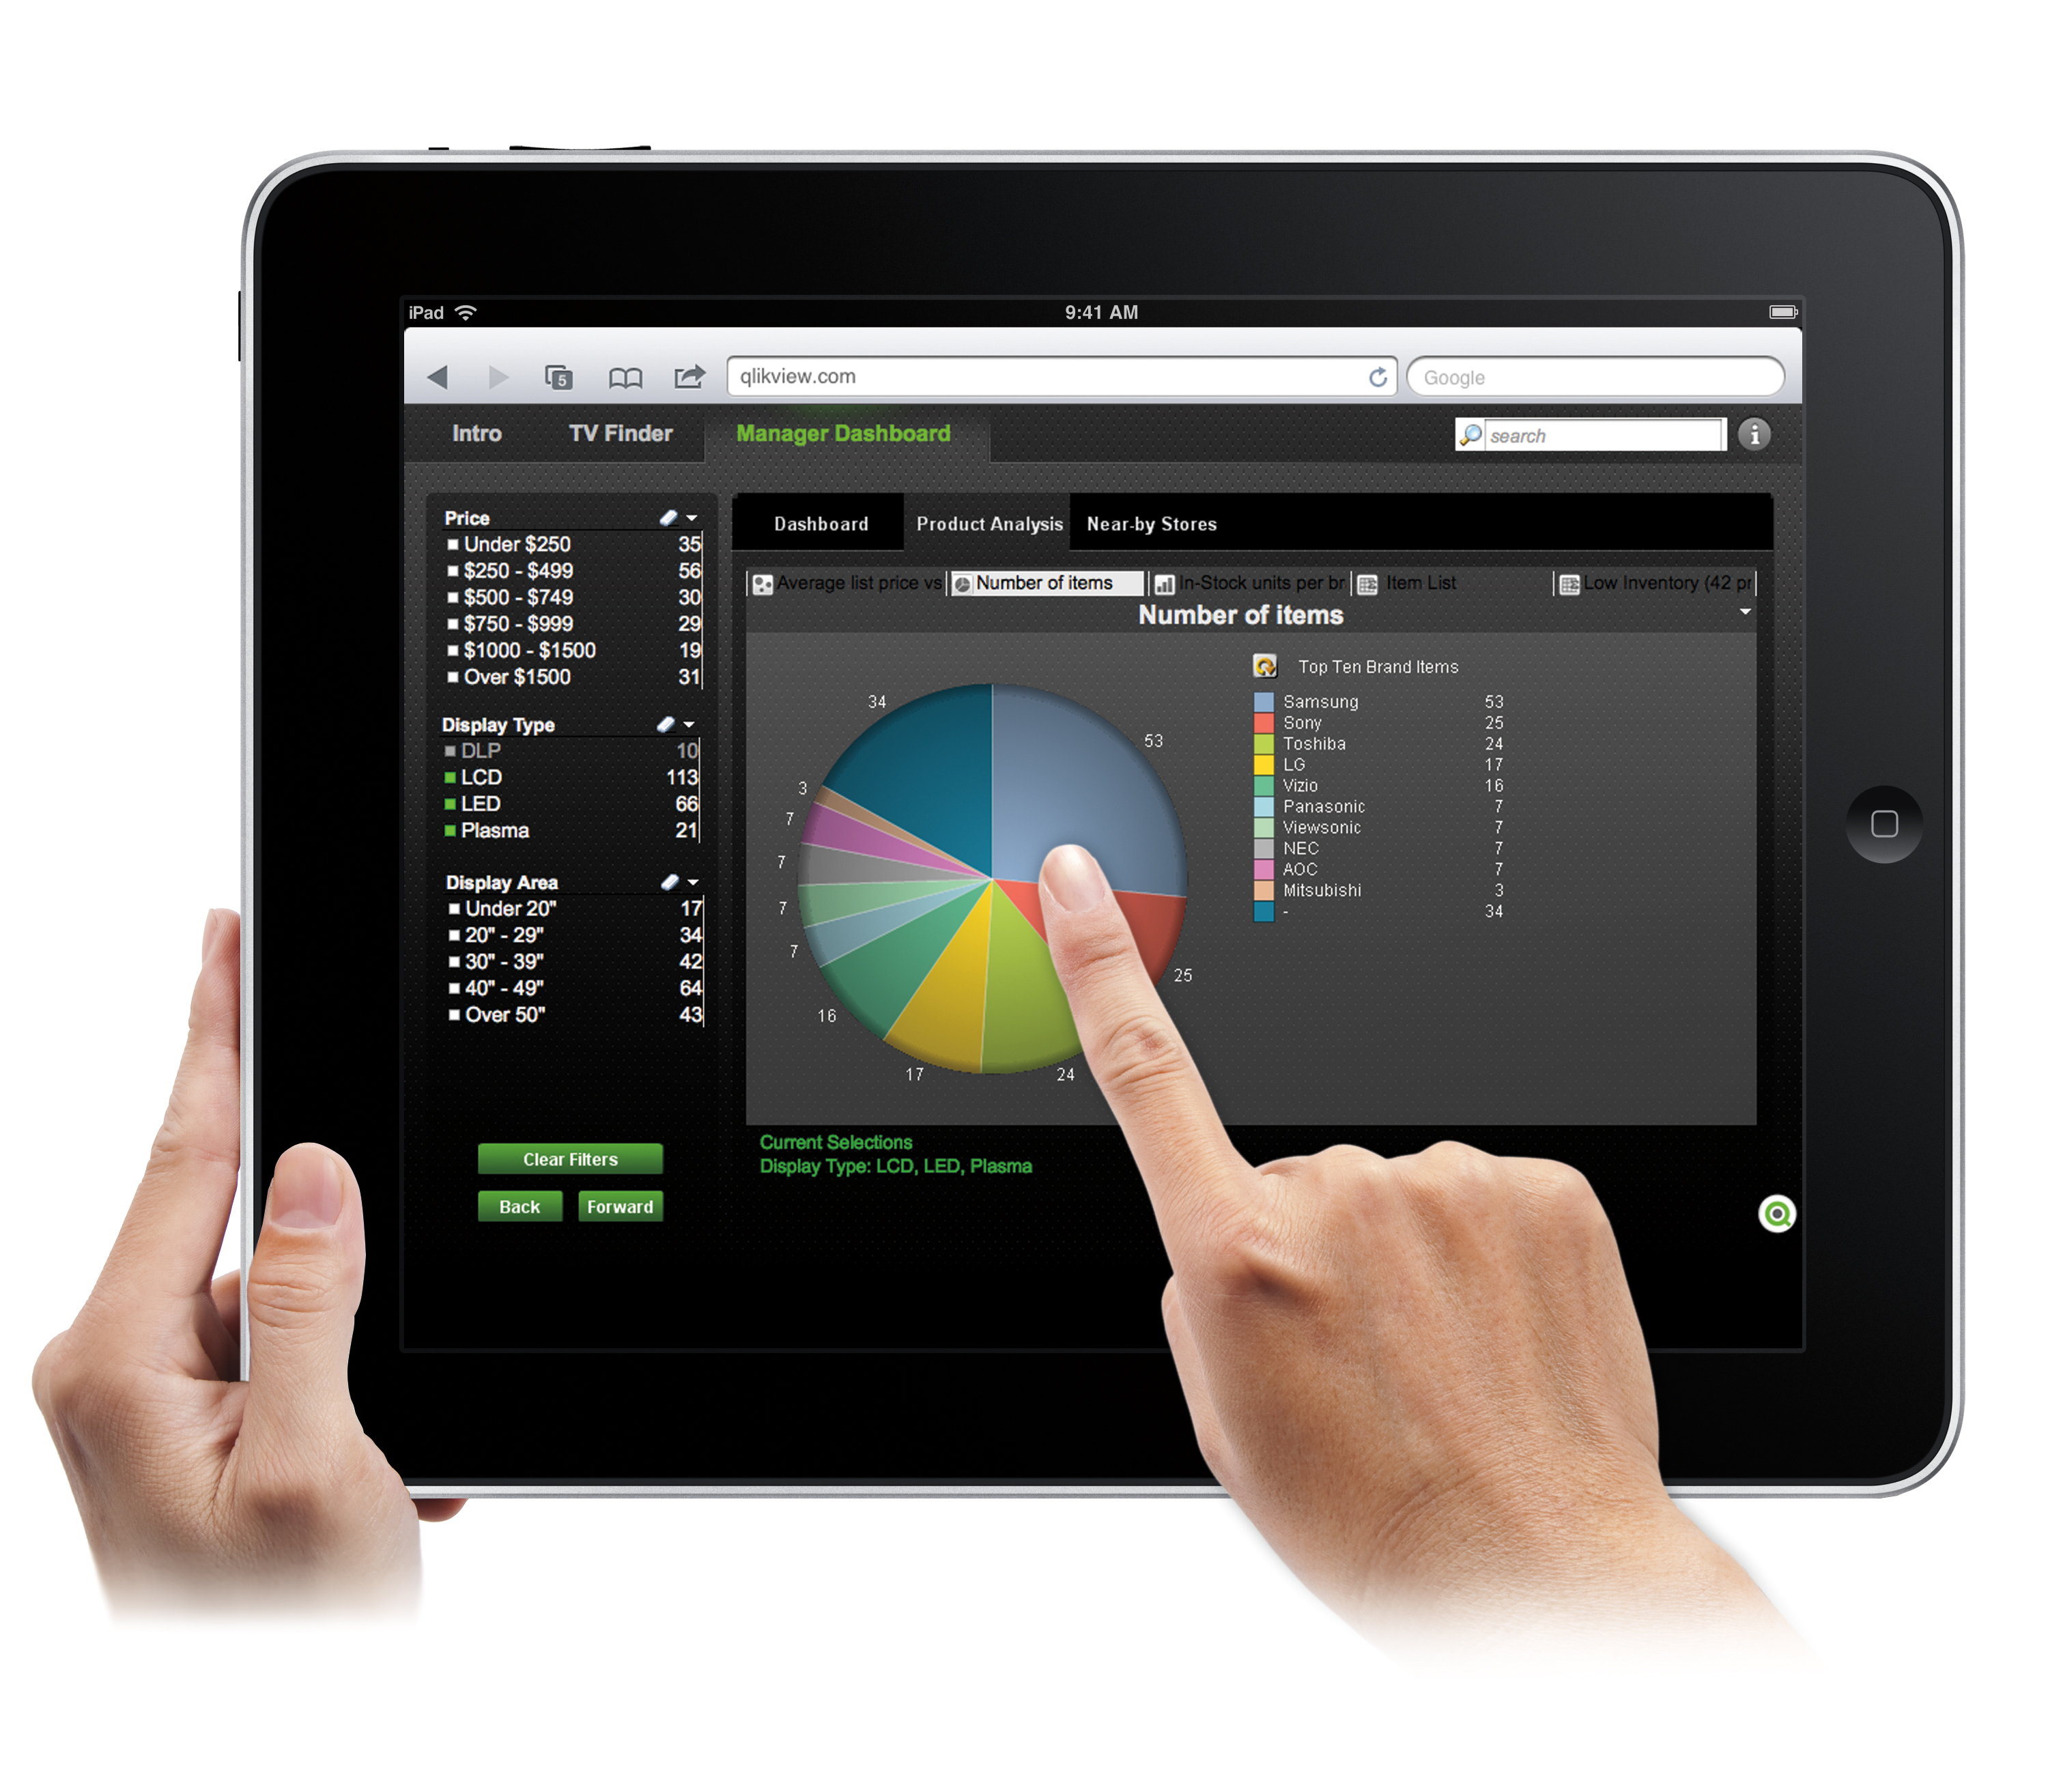
QlikView® is Qlik®’s original BI offering designed primarily for shared business intelligence reports and data visualizations. It offers guided exploration and discovery, collaborative analytics for sharing insight, and agile development and deployment.
N/A
Tableau Desktop
Score8.6 out of 10
N/A
Tableau Desktop is a data visualization product from Tableau. It connects to a variety of data sources for combining disparate data sources without coding. It provides tools for discovering patterns and insights, data calculations, forecasts, and statistical summaries and visual storytelling.
$1,380
per year (purchased via a Creator license)
Pricing
QlikView
Tableau Desktop
Editions & Modules
QlikView
Custom
per user
Tableau Creator License
$115
per month (billed annually) per user
Offerings
Pricing Offerings
QlikView
Tableau Desktop
Free Trial
Yes
No
Free/Freemium Version
No
Yes
Premium Consulting/Integration Services
Yes
Yes
Entry-level Setup Fee
Optional
No setup fee
Additional Details
On an perpetual license basis, based on server plus number of users.
Contact vendor for pricing.
All pricing plans are billed annually. A Creator license includes Tableau Desktop, Tableau Prep Builder, and Tableau Pulse. Discounts sometimes available for volume.
Marketing in Marketing at Morningstar Corporation (Electrical & Electronic Manufacturing, 51-200 employees)
Chose QlikView
QlikView, Tableau, and Sisense are all very good BI tools for analysis and reporting. Tableau was better at intuitively matching fields of disparate data and more visually appealing, but I think QlikView is faster. Tableau was also easier for someone to use to build and …
A de minimis incentive was given to thank the reviewer for their time. The incentive was not used to bias or drive a particular response, nor was the incentive contingent on a positive endorsement. More Info
Verified User
Chose QlikView
I think it all comes down to personal preference and integration compatibility with the existing systems in the organization. However, I would argue that Qlik and PowerBI are the top-tier available solutions due to robust features and capabilities, and I would put solutions …
A de minimis incentive was given to thank the reviewer for their time. The incentive was not used to bias or drive a particular response, nor was the incentive contingent on a positive endorsement. More Info
Verified User
Chose QlikView
QlikView is very similar to Tableau. However, I believe it is a cheaper solution, and that is why our company has chosen QlikView. It has been able to handle large, large amounts of data sets, and has been pretty agile for our business needs.
A de minimis incentive was given to thank the reviewer for their time. The incentive was not used to bias or drive a particular response, nor was the incentive contingent on a positive endorsement. More Info
Planificador Territorial II in Research & Development at MPPP (Environmental Services, 501-1000 employees)
Chose QlikView
The first thing we liked about QlikView was the price. For a small amount per user, I can have a very useful software to manage the whole data set our company uses. The Tableau Desktop has very high pricing for the software, and for just one user, not the whole organization. …
A de minimis incentive was given to thank the reviewer for their time. The incentive was not used to bias or drive a particular response, nor was the incentive contingent on a positive endorsement. More Info
A de minimis incentive was given to thank the reviewer for their time. The incentive was not used to bias or drive a particular response, nor was the incentive contingent on a positive endorsement. More Info
Director of Development - Data Services at Millikin University (Higher Education, 201-500 employees)
Chose QlikView
Tableau and Qlik Sense are a lot prettier and easier to use than QlikView. They also cost a LOT more. If you've got the budget, I'd consider going with one of those solutions. However, departments that don't have the budget to support tools like those need usable solutions as …
A de minimis incentive was given to thank the reviewer for their time. The incentive was not used to bias or drive a particular response, nor was the incentive contingent on a positive endorsement. More Info
Verified User
Chose QlikView
QlikView has a great capability of handling complicated, heterogeneous and raw data and convert them into consumable form by performing basic ETL operations in comparison to Tableau and Power BI.
A de minimis incentive was given to thank the reviewer for their time. The incentive was not used to bias or drive a particular response, nor was the incentive contingent on a positive endorsement. More Info
Verified User
Chose QlikView
Power BI is cheaper, but more basic. Tableau is more expensive, but with greater capabilities. I feel like the other two are a little more intuitive. My company had Qlikview when I arrived.
A de minimis incentive was given to thank the reviewer for their time. The incentive was not used to bias or drive a particular response, nor was the incentive contingent on a positive endorsement. More Info
Verified User
Chose QlikView
Simpler than Tableau and offers some more features for free. While Tableau offers more data connection options, QlikView has satisfied my needs pretty well.
A de minimis incentive was given to thank the reviewer for their time. The incentive was not used to bias or drive a particular response, nor was the incentive contingent on a positive endorsement. More Info
A de minimis incentive was given to thank the reviewer for their time. The incentive was not used to bias or drive a particular response, nor was the incentive contingent on a positive endorsement. More Info
Verified User
Chose QlikView
Its strength lies in the data connectivity, data extraction and data exploration. But it is no way near to the user experience that Tableau provides.
A de minimis incentive was given to thank the reviewer for their time. The incentive was not used to bias or drive a particular response, nor was the incentive contingent on a positive endorsement. More Info
IT Division Manager in Information Technology at Melbourne IT Solutions (Information Technology and Services, 11-50 employees)
Chose QlikView
I have used Microsoft BI, Tableau Desktop and currently playing with SAP BO. Don't get me wrong, QlikView has its place in the SME space but still needs work done on the user interface, licensing and ability to handle macros.
A de minimis incentive was given to thank the reviewer for their time. The incentive was not used to bias or drive a particular response, nor was the incentive contingent on a positive endorsement. More Info
Verified User
Chose QlikView
The only other vendor product that I have worked with that provides a similar experience to Qlikview is Tableau. I would recommend Tableau if your use case is to build a fixed dashboard. You can share reports for free without needing to buy additional licenses. I would …
A de minimis incentive was given to thank the reviewer for their time. The incentive was not used to bias or drive a particular response, nor was the incentive contingent on a positive endorsement. More Info
A de minimis incentive was given to thank the reviewer for their time. The incentive was not used to bias or drive a particular response, nor was the incentive contingent on a positive endorsement. More Info
Director of Business Analytics in Professional Services at ArchipelagoIS (Information Technology and Services, 11-50 employees)
Chose QlikView
Tableau was the closest I came to a competing product but their limited on the ETL side and the associative experience. I like Tableau but for a simpler purpose. QlikSense will be strong competitor with Tableau but they are both good products.
A de minimis incentive was given to thank the reviewer for their time. The incentive was not used to bias or drive a particular response, nor was the incentive contingent on a positive endorsement. More Info
Management Analyst in Information Technology at NETE (Information Technology and Services, 51-200 employees)
Chose QlikView
We like Tableau over QlikView. QlikView has depth, but we do not necessarily have the time or man power to become full fledged experts in QlikView. Tableau is far quicker to pick up and generates reports that are neat and clean as well. Just check their stock symbols QLIK vs …
Verified User
Chose QlikView
MS Power BI and other BI tools have similar functions to QlikView and some of them also have much cheaper price. However, the strength of QlikView is that it is much easier to use and to learn. If you need to train a new person to learn the tool, it costs around 1-2 days.
A de minimis incentive was given to thank the reviewer for their time. The incentive was not used to bias or drive a particular response, nor was the incentive contingent on a positive endorsement. More Info
Verified User
Chose QlikView
QlikView has its own data warehouse, which is the most important reason why would I choose QlikView over any other tools. Apart from that, the feature options are good for the ones who know the tool well but created a steeper learning curve in the beginning. Once you went …
A de minimis incentive was given to thank the reviewer for their time. The incentive was not used to bias or drive a particular response, nor was the incentive contingent on a positive endorsement. More Info
Strategic Technical Director in Engineering at Trace3 (Information Technology & Services, 501-1000 employees)
Chose QlikView
Qlik was less intuitive than Paxata, but less expensive than either microstrategy or PowerBI. Qlik has enough breadth to accommodate most use cases without breaking the bank.
A de minimis incentive was given to thank the reviewer for their time. The incentive was not used to bias or drive a particular response, nor was the incentive contingent on a positive endorsement. More Info
Verified User
Chose QlikView
It is inexpensive and cost prohibited software. Has alot of canned reports that you would need and doesn't request much development work. Widely adopted as an industry leader and works well with many of the top data source applications. Very easy to use and intuitive in the …
A de minimis incentive was given to thank the reviewer for their time. The incentive was not used to bias or drive a particular response, nor was the incentive contingent on a positive endorsement. More Info
A de minimis incentive was given to thank the reviewer for their time. The incentive was not used to bias or drive a particular response, nor was the incentive contingent on a positive endorsement. More Info
Data Quality Management Software Development Manager at Yapı Kredi (Information Technology and Services, 10,001+ employees)
Chose QlikView
QlikView was already chosen and implemented before I started [to work here], but it is very easy to learn (for me) and I started to solve problems within a day or two.
A de minimis incentive was given to thank the reviewer for their time. The incentive was not used to bias or drive a particular response, nor was the incentive contingent on a positive endorsement. More Info
A de minimis incentive was given to thank the reviewer for their time. The incentive was not used to bias or drive a particular response, nor was the incentive contingent on a positive endorsement. More Info
President at Natural Synergies, Inc. (Information Technology and Services, 1-10 employees)
Chose QlikView
I worked and played with several BI tools in my careers. Some were easier to learn than others. With QlikView, I instantly fell in love, and I'm still in love after 12 years of using the product. The most common feedback that I get from my users is: "This is the best thing I've …
A de minimis incentive was given to thank the reviewer for their time. The incentive was not used to bias or drive a particular response, nor was the incentive contingent on a positive endorsement. More Info
Senior Business Analyst in Product Management at Schibsted Marketplaces (Consumer Services, 501-1000 employees)
Chose Tableau Desktop
Tableau is more flexible than these - I liked QlikView old version a lot but have not used the Qlik Sense etc new ones. Tableau user logic is harder to understand than Looker Studio. However it's more trust worthy. Connecting internet sources to Tableau Desktop is much harder. …
A de minimis incentive was given to thank the reviewer for their time. The incentive was not used to bias or drive a particular response, nor was the incentive contingent on a positive endorsement. More Info
Verified User
Chose Tableau Desktop
I have had the good fortune to use a lot of BI tools such as QlikView and Power BI but Tableau according to me provides the bang for the buck. Having said that, the other tools are continually improving and the market would be crowded with a lot of tools providing matching …
A de minimis incentive was given to thank the reviewer for their time. The incentive was not used to bias or drive a particular response, nor was the incentive contingent on a positive endorsement. More Info
Verified User
Chose Tableau Desktop
Tableau Desktop has many more features than other competitors. Comparing Birst, the layout is much more efficient. Power BI and QlikView are as easy as Tableau Desktop. The price for Tableau is a disadvantage when compared to Birst and QlikView, but not against Power BI. …
A de minimis incentive was given to thank the reviewer for their time. The incentive was not used to bias or drive a particular response, nor was the incentive contingent on a positive endorsement. More Info
Verified User
Chose Tableau Desktop
It offers superior capabilities of visualizing information. Tableau's ability to convert unstructured statistical information into fully functional, interactive and appealing dashboards is pretty amazing. QlikView and Power BI do not offer that level of dashboarding capability. …
A de minimis incentive was given to thank the reviewer for their time. The incentive was not used to bias or drive a particular response, nor was the incentive contingent on a positive endorsement. More Info
BI Developer in Information Technology at Cognizant (Information Technology and Services, 10,001+ employees)
Chose Tableau Desktop
1. As compared to SAP Business Objects, Tableau is very easy to use and quick in terms of implementation. Although SAP BO is reporting tool but both tool servers different purposes. SAP BO is a huge enterprises tool used mainly for creating large tabular reports while Tableau …
A de minimis incentive was given to thank the reviewer for their time. The incentive was not used to bias or drive a particular response, nor was the incentive contingent on a positive endorsement. More Info
Research Assistant in Research & Development at UTD (Higher Education, 1-10 employees)
Chose Tableau Desktop
If any changes had to be made to existing visualizations when we used QlikView, a lot of security constraints existed and I had to run to the IT team for every change I had to implement.
Tableau gives easy security change rights to the developer environment.
A de minimis incentive was given to thank the reviewer for their time. The incentive was not used to bias or drive a particular response, nor was the incentive contingent on a positive endorsement. More Info
Technical Leader for Modeling and Simulation in Research & Development at MITRE (Management Consulting, 5001-10,000 employees)
Chose Tableau Desktop
Excel is almost as good as Tableau. If you have a few thousand floating around just spring for the Tableau. QlikView is an abomination. Not much else to say there. SAS and friends are like ye olde-timey versions of Tableau in terms of their visualization abilities. Python, R, …
A de minimis incentive was given to thank the reviewer for their time. The incentive was not used to bias or drive a particular response, nor was the incentive contingent on a positive endorsement. More Info
Sr. Financial Analyst (Finance Manager) in Finance and Accounting at Spring Mobile (Wireless, 1001-5000 employees)
Chose Tableau Desktop
QlikView is more customizable and has more depth, but is much harder to learn and much slower to develop. Tableau Desktop is much quicker to put together and if you have questions the community of support is much better. It doesn't handle as much data as QlikView does.
A de minimis incentive was given to thank the reviewer for their time. The incentive was not used to bias or drive a particular response, nor was the incentive contingent on a positive endorsement. More Info
Product Development at Cass Information Systems (Financial Services, 1001-5000 employees)
Chose Tableau Desktop
Cass evaluated Domo, QlikView and Birst prior to selecting Tableau. It came down to cost (and by a significant margin); the others have relatively high implementation, hosting and other costs. Additionally, based on a recent Gartner "Magic Quadrant", Tableau exceeds all others …
A de minimis incentive was given to thank the reviewer for their time. The incentive was not used to bias or drive a particular response, nor was the incentive contingent on a positive endorsement. More Info
Verified User
Chose Tableau Desktop
It's easy to use and has a great selection of color palettes and templates.
A de minimis incentive was given to thank the reviewer for their time. The incentive was not used to bias or drive a particular response, nor was the incentive contingent on a positive endorsement. More Info
Project Manager Scrum Master in Product Management at Optum Global Solution (Information Technology & Services, 10,001+ employees)
Chose Tableau Desktop
Because of the product's capability, user interaction, and available free online training, Tableau Desktop has become leader in the data visualization segment. The reason we selected Tableau Desktop is our large data sets and need for a tool that is flexible enough to suit this …
A de minimis incentive was given to thank the reviewer for their time. The incentive was not used to bias or drive a particular response, nor was the incentive contingent on a positive endorsement. More Info
Consultant in Information Technology at WNS Global Services (Outsourcing/Offshoring, 10,001+ employees)
Chose Tableau Desktop
It is very easy to use, we can create numbers of charts through it which I think other tools lack in. Lots of online communities are there which have provided solutions to the basic issues. Its ODS(output delivery system) is also very effective. We can use SQL in it for …
A de minimis incentive was given to thank the reviewer for their time. The incentive was not used to bias or drive a particular response, nor was the incentive contingent on a positive endorsement. More Info
A de minimis incentive was given to thank the reviewer for their time. The incentive was not used to bias or drive a particular response, nor was the incentive contingent on a positive endorsement. More Info
A de minimis incentive was given to thank the reviewer for their time. The incentive was not used to bias or drive a particular response, nor was the incentive contingent on a positive endorsement. More Info
A de minimis incentive was given to thank the reviewer for their time. The incentive was not used to bias or drive a particular response, nor was the incentive contingent on a positive endorsement. More Info
A de minimis incentive was given to thank the reviewer for their time. The incentive was not used to bias or drive a particular response, nor was the incentive contingent on a positive endorsement. More Info
Software Engineer in Information Technology at GGK Tech (Telecommunications, 501-1000 employees)
Chose Tableau Desktop
In tableau you can achieve things really quickly and it has the power to show you insight data very easily. Tableau is also economical in comparison to what these tools cost. It's a full value tool.
A de minimis incentive was given to thank the reviewer for their time. The incentive was not used to bias or drive a particular response, nor was the incentive contingent on a positive endorsement. More Info
Verified User
Chose Tableau Desktop
It is easier to start with Tableau. The out of the box ready feel is more with Tableau than any of the other BI products. Product scalability is at a steep cost with Tableau but it gives the possibility to begin small and then grow as it proves its capability as compared to all …
A de minimis incentive was given to thank the reviewer for their time. The incentive was not used to bias or drive a particular response, nor was the incentive contingent on a positive endorsement. More Info
Verified User
Chose Tableau Desktop
Tableau is so much better for data visualization and analysis than Microsoft Reporting Services, but lacks the other functionalities that are included on Microsoft BI (MBI). That's why we use MBI to extract and consolidate our data and Tableau to create some advanced reports.
A de minimis incentive was given to thank the reviewer for their time. The incentive was not used to bias or drive a particular response, nor was the incentive contingent on a positive endorsement. More Info
A de minimis incentive was given to thank the reviewer for their time. The incentive was not used to bias or drive a particular response, nor was the incentive contingent on a positive endorsement. More Info
Verified User
Chose Tableau Desktop
Tableau Desktop needs no to minimal coding experience. It easily integrates with various data sources. It is very easy to create usable smart reports.
A de minimis incentive was given to thank the reviewer for their time. The incentive was not used to bias or drive a particular response, nor was the incentive contingent on a positive endorsement. More Info
A de minimis incentive was given to thank the reviewer for their time. The incentive was not used to bias or drive a particular response, nor was the incentive contingent on a positive endorsement. More Info
Managing Partner & CEO - Big Data, MDM, Data Quality in Information Technology at Zendeux Business Data Solutions (Information Technology and Services, 1-10 employees)
BI Analyst in Customer Service at Kaiser Foundation Health Plan (Utilities, 10,001+ employees)
Chose Tableau Desktop
I have used SSRS, Crystal Reports, Microsoft Excel, and Business Objects. Tableau offers more functionality than the rest and is pretty intuitive. I think SSRS is the easiest to use. Query speed is excellent with SSRS (at least when you are connected to SQL Server). Microsoft …
Sales data validations have helped manage our justifications in the past, especially with regard to new product development and new business introduction. It has also been helpful in identifying trends with business impact and direction specific to quarter and monthly sales from ERP data as well as decisions to purchase equipment of staffing based on run rates and product demand.
One thing that can get out of hand is data output - if you aren't careful in your query, you may be overloaded with data dumps and drown in the amount of info you have to filter through. This is a user caution, not a comment on the software itself.
A de minimis incentive was given to thank the reviewer for their time. The incentive was not used to bias or drive a particular response, nor was the incentive contingent on a positive endorsement. More Info
The best scenario is definitely to collect data from several sources and create dedicated dashboards for specific recipients. However, I miss the possibility of explaining these reports in more detail. Sometimes, we order a report, and after half a year, we don't remember the meaning of some data (I know it's our fault as an organization, but the tool could force better practices).
A de minimis incentive was given to thank the reviewer for their time. The incentive was not used to bias or drive a particular response, nor was the incentive contingent on a positive endorsement. More Info
A de minimis incentive was given to thank the reviewer for their time. The incentive was not used to bias or drive a particular response, nor was the incentive contingent on a positive endorsement. More Info
An excellent tool for data visualization, it presents information in an appealing visual format—an exceptional platform for storing and analyzing data in any size organization.
Through interactive parameters, it enables real-time interaction with the user and is easy to learn and get support from the community.
A de minimis incentive was given to thank the reviewer for their time. The incentive was not used to bias or drive a particular response, nor was the incentive contingent on a positive endorsement. More Info
We found that QlikView can be a bit slow in supporting some forms of encryption. It is web-based and we needed to upgrade all of our server to not support the older SSL and TLS 1 protocols, only support TLS 1.2 and TLS 1.3. However, QlikView could not run with TLS 1.2 and TLS 1.3. We had to wait over six months to get a version that would handle the newer TLS versions.
There are so many options with QlikView that you can get lost when developing a visualization. There are still items I have not yet figured out, such as labeling a graph with the name of a selected detail item.
QlikView works by pulling the data it is going to use for visualization into its database. I am a security reviewer and I need to make certain that PII and PHI is not pulled by QlikView for a visualization, otherwise this could become a reportable indecent.
A de minimis incentive was given to thank the reviewer for their time. The incentive was not used to bias or drive a particular response, nor was the incentive contingent on a positive endorsement. More Info
Ease of use, ability to load from pretty much any data source. today I created an application that loaded time sheets from excel that are not in a table format. With Qlik's "enable transformation steps" I was able to automate loads of multiple spreadsheets and multiple tabs easily. Could not do that with any other tool.
A de minimis incentive was given to thank the reviewer for their time. The incentive was not used to bias or drive a particular response, nor was the incentive contingent on a positive endorsement. More Info
Our use of Tableau Desktop is still fairly low, and will continue over time. The only real concern is around cost of the licenses, and I have mentioned this to Tableau and fully expect the development of more sensible models for our industry. This will remove any impediment to expansion of our use.
A de minimis incentive was given to thank the reviewer for their time. The incentive was not used to bias or drive a particular response, nor was the incentive contingent on a positive endorsement. More Info
QlikView is very easy to implement. The installation is very straight forward. QlikView has several different data connectors that can connect to different data sources very smoothly. The user interface to build the reports is very easy to understand. This helps to have a smaller learning curve. Something very helpful is that QlikView is a browser application for the end users. So, you don't need to install any applications on the user's computer.
A de minimis incentive was given to thank the reviewer for their time. The incentive was not used to bias or drive a particular response, nor was the incentive contingent on a positive endorsement. More Info
Tableau Desktop has proven to be a lifesaver in many situations. Once we've completed the initial setup, it's simple to use. It has all of the features we need to quickly and efficiently synthesize our data. Tableau Desktop has advanced capabilities to improve our company's data structure and enable self-service for our employees.
When used as a stand-alone tool, Tableau Desktop has unlimited uptime, which is always nice. When used in conjunction with Tableau Server, this tool has as much uptime as your server admins are willing to give it. All in all, I've never had an issue with Tableau's availability.
Tableau Desktop's performance is solid. You can really dig into a large dataset in the form of a spreadsheet, and it exhibits similarly good performance when accessing a moderately sized Oracle database. I noticed that with Tableau Desktop 9.3, the performance using a spreadsheet started to slow around 75K rows by about 60 columns. This was easily remedied by creating an extract and pushing it to Tableau Server, where performance went to lightning fast
A de minimis incentive was given to thank the reviewer for their time. The incentive was not used to bias or drive a particular response, nor was the incentive contingent on a positive endorsement. More Info
My experience with the Qlik support team has been somewhat limited, but every interaction I have had with them has been very professional and I received a response quickly. Typically if there is a technical issue, our IT team will follow up. My inquiries are specific to product functionality, and Qlik has been very helpful in clarifying any questions I might have.
A de minimis incentive was given to thank the reviewer for their time. The incentive was not used to bias or drive a particular response, nor was the incentive contingent on a positive endorsement. More Info
Tableau support has been extremely responsive and willing to help with all of our requests. They have assisted with creating advanced analysis and many different types of custom icons, data formatting, formulas, and actions embedded into graphs. Tableau offers a weekly presentation of features and assists with internal company projects.
A de minimis incentive was given to thank the reviewer for their time. The incentive was not used to bias or drive a particular response, nor was the incentive contingent on a positive endorsement. More Info
My team attended, but I cannot myself rate, but I think it was good as they've successfully launched a training program at our company themselves for users. It was 3-4 day training.
It is admittedly hard to train a group of people with disparate levels of ability coming in, but the software is so easy to use that this is not a huge problem; anyone who can follow simple instructions can catch up pretty quickly.
Training was as expected. The demo environments tend to be more fully featured that our own environment, but the training was clear and well delivered.
I think the training was good overall, but it was maybe stating the obvious things that a tech savvy young engineer would be able to pick up themselves too. However, the example work books were good and Tableau web community has helped me with many problems
A de minimis incentive was given to thank the reviewer for their time. The incentive was not used to bias or drive a particular response, nor was the incentive contingent on a positive endorsement. More Info
"Implementation" can mean a few things... so I'm not sure that this is the answer you want.... but here it goes: To me, implementation means: "Is the user interface intuitive and can I produce meaningful reports with ease?" On that score, I'd say YES. The amount of training required was minimal and the results were powerful. The desktop implementation is a simple, "blank" interface just waiting for your creativity. The pre-populated templates give you a reasonable start to any project -- and a good set of objects to "play around with" if you're just getting started. Finally, note that the "implementation" I used was baked into QuickBooks 2016 Enterprise -- called "Advanced Reporting"..... That integration makes it ultra useful and simple.
A de minimis incentive was given to thank the reviewer for their time. The incentive was not used to bias or drive a particular response, nor was the incentive contingent on a positive endorsement. More Info
Again, training is the key and the company provides a lot of example videos that will help users discover use cases that will greatly assist their creation of original visualizations. As with any new software tool, productivity will decline for a period. In the case of Tableau, the decline period is short and the later gains are well worth it.
A de minimis incentive was given to thank the reviewer for their time. The incentive was not used to bias or drive a particular response, nor was the incentive contingent on a positive endorsement. More Info
The only other vendor product that I have worked with that provides a similar experience to Qlikview is Tableau. I would recommend Tableau if your use case is to build a fixed dashboard. You can share reports for free without needing to buy additional licenses. I would recommend Qlikview if your users are looking for a more interactive experience. They can create new objects to represent the data which can't be accomplished as easily in Tableau
A de minimis incentive was given to thank the reviewer for their time. The incentive was not used to bias or drive a particular response, nor was the incentive contingent on a positive endorsement. More Info
I have used Power BI as well, the pricing is better, and also training costs or certifications are not that high. Since there is python integration in Power BI where I can use data cleaning and visualizing libraries and also some machine learning models. I can import my python scripts and create a visualization on processed data.
A de minimis incentive was given to thank the reviewer for their time. The incentive was not used to bias or drive a particular response, nor was the incentive contingent on a positive endorsement. More Info
Tableau Desktop's scaleability is really limited to the scale of your back-end data systems. If you want to pull down an extract and work quickly in-memory, in my application it scaled to a few tens of millions of rows using the in-memory engine. But it's really only limited by your back-end data store if you have or are willing to invest in an optimized SQL store or purpose-built query engine like Veritca or Netezza or something similar.
You can use the free desktop version to do a lot of reporting and analysis work more quickly so the ROI is huge
QlikView is great at finding outliers such as data entry errors
QlikView is great at helping you quickly discover new insights about your business that can prompt you to take action that can immediately affect your cash flow.
A de minimis incentive was given to thank the reviewer for their time. The incentive was not used to bias or drive a particular response, nor was the incentive contingent on a positive endorsement. More Info
Tableau was acquired years ago, and has provided good value with the content created.
Ongoing maintenance costs for the platform, both to maintain desktop and server licensing has made the continuing value questionable when compared to other offerings in the marketplace.
Users have largely been satisfied with the content, but not with the overall performance. This is due to a combination of factors including the performance of the Tableau engines as well as development deficiencies.
A de minimis incentive was given to thank the reviewer for their time. The incentive was not used to bias or drive a particular response, nor was the incentive contingent on a positive endorsement. More Info