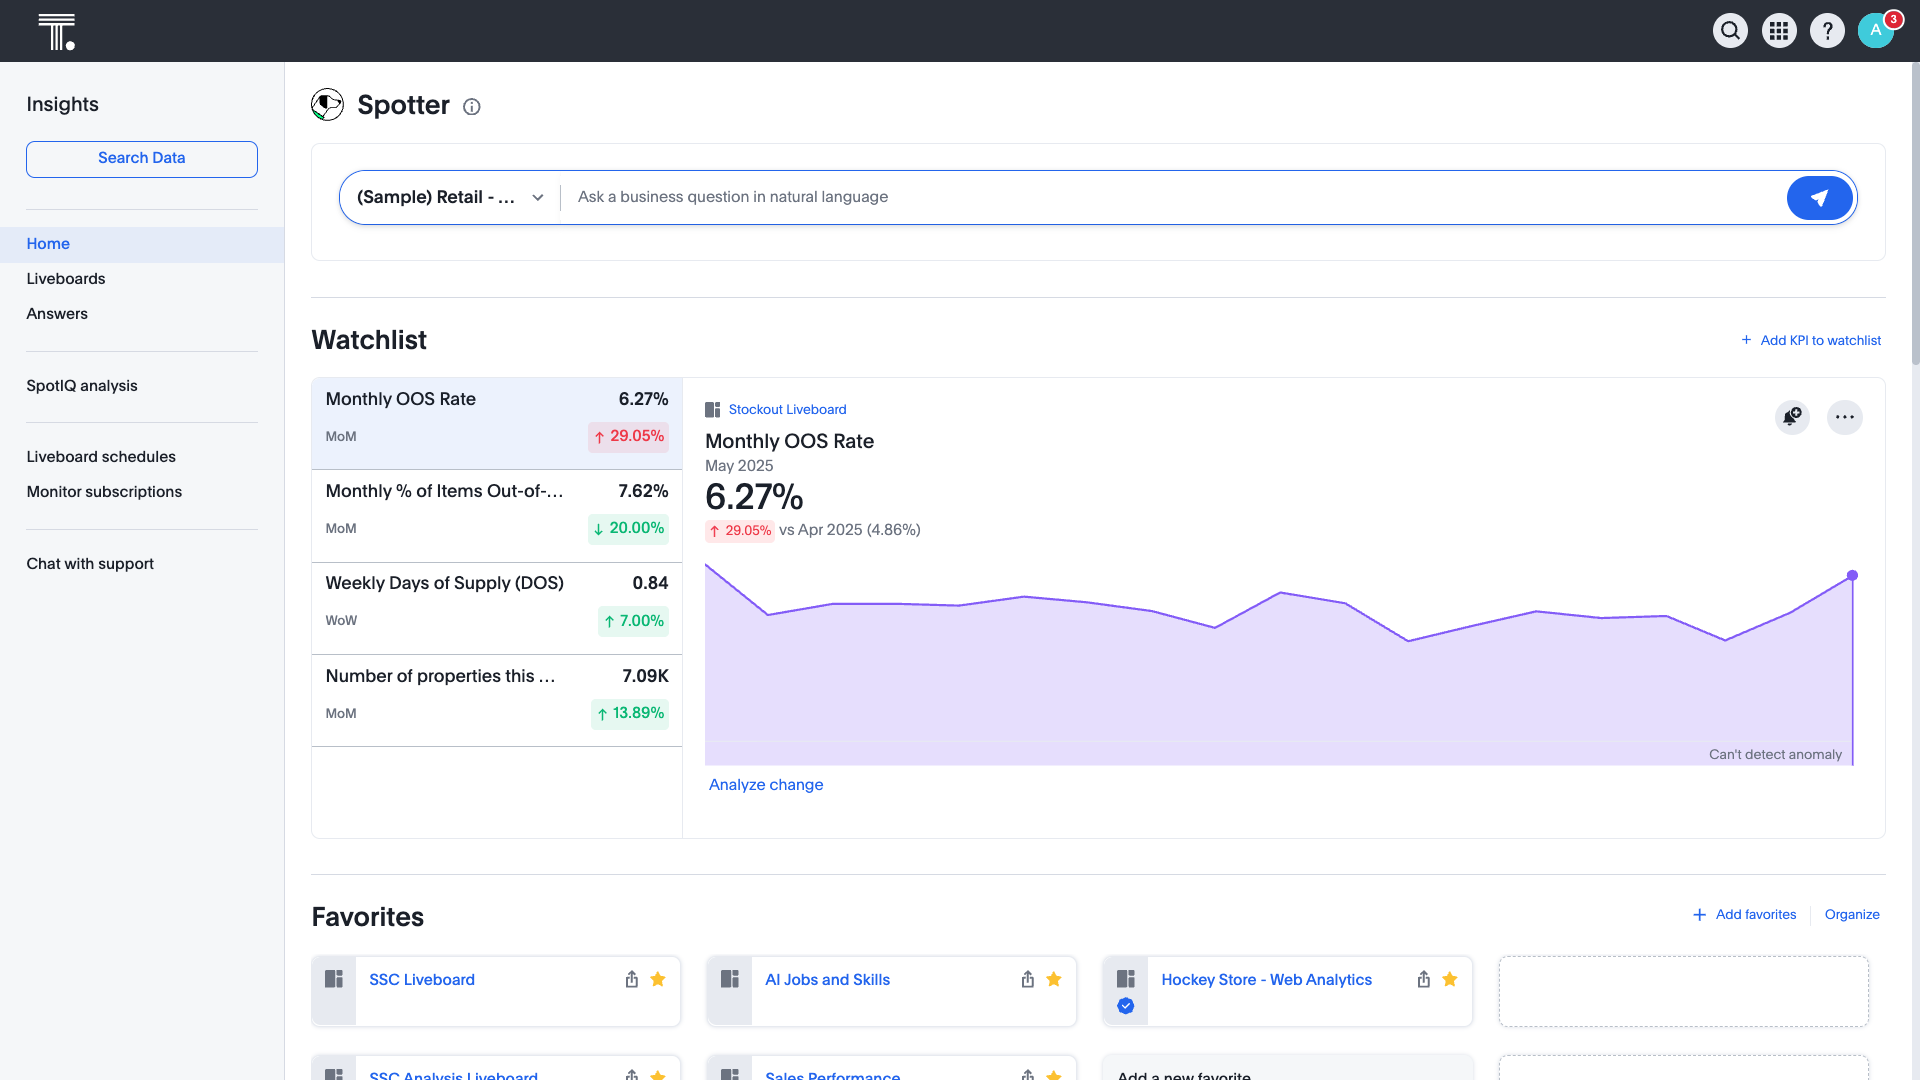
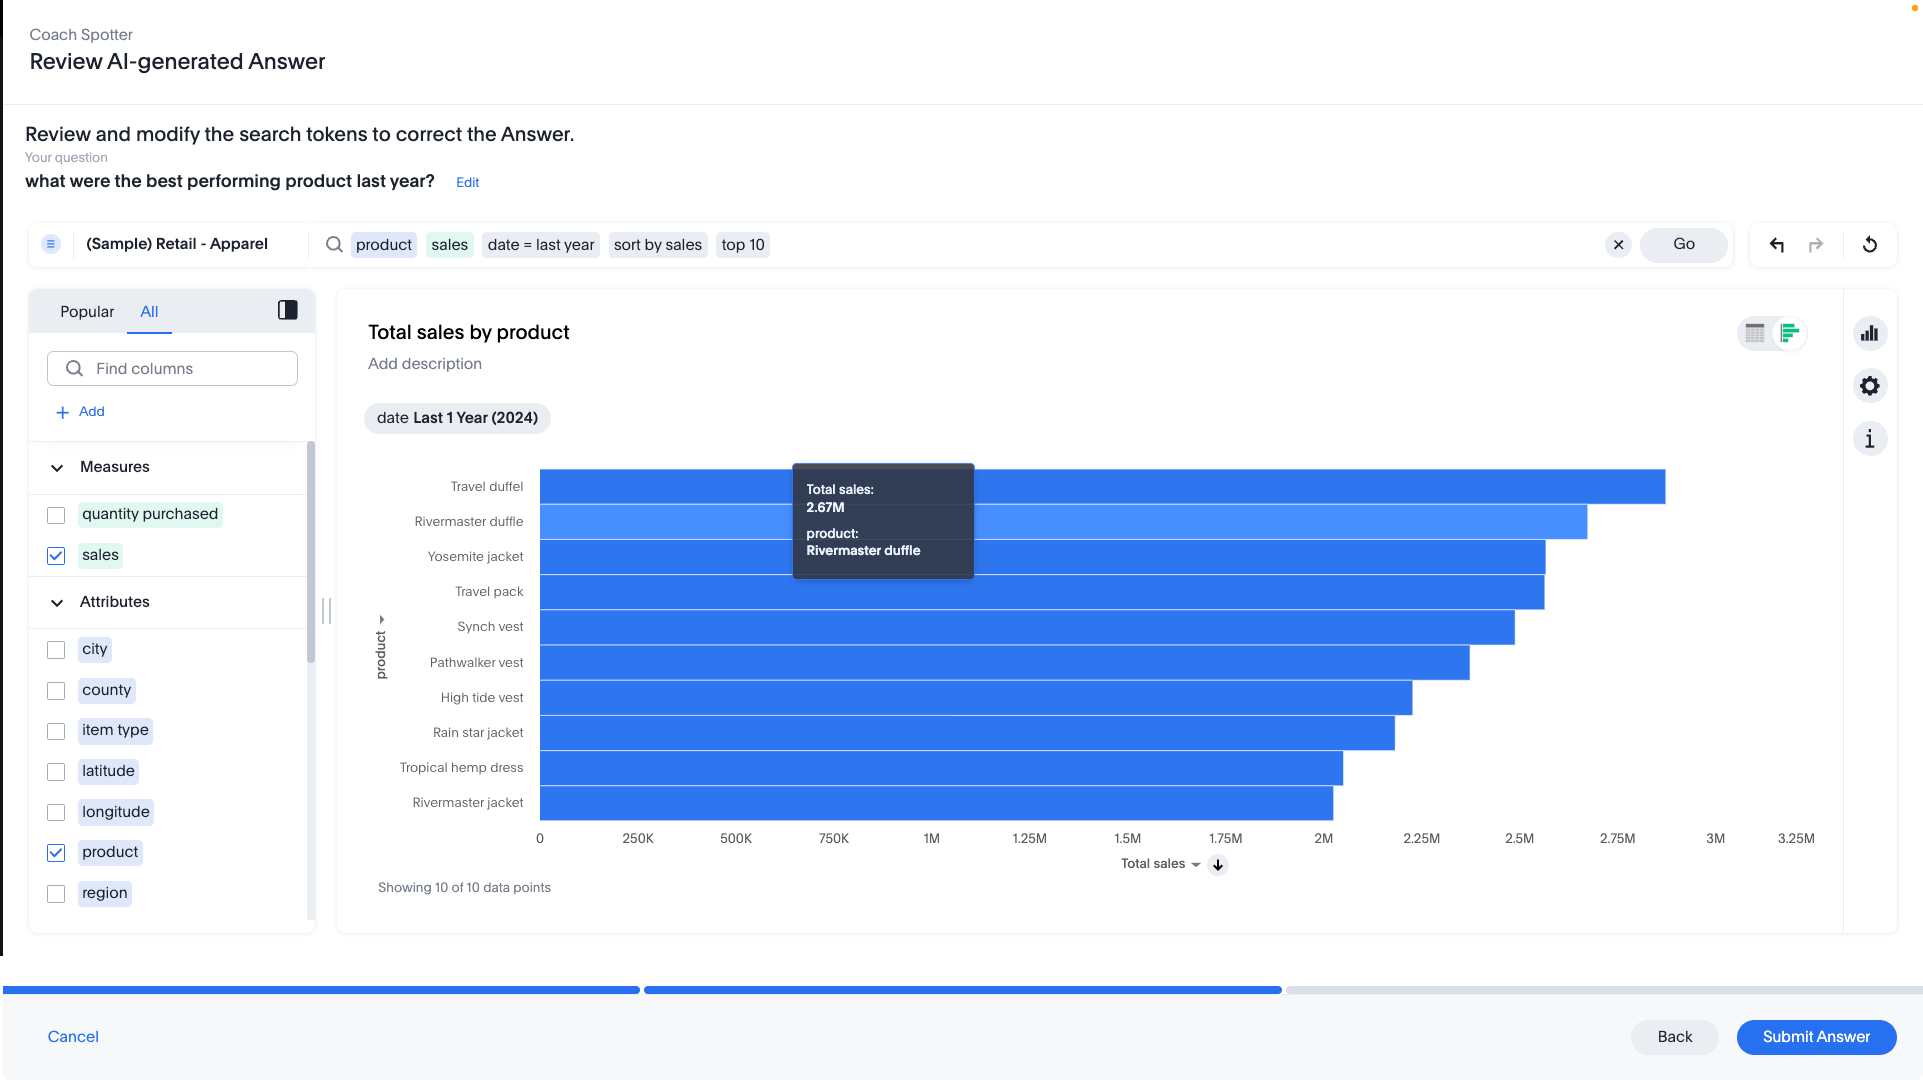
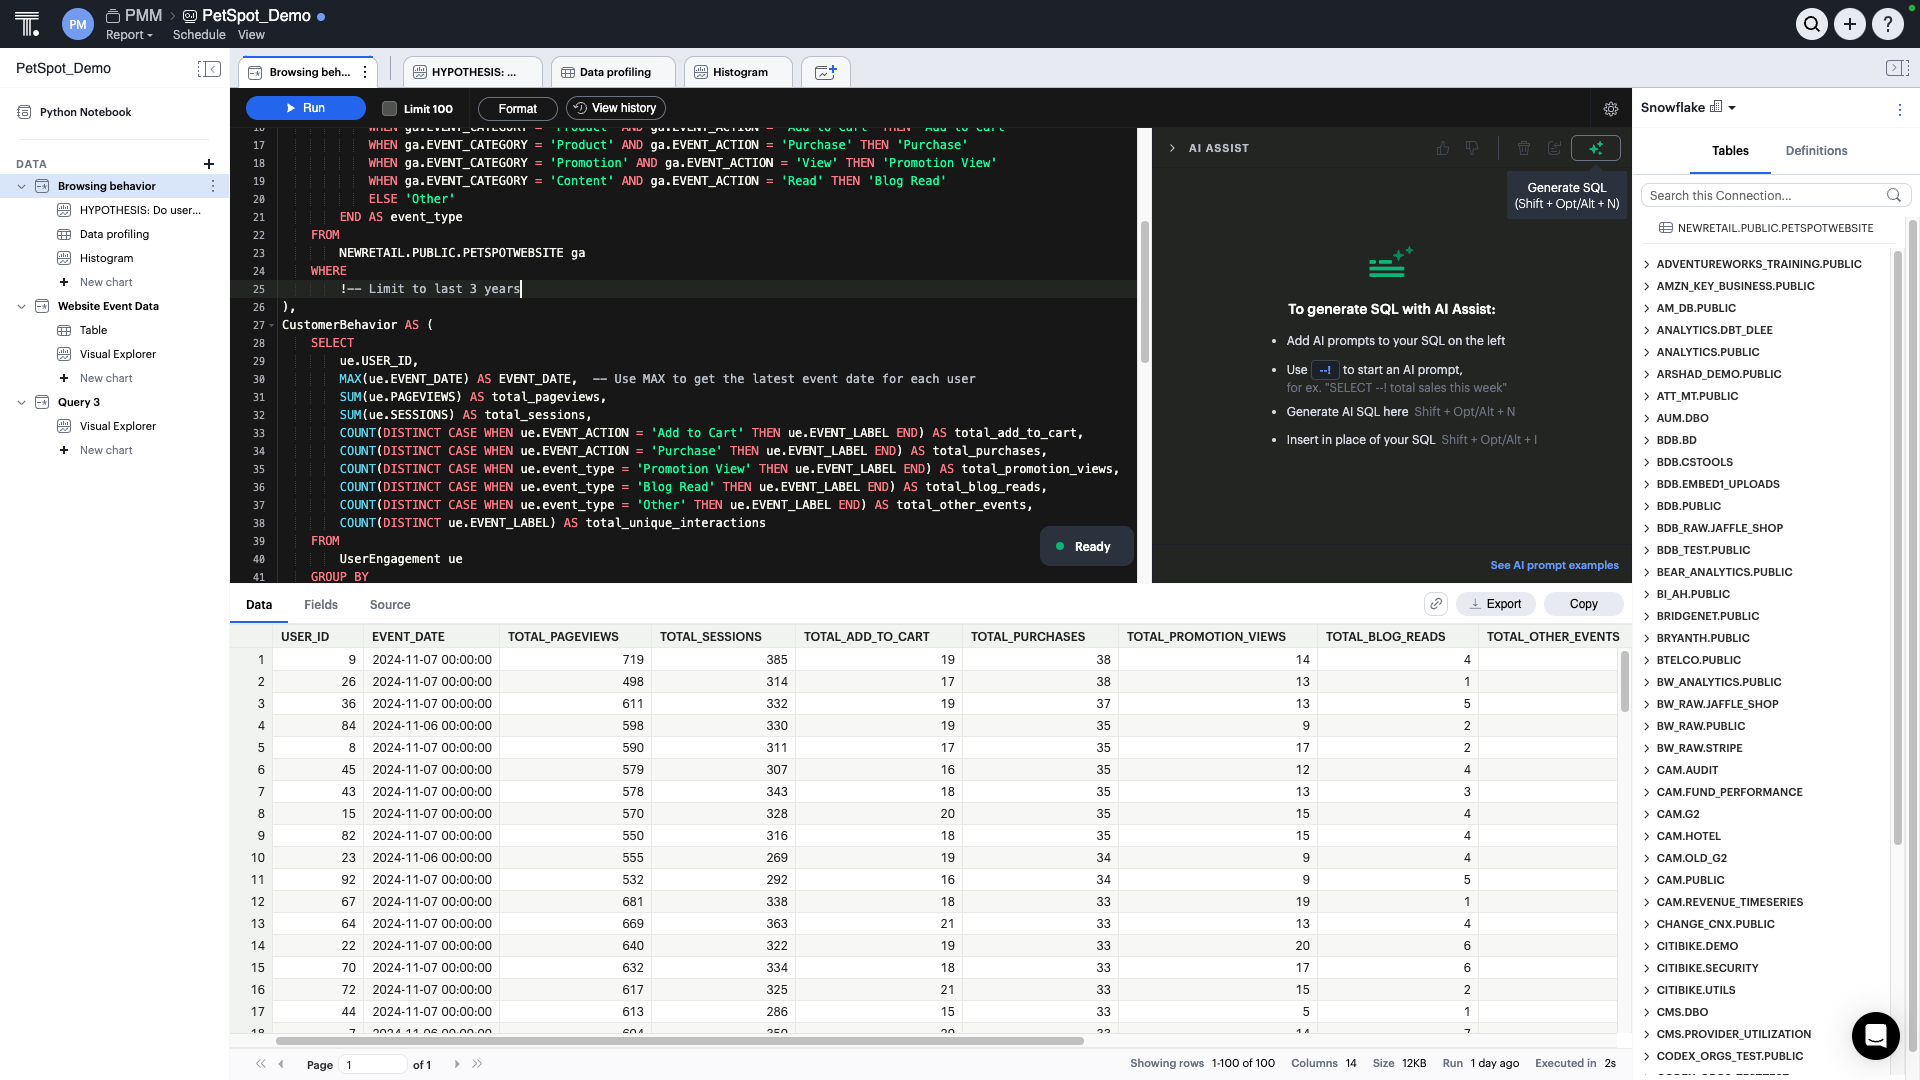
ThoughtSpot is an Agentic Analytics Platform for enterprises where users ask data questions using natural language and get answers with AI. Code-first for data teams and code-free for business users, ThoughtSpot can handle large, complex cloud data at scale.
$1,500
per year (5 users)
Yellowfin
Score8.6 out of 10
Mid-Size Companies (51-1,000 employees)
Yellowfin is a cloud-based business intelligence and dashboarding platform.
$250
per month
Pricing
ThoughtSpot
Yellowfin
Editions & Modules
Thoughtspot Analytics - Pro
$50
per month (billed annually) per user (25-1000 users)
It is well suited when the same data is consumed by many different people with different analytics and visualization requirements because, if you have the data available in ThoughtSpot, every user can prepare different views. Also, it is a good reporting tool, you can get rid of slides if you have a good dashboard prepared, gaining flexibility and agility.
A de minimis incentive was given to thank the reviewer for their time. The incentive was not used to bias or drive a particular response, nor was the incentive contingent on a positive endorsement. TR verified that a representative sample of customers was invited. More Info
We can recommend this software without hesitation, as it has the ability to generate reports and data analysis, as well as process the data automatically, which saves time. It is ideal for small and medium-sized companies that wish to improve their services in the business world
A de minimis incentive was given to thank the reviewer for their time. The incentive was not used to bias or drive a particular response, nor was the incentive contingent on a positive endorsement. More Info
Beautiful visualizations. The visuals are distinct, clean, and easy to discern from one another.
Intelligent querying functionality. When looking to manipulate the data, the search function makes it easy to manipulate the features in the data, along with aggregating them in the way you'd like.
Embedding! It has been a smooth process thus far for our product & technical teams to work with ThoughtSpot and bring it into our product.
A de minimis incentive was given to thank the reviewer for their time. The incentive was not used to bias or drive a particular response, nor was the incentive contingent on a positive endorsement. TR verified that a representative sample of customers was invited. More Info
Yellowfin’s Storyboard, Timeline and Collaborative tools make it easy to share data and insights across an organisation.
Strong Operational and Executive Dashboards that reflect the business KPIs and can send out prompts to people within the business based on rules.
Yellowfin makes it incredibly easy to create dynamic reports and dashboards which incorporate maps through locational intelligence functionality.
Yellowfin is a single license and all access is via a web browser making it perfect for both on-premise and cloud deployment. Mobile apps are also available.
User roles and source filtering allows Admin/IT to offer different functions/views by user group/role.
Mobile BI applications to support any device ..
API connectors ( YF 7.2 on the way in Mar16 ) for a range of third-party Web-based applications, data sources, Enterprises CRM/ERP apps & open data platform apps, including Salesforce, Google Analytics, Twitter, Youtube , Zoho CRM, XE.com & more coming to make endusers to integrate their applications for better benefits
Yellowfin Integration with Predictive analytical and Big Data processing tools like R, UDF, Spark to build rich applications for end users
It would be great if ThoughtSpot can add the feature to filter by clicking on visualizations. i.e if I click on a particular data point in the chart if the full dashboard can filter just for that particular data point.
Color coding the heatmap with different colors like green to orange to red.
A de minimis incentive was given to thank the reviewer for their time. The incentive was not used to bias or drive a particular response, nor was the incentive contingent on a positive endorsement. TR verified that a representative sample of customers was invited. More Info
The ability to predefine a colour for a specific graph as a selection option dynamically.
The ability to customise the label of a chart, especially with respect to performance related reporting graphs we need an increase in dynamic charting options to meet our more specialised requirements.
I give it just waiting because passport is brilliant and it has helped our organisation In advancing to the next stage in the age of AI. It has allowed or non-tech people to better service and clients in a cost-effective way. George port has allowed us to create new products for us and for our clients increasing our revenue streams and reducing clients churn
A de minimis incentive was given to thank the reviewer for their time. The incentive was not used to bias or drive a particular response, nor was the incentive contingent on a positive endorsement. TR verified that a representative sample of customers was invited. More Info
The rating is because of the ease of use of the interface as it has a no code interface that makes it easy to setup data pipelines without extensive programming. Cloud native integration: It integrates seamlessly with cloud based data warehouses. Automated data loading, Scalability, Cost Effective, Transformations, Data Governance and security.
A de minimis incentive was given to thank the reviewer for their time. The incentive was not used to bias or drive a particular response, nor was the incentive contingent on a positive endorsement. TR verified that a representative sample of customers was invited. More Info
As mentioned previously, if a newer company is looking for a strong, polished BI tool, Yellowfin would be a great software vendor to consider. Unfortunately, the high cost might be a barrier to these newer companies who dont have any legacy software/agreements such as an EA agreement with Microsoft.
A de minimis incentive was given to thank the reviewer for their time. The incentive was not used to bias or drive a particular response, nor was the incentive contingent on a positive endorsement. More Info
A de minimis incentive was given to thank the reviewer for their time. The incentive was not used to bias or drive a particular response, nor was the incentive contingent on a positive endorsement. TR verified that a representative sample of customers was invited. More Info
A de minimis incentive was given to thank the reviewer for their time. The incentive was not used to bias or drive a particular response, nor was the incentive contingent on a positive endorsement. TR verified that a representative sample of customers was invited. More Info
I give it this meeting because the team is not only help able to help us in the current solutions but also amazing and taking feedback and feeding it back to their development team which includes more products and features into ThoughtSpot
A de minimis incentive was given to thank the reviewer for their time. The incentive was not used to bias or drive a particular response, nor was the incentive contingent on a positive endorsement. TR verified that a representative sample of customers was invited. More Info
They have good support in what they provide. But what they provide is not what is promised. I would stay with them if I can. Be very careful before signing up with them. They are not what they seem in the sales pitches. Be very careful and make sure you test and test before you sign up.
A de minimis incentive was given to thank the reviewer for their time. The incentive was not used to bias or drive a particular response, nor was the incentive contingent on a positive endorsement. TR verified that a representative sample of customers was invited. More Info
A de minimis incentive was given to thank the reviewer for their time. The incentive was not used to bias or drive a particular response, nor was the incentive contingent on a positive endorsement. TR verified that a representative sample of customers was invited. More Info
A de minimis incentive was given to thank the reviewer for their time. The incentive was not used to bias or drive a particular response, nor was the incentive contingent on a positive endorsement. TR verified that a representative sample of customers was invited. More Info
We also explored Tableau Ask Data. Tableau is our standard for BI in our organization. We want to use the smallest amount of tools in our company to have the best adaption. ThoughSpot will fill a few gaps that we have with our current set up and will also enhance out offering for our employees in the transition of being more data driven within in near future
A de minimis incentive was given to thank the reviewer for their time. The incentive was not used to bias or drive a particular response, nor was the incentive contingent on a positive endorsement. TR verified that a representative sample of customers was invited. More Info
Yellow Fin platform is browser agnostic and is accessible from desktops as well as mobile devices. It is very simple and fast, it is integrated with Big Data, clients do not require a great training. It just works. But it’s easier to have things on the cloud, especially if you need to use different computers. Yellow Fin lacks the cloud feature.
A de minimis incentive was given to thank the reviewer for their time. The incentive was not used to bias or drive a particular response, nor was the incentive contingent on a positive endorsement. More Info
Because it is very reliable, inside the situation, we need strong internet connection to access a lot of data but easily never had any downtime except during the upgrades
A de minimis incentive was given to thank the reviewer for their time. The incentive was not used to bias or drive a particular response, nor was the incentive contingent on a positive endorsement. TR verified that a representative sample of customers was invited. More Info
Time to market ROI is massive vs hiring the full-time dedicated team to build and maintain a frontend multi-tenant SaaS data viz product.
It will be interesting to see over time how the advanced features play out in terms of usability and end value, such as Natural Search, which we are very excited about, and the machine learning tools.
A de minimis incentive was given to thank the reviewer for their time. The incentive was not used to bias or drive a particular response, nor was the incentive contingent on a positive endorsement. TR verified that a representative sample of customers was invited. More Info
A de minimis incentive was given to thank the reviewer for their time. The incentive was not used to bias or drive a particular response, nor was the incentive contingent on a positive endorsement. More Info