TrustRadius: an HG Insights company

LogicMonitor

Score8.9 out of 10

356 Reviews and Ratings

What is LogicMonitor?

LogicMonitor’s SaaS-based platform, LM Envision, enables observability across on-prem and multi-cloud environments. It provides IT and business teams operational visibility and predictability across their technologies and applications.

Read more details.

Media

Screenshot of AIOps features for enterprises using technology or hybrid environments with cloud and container resources. LogicMonitor can be used to monitor and improve the performance of complex enterprise networks with dynamic thresholds, topology mapping, anomaly detection, and root cause analysis.
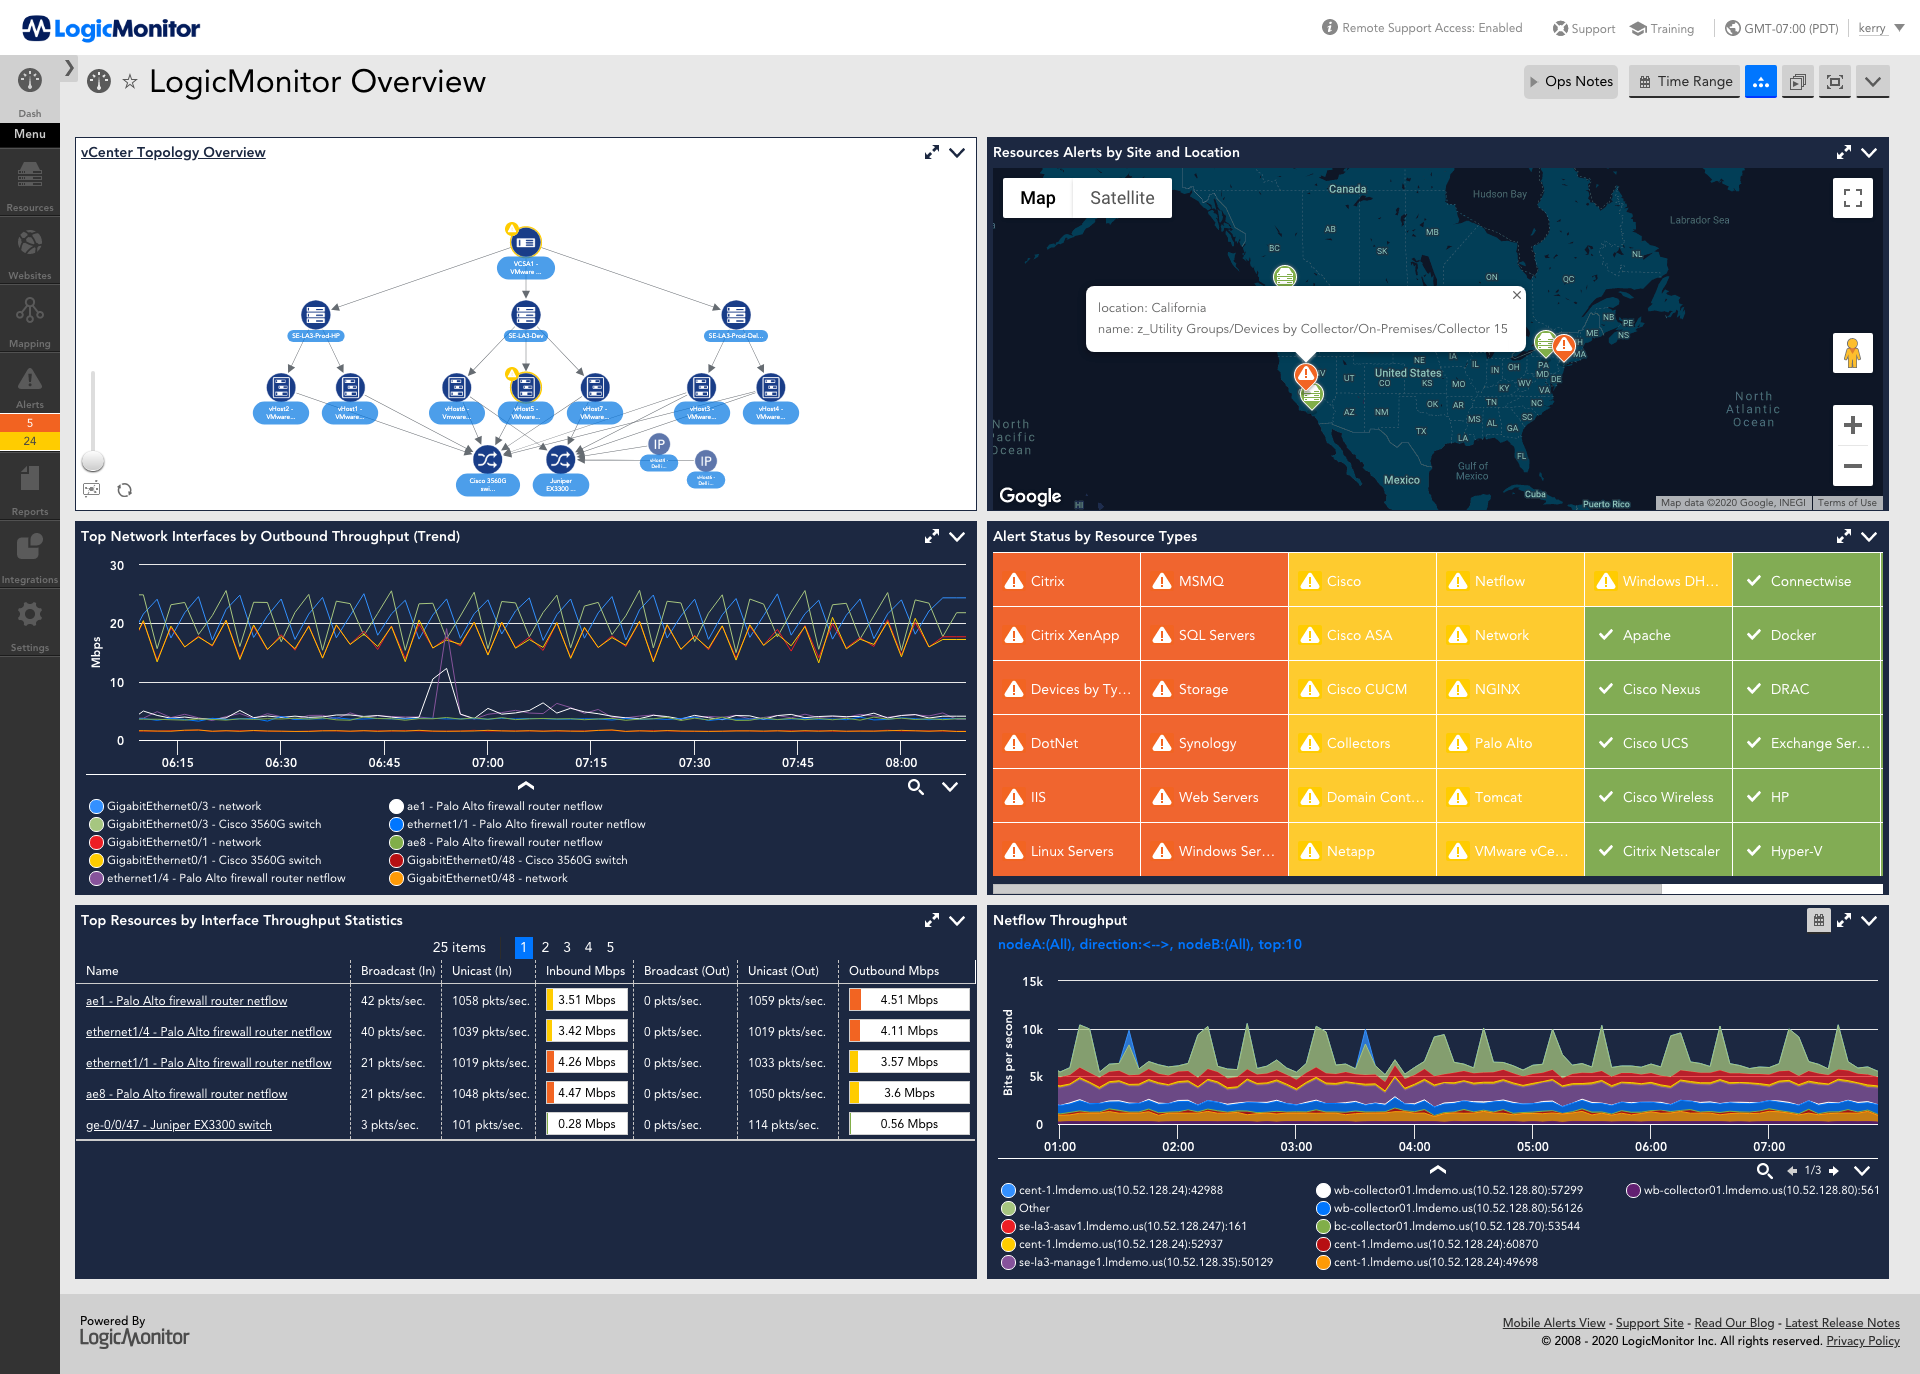
Screenshot of LM Envision's comprehensive monitoring and observability capabilities across the IT infrastructure, that help to identify alerts for the most important systems while ensuring the user experience is uninterrupted across the globe.
Screenshot of Monitoring that ensures servers and the applications running on top of them are highly available. Helps resolve issues and optimize resource consumption for the server infrastructure.
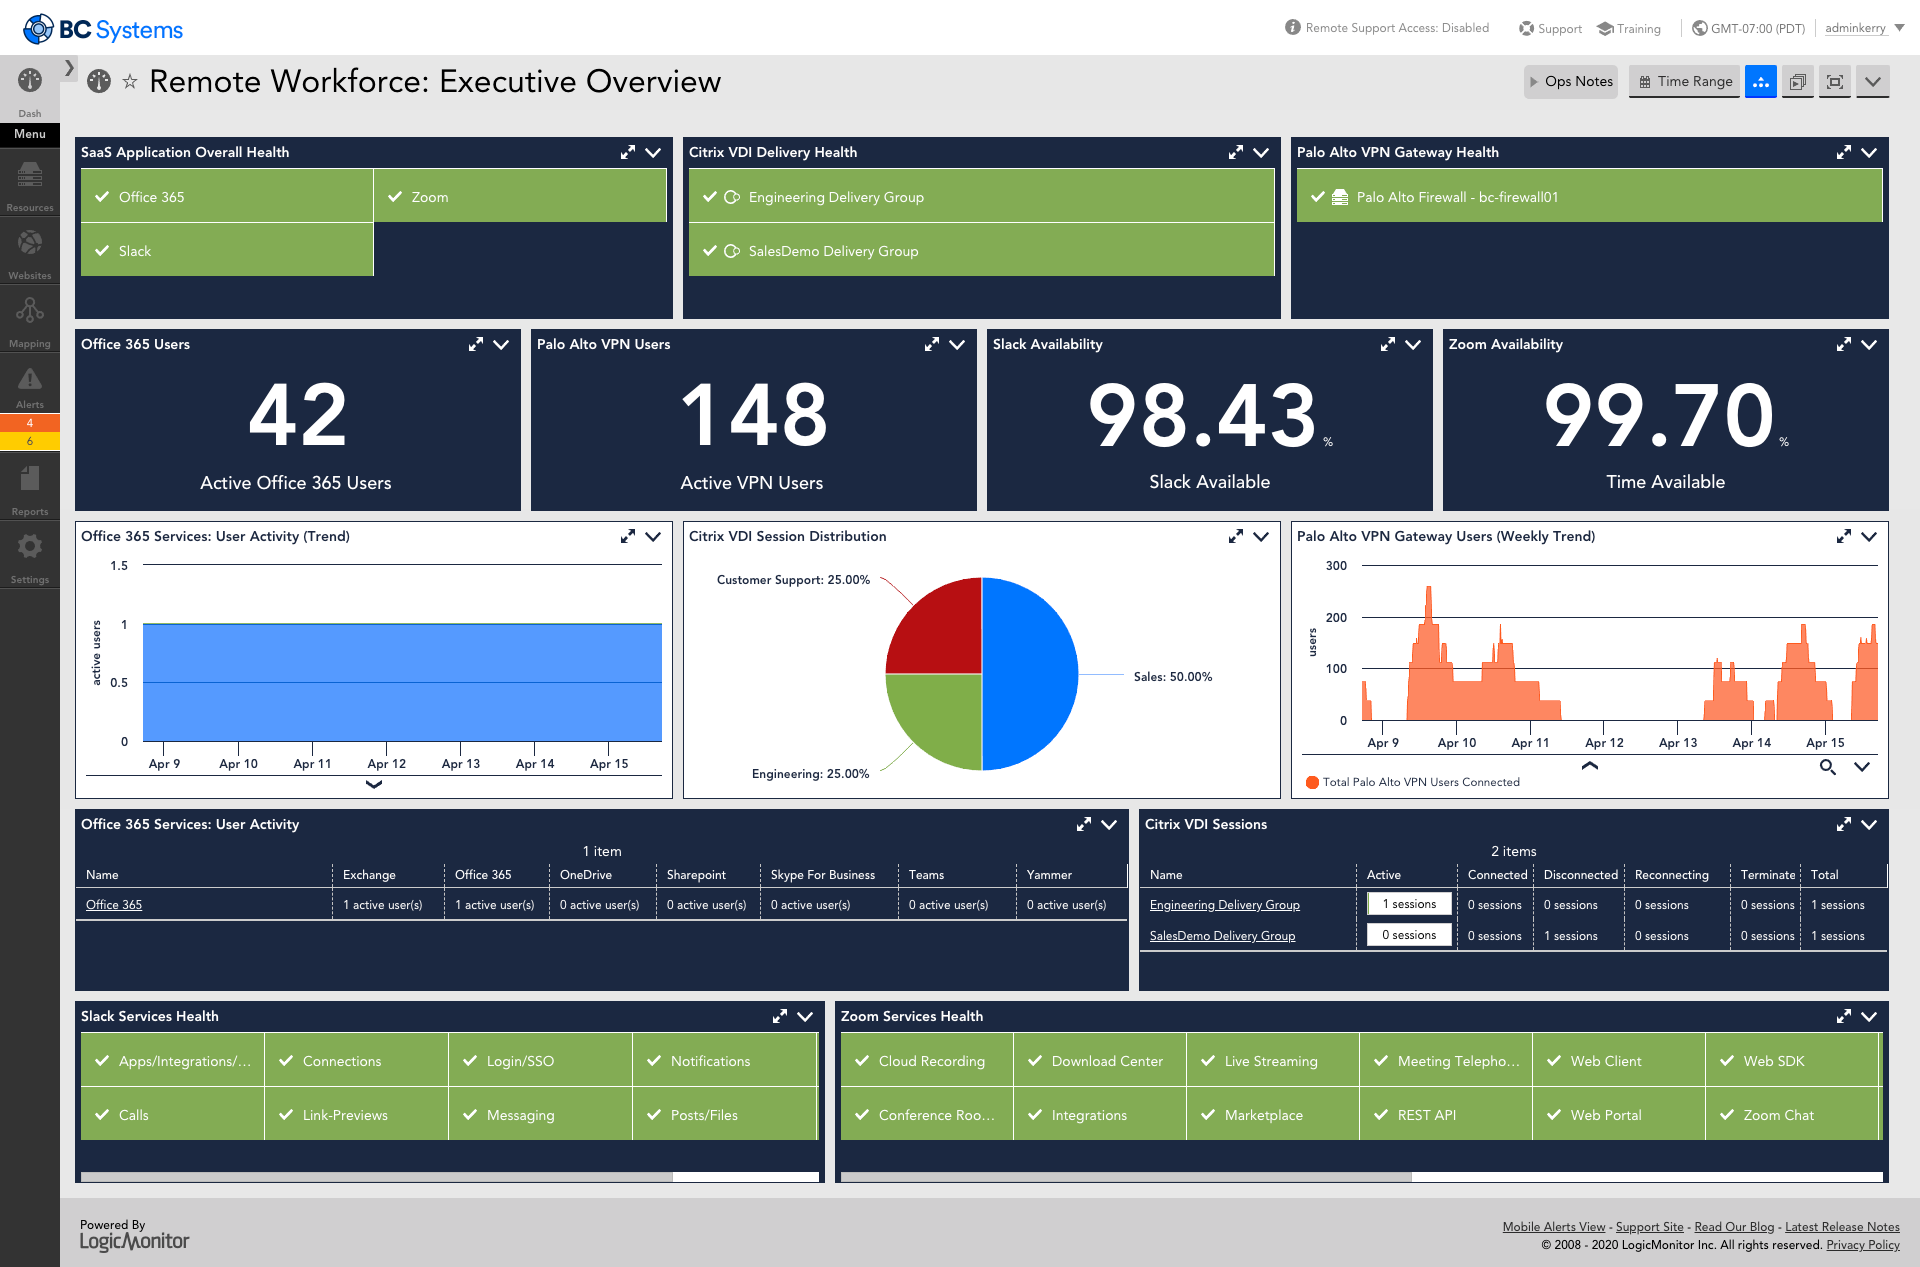
Screenshot of LogicMonitor remote workforce monitoring, which ensures that employees are connected to the systems that keep them productive and provide proactive insight into dispersed systems and third-party outages.
Screenshot of Unified cloud monitoring across a hybrid multi-cloud ecosystem.
Screenshot of LM Logs delivering log analysis at enterprise scale.

1 / 6

Screenshot of AIOps features for enterprises using technology or hybrid environments with cloud and container resources. LogicMonitor can be used to monitor and improve the performance of complex enterprise networks with dynamic thresholds, topology mapping, anomaly detection, and root cause analysis.

Top Performing Features

  • Remote monitoring

    Monitoring of network operational activities through the use of remote devices known as monitors or probes

    Category average: 8.9

Areas for Improvement

Pros

  • Smart Alerting for noise reduction and automated workflows
  • Automated Device Discovery for seamless infrastructure integration
  • Comprehensive Dashboards for system health visualization

Cons

  • Complexity in alert customization and threshold tuning
  • Basic reporting features with limited customization options
  • User interface can be complex for new or non-technical users

The Ultimate solution for security

Use Cases and Deployment Scope

LogicMonitor has become the core tool for our security systems. We rely on it to keep track of our servers and ensure our systems are running smoothly. As a QA, I use it to figure out whether an issue reported by a user is a real problem or just a temporary glitch. It helps us avoid guessing by sending alerts and showing usage trends. In short, it is essential for monitoring our servers, cloud infrastructure, and key parts of the application. This setup ensures we're always aware of any potential issues and can address them quickly.

Pros

  • Keep our system secure and bugs free.
  • Stop the outside access to our systems immediately.
  • Our server data is secure from outside access or unauthorized access.
  • The automation has reduced the manual work to minimum.
  • It is growing with our system, handling more devices without slowing down.
  • It has become easy to use, even for people who are not tech experts.

Cons

  • Dashboard should be more easy to use for new users.
  • User Interface should be fast while showing the graphs and or switching views.
  • Alerts should be more customizable so we do not get so many alerts.

Return on Investment

  • Security of our systems are improved with it.
  • Data is secure than ever for and our clients.
  • All the systems are secure either they are onsite or remote or in cloud.
  • System monitoring cost has minimized.
  • LogicMonitor scales with us without performance issues.
  • It improves our security posture and reduces potential risks.

Alternatives Considered

Datadog and New Relic

Other Software Used

New Relic, Datadog, Uberall, Miro, PagerDuty

The best allrounder and getting better all the time

Use Cases and Deployment Scope

LogicMonitor discovers, identifies and monitors all infrastructure on prem and cloud/SaaS meaning my team don't have to spend time configuring monitoring manually - this is a huge time saver. It also means I don't have to employ anyone or have specialist knowledge of monitoring tools since the platform is so automated.

Pros

  • Autodiscovery
  • Escalation based alerting including phone calls
  • Network mapping
  • OOB dashboards are excellent
  • AWS, Azure and GCP integration
  • Office 365 utilisation monitoring, saves £££ on MS licenses

Cons

  • Still no ability to push configs
  • Port-level network discovery and mapping could reduce troubleshooting time
  • Alerting based on log anomalies could see LogicMonitor displace SIEM competely

Return on Investment

  • Saved at least 50% of a headcount previously engaged in manual monitor and configuration of legacy tols
  • Identification of issues is rapid. The business is no longer the most useful alerting tool
  • Drastically reduced overspend on 365 licensing, LogicMonitor paying for itself in weeks not months or years!

Alternatives Considered

SolarWinds Network Device Monitor, Auvik and Checkmk

Usability

Monitoring is a breeze with LogicMonitor

Use Cases and Deployment Scope

We use LogicMonitor to monitor a variety of deployments at our client sites without requiring an intrusive collector to be installed or allowing us to monitor resources that don't allow for a collector to be installed (networking equipment, etc.)

Pros

  • Collector based monitoring
  • Monitoring a wide variety of sources
  • Easy customization and integration with platforms that aren't supported out of the box

Cons

  • The UI is undergoing an overhaul, so it can cause a disjointed experience while it's being updated
  • Collector can occasionally crash, and we don't always get notifications that something has died
  • Application of monitoring profiles isn't the most intuitive

Return on Investment

  • LogicMonitor has allowed us to quickly be alerted of issues in client sites that our previous monitoring solution might have taken minutes to alert on, allowing us to reduce downtime for clients
  • We were able to notify clients of outages before they even realized that anything had gone down, helping to build trust in us and further the relationship

Usability

LogicMonitor Could do more but great at what it does.

Use Cases and Deployment Scope

Our organization uses LogicMonitor to monitor application and server health on baremetal and virtual devices around the world. We also use it to facilitate observability on traffic flow, and the data from that is relied-upon by our billing and capacity planning teams. We use it to aggregate metrics that do not lend themselves well to association and analysis, and LogicMonitor has been the primary driver of alerts sent to our NOC.

Pros

  • Access and self-serviceability are good.
  • The architecture and flow of the group and dynamic assignment systems are probably LogicMonitor's strongest point. They allow us to set something once and then allow teams to do whatever they need to do within their own domain without having to go to us for everything.
  • The use of Groovy scripting for collection facilitates some monitoring that just wouldn't be possible otherwise.
  • The Properties and the way LogicMonitor assigns and uses them are particularly powerful.

Cons

  • While LogicMonitor offers tools for monitoring containerized environments, it is not the platform's strong suit. It is treated as more of an afterthought, which becomes more and more of a liability as the industry shifts more toward a container-centric environment.
  • The way collectors work in particular more or less makes containerizing them impossible. Horizontal container scaling can be extremely painful and comes with proportionally increased operational overhead. Vertical scaling is limited in usefulness; even a 2XL collector can't handle a particularly impressive amount of traffic or data.
  • While the "Services" data aggregation mechanics LogicMonitor offers have a lot of potential and are powerful within a narrow domain, they do not lend themselves well to a lot of common use cases, aren't as modular and customizable as many of the other features in LogicMonitor, and the billing surrounding them is difficult to understand or justify.
  • LogicMonitor's support started out top-of-the-line but has steadily declined. It did not take me long to reach the point where I knew more about the platform than the first- and often second-tier support, and they are often unwilling to escalate my issues to a more senior support member, even when explicitly asked to do so. They also run all tickets through an AI chatbot now, so it's impossible to actually open a ticket without talking to it.

Return on Investment

  • LogicMonitor has had a positive impact on our business objectives, allowing more freedom and better coverage for both monitoring admins and our internal customers than our previous platforms.
  • It has helped us eliminate a huge amount of alert noise before it hits our ticketing system and gain insight into events that would have gone unnoticed otherwise.
  • The dynamic assignment and group management systems have allowed us to set up a paradigm wherein our teams can do as they please within their domains, and things will "just work."

Alternatives Considered

Datadog and Percona Monitoring and Management (PMM)

Other Software Used

Red Hat OpenShift, Helm

Automation that saves time and effort.

Use Cases and Deployment Scope

It has been a while since we started using LogicMonitor. We used to ensure that all of our company's systems operated safely. LogicMonitor is always there to keep our systems running smoothly. It alerts us at the correct moment if anything goes wrong with our systems. It also informs us if any of our systems require any upgrades. Even our non-tech team members can easily understand if the dashboard is showing system health and performance.

Pros

  • Smart alerts.
  • Easy-to-read dashboards.
  • It always finds the real problem fast.
  • Connects with our other tools easily.
  • It automatically finds new servers or systems we add.

Cons

  • Limited Alert Options.
  • Basic charts should be advanced.
  • Bettercloud support is required.

Return on Investment

  • Faster fixes.
  • Fewer annoying alerts.
  • Saves troubleshooting time.
  • Clear information for everyone.

Other Software Used

Asana, Atlassian Jira, Workday Human Capital Management, Miro