
Collin Thoman
Systems Administrator
Chose LogicMonitor

| Product | Rating | Most Used By | Product Summary | Starting Price |
|---|---|---|---|---|
 Datadog | N/A | Datadog is a monitoring service for IT, Dev and Ops teams who write and run applications at scale, and want to turn the massive amounts of data produced by their apps, tools and services into actionable insight. | $18 per month per host | |
 LogicMonitor | Mid-Size Companies (51-1,000 employees) | LogicMonitor’s SaaS-based platform, LM Envision, enables observability across on-prem and multi-cloud environments. It provides IT and business teams operational visibility and predictability across their technologies and applications. | N/A |
| Datadog | LogicMonitor | |||||||||||||||
|---|---|---|---|---|---|---|---|---|---|---|---|---|---|---|---|---|
| Editions & Modules |
|
| ||||||||||||||
| Offerings |
| |||||||||||||||
| Entry-level Setup Fee | Optional | No setup fee | ||||||||||||||
| Additional Details | Discount available for annual pricing. Multi-Year/Volume discounts available (500+ hosts/mo). | Our platform is broken down into Pro and Enterprise Pricing. Pro includes monitoring for all of your cloud, hybrid, and on-premises infrastructure. Our Enterprise package includes all of this, plus our AIOps and Machine Learning functionality that provides dynamic thresholds, root cause analysis, anomaly detection and more! LogicMonitor only charges by the device. What is considered a device? A device is anything with an IP address that you want to monitor, including a physical device or a cloud resource. This means multiple data sources under the same IP address can be monitored for the same price. Unlike some monitoring platforms. we don’t charge per node, interface, or metric. | ||||||||||||||
| More Pricing Information | ||||||||||||||||
| Datadog | LogicMonitor | |
|---|---|---|
| Considered Both Products |  Datadog No answer on this topic |  LogicMonitor Collin Thoman Systems Administrator Chose LogicMonitor  Kurt Nissen Senior Manager Information Technology Infrastructure Chose LogicMonitor LogicMonitor won out against Datadog and SolarWinds in almost every category which made it an easy decision to go with LogicMonitor.  Utkarsh Gaur Therapy Manager Chose LogicMonitor We evaluated Datadog, but it was primarily focused on data-related issues. So we decided to use LogicMonitor because it is excellent and offers so many more things than just data protection. It also keeps our systems safe with an advanced alert system, which is more critical …  William Guertin Senior System Administrator Chose LogicMonitor I didn't keep my list of all the various products that we had POC'ed or even had demos with. Almost all were too narrow in their view to handle the breadth of environments that we have both in the cloud and in the data centers. Those few that did stack up against LogicMonitor … |
| Datadog | LogicMonitor | ||||||||||||||||||
|---|---|---|---|---|---|---|---|---|---|---|---|---|---|---|---|---|---|---|---|
| Monitoring Tasks |
| ||||||||||||||||||
| Management Tasks |
| ||||||||||||||||||
| Reporting |
| ||||||||||||||||||
| Security |
|
| Datadog | LogicMonitor | |
|---|---|---|
| Small Businesses |  Amazon CloudWatch Score 7.6 out of 10 | Amazon CloudWatch Score 7.6 out of 10 |
| Medium-sized Companies |  ManageEngine Site24x7 Score 10.0 out of 10 | ManageEngine Site24x7 Score 10.0 out of 10 |
| Enterprises | ManageEngine Site24x7 Score 10.0 out of 10 | ManageEngine Site24x7 Score 10.0 out of 10 |
| All Alternatives | View all alternatives | View all alternatives |
| Datadog | LogicMonitor | |
|---|---|---|
| Likelihood to Recommend | 8.9 (65 ratings) | 8.9 (181 ratings) |
| Likelihood to Renew | 4.3 (2 ratings) | 8.0 (9 ratings) |
| Usability | 8.7 (44 ratings) | 7.3 (31 ratings) |
| Availability | - (0 ratings) | 9.1 (1 ratings) |
| Performance | - (0 ratings) | 9.1 (1 ratings) |
| Support Rating | 5.0 (7 ratings) | 6.0 (110 ratings) |
| In-Person Training | - (0 ratings) | 8.2 (1 ratings) |
| Online Training | - (0 ratings) | 7.3 (1 ratings) |
| Implementation Rating | 1.0 (1 ratings) | 9.0 (26 ratings) |
| Configurability | - (0 ratings) | 9.1 (1 ratings) |
| Contract Terms and Pricing Model | - (0 ratings) | 7.4 (5 ratings) |
| Ease of integration | - (0 ratings) | 7.3 (1 ratings) |
| Product Scalability | - (0 ratings) | 9.1 (1 ratings) |
| Professional Services | - (0 ratings) | 7.6 (4 ratings) |
| Vendor post-sale | - (0 ratings) | 9.1 (1 ratings) |
| Vendor pre-sale | - (0 ratings) | 9.1 (1 ratings) |
| Datadog | LogicMonitor | |
|---|---|---|
| Likelihood to Recommend | Datadog
| LogicMonitor
|
| Pros | Datadog
| LogicMonitor
|
| Cons | Datadog
| LogicMonitor
|
| Likelihood to Renew | Datadog
| LogicMonitor
|
| Usability | Datadog
 Jeffrey van Santen Sr SWE | LogicMonitor
 Martin Sims Infrastructure Engineer |
| Support Rating | Datadog
| LogicMonitor
 Jeremy Hutton Senior Network Engineer |
| In-Person Training | Datadog No answers on this topic | LogicMonitor
 Idan Lerer Senior Director, US Operations |
| Online Training | Datadog No answers on this topic | LogicMonitor
Idan Lerer Senior Director, US Operations |
| Implementation Rating | Datadog
| LogicMonitor
|
| Alternatives Considered | Datadog
| LogicMonitor
|
| Contract Terms and Pricing Model | Datadog No answers on this topic | LogicMonitor
 Zachary Brand Senior Director of Connected Solutions Delivery |
| Professional Services | Datadog No answers on this topic | LogicMonitor
|
| Return on Investment | Datadog
| LogicMonitor
|
| ScreenShots | Datadog Screenshots      | LogicMonitor Screenshots 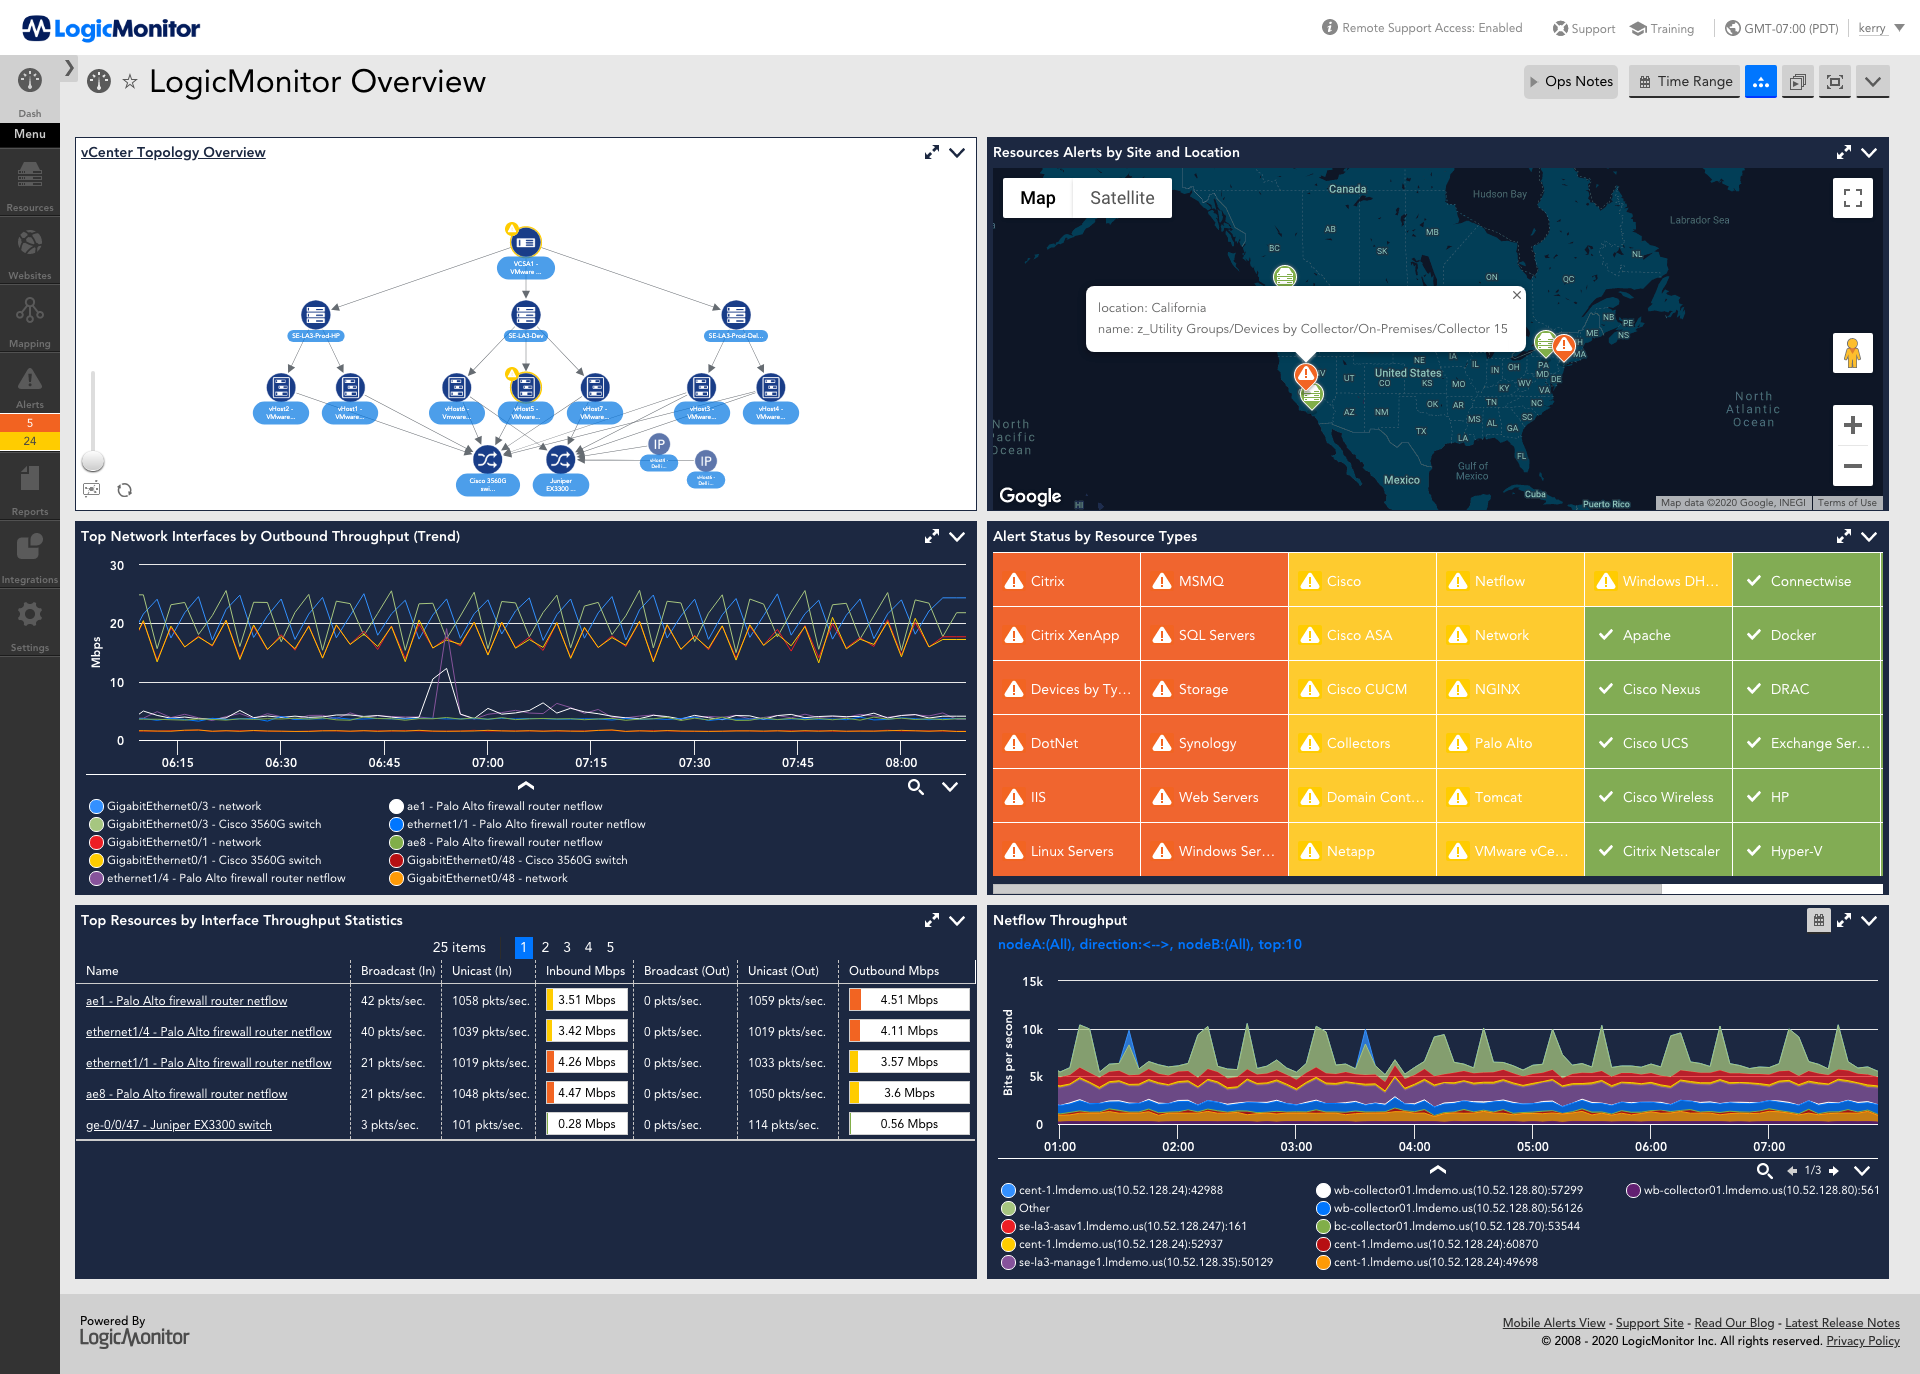  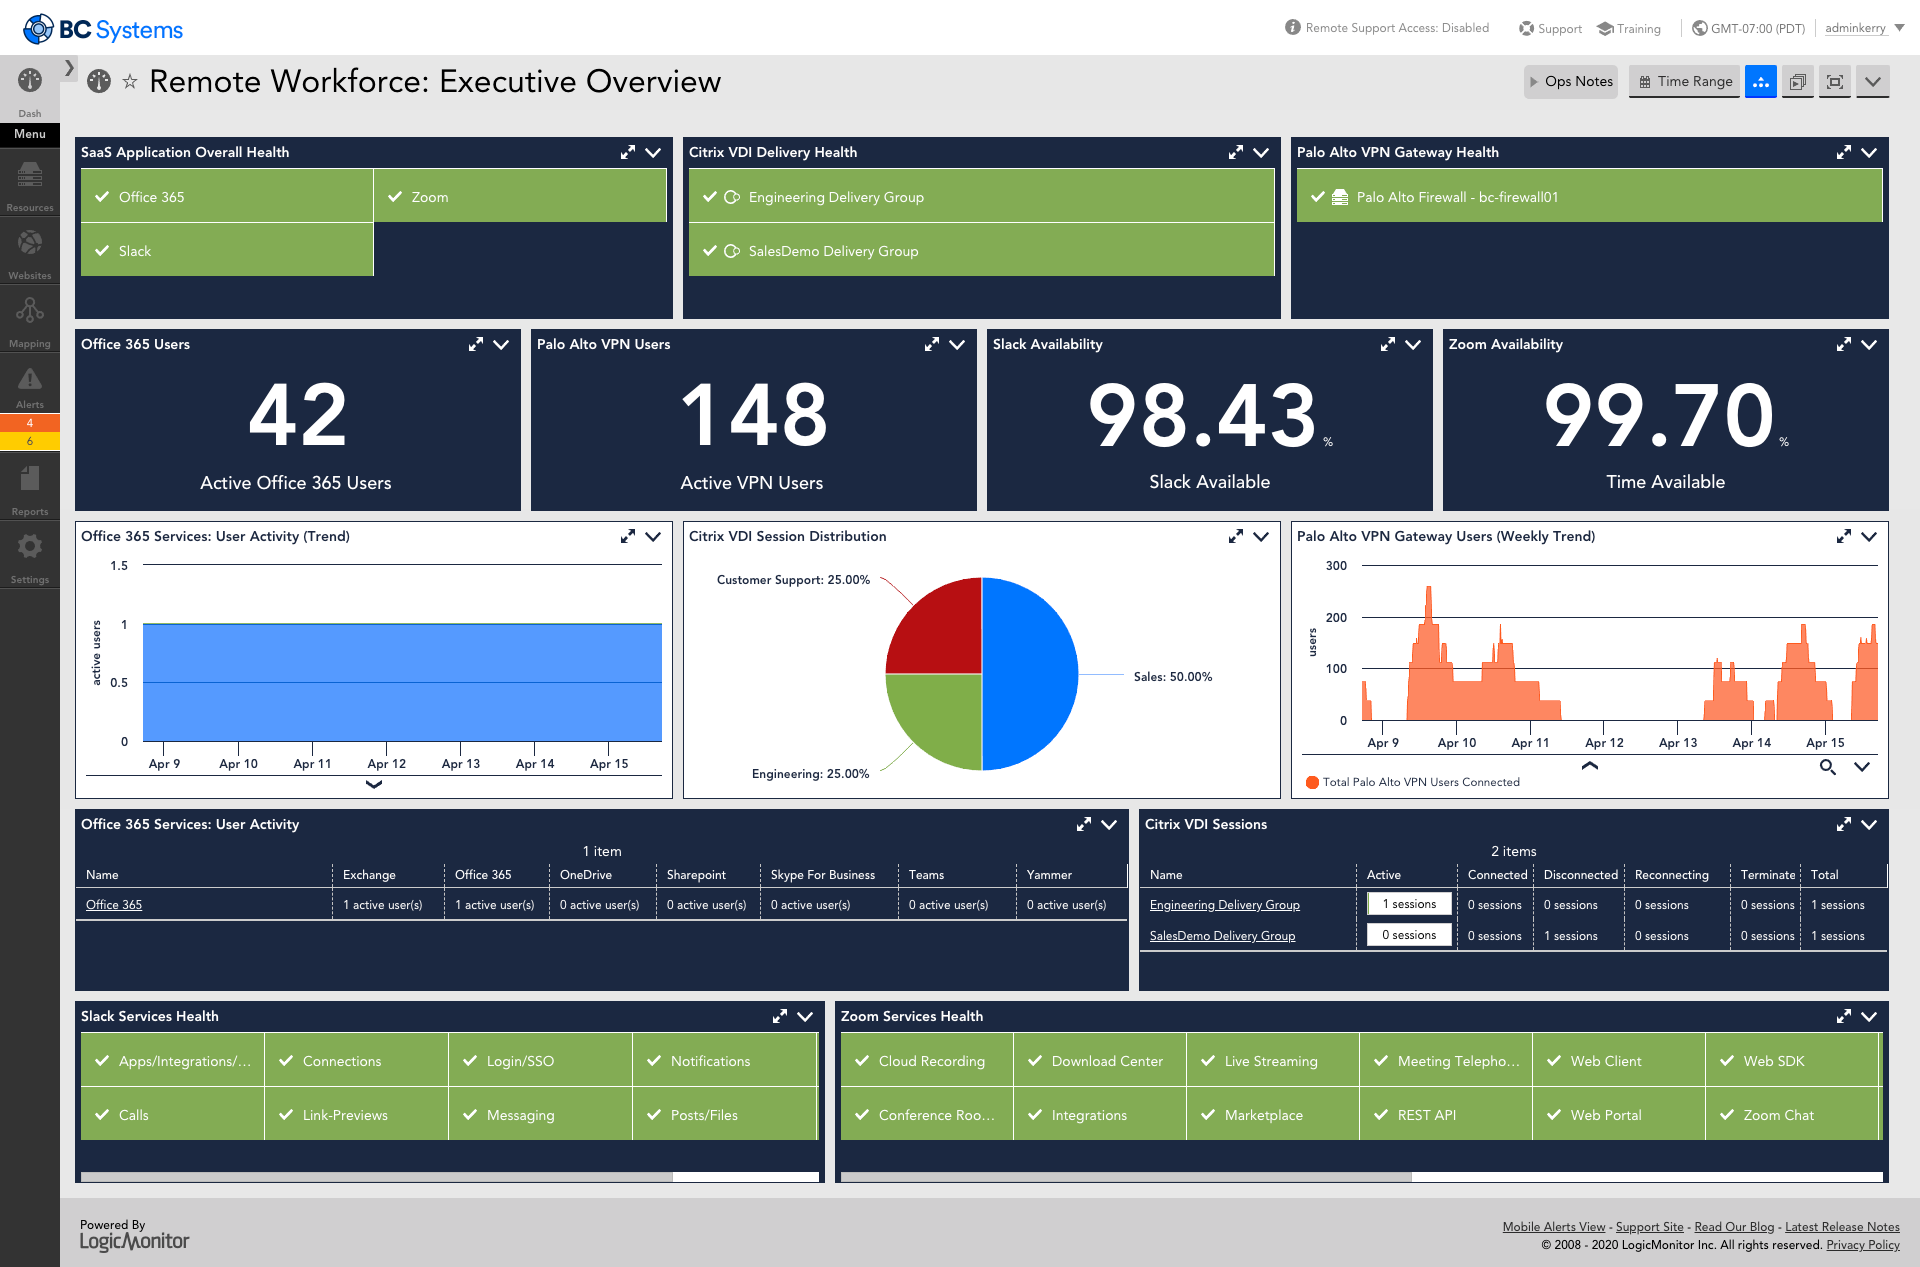   |