LogicMonitor’s SaaS-based platform, LM Envision, enables observability across on-prem and multi-cloud environments. It provides IT and business teams operational visibility and predictability across their technologies and applications.
N/A
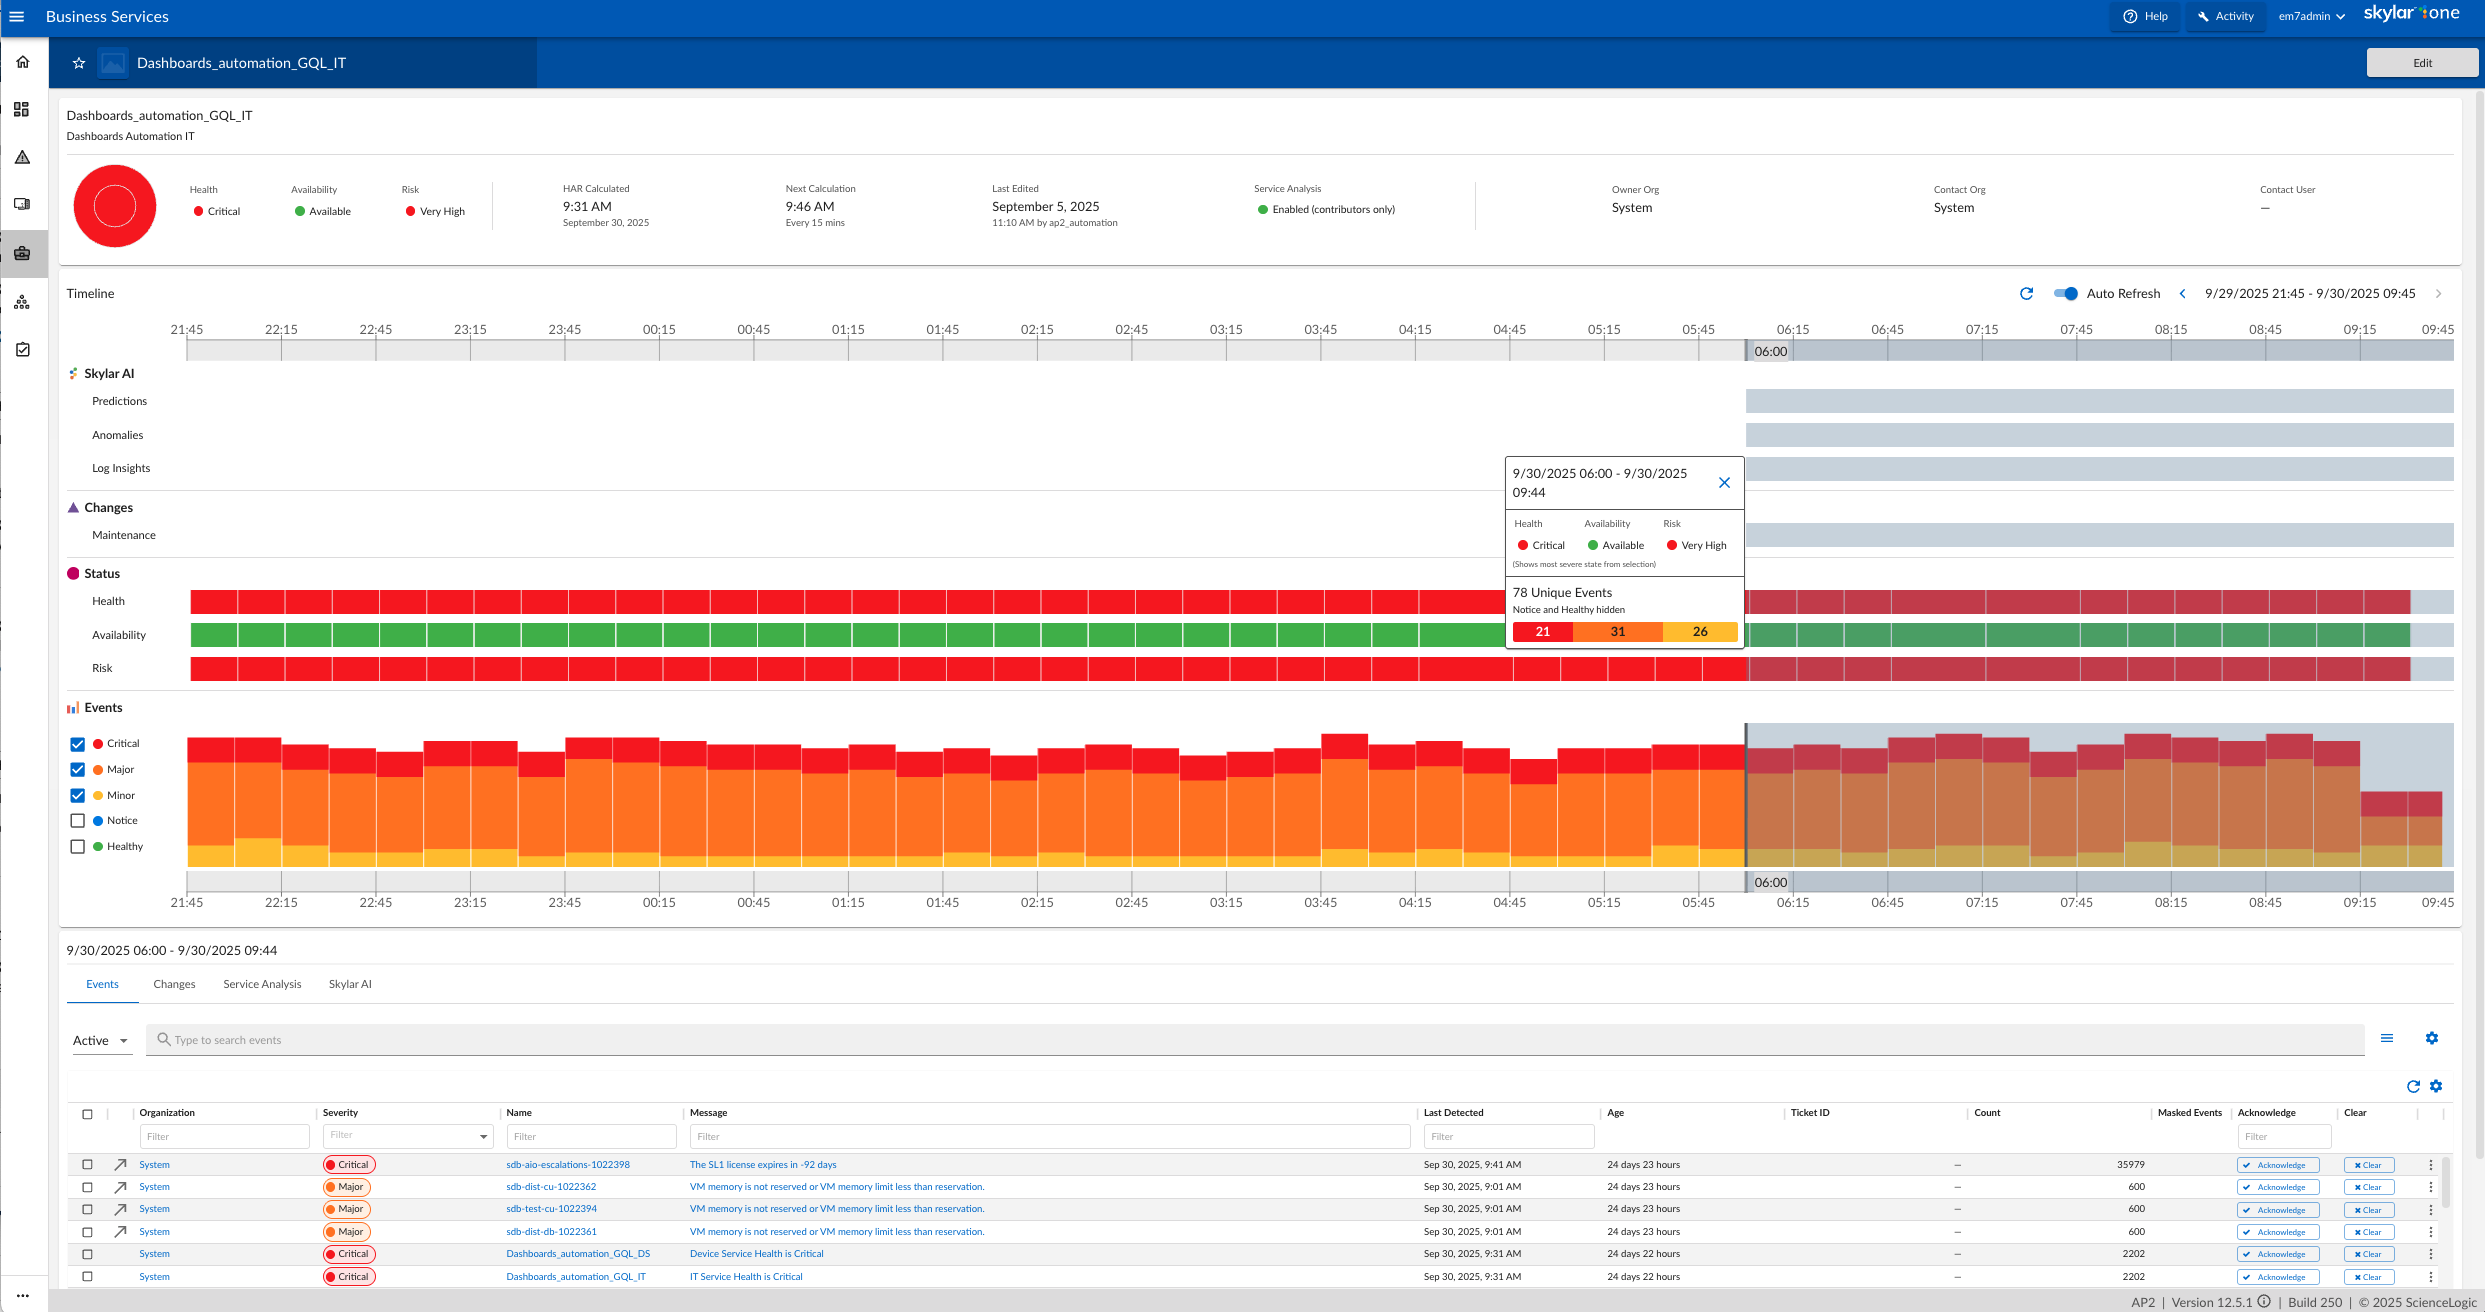
ScienceLogic AI Platform
Score 8.8 out of 10
Enterprise companies (1,001+ employees)
ScienceLogic provides a unified IT Operations platform designed to manage operational workflows using high-fidelity Telemetry Data and explainable automation.
The ScienceLogic AI Platform is deployable across On-Premises, Cloud, and Hybrid Environments. The platform consolidates monitoring tools to provide Observability and enables engineers to automate manual processes using Machine Learning capabilities.
The platform utilizes automation for Closed-Loop Remediation and provides insights…
N/A
Pricing
LogicMonitor
ScienceLogic AI Platform
Editions & Modules
Enterprise
Contact sales team
Website Monitoring
Contact sales team
No answers on this topic
Offerings
Pricing Offerings
LogicMonitor
ScienceLogic AI Platform
Free Trial
Yes
No
Free/Freemium Version
No
No
Premium Consulting/Integration Services
No
No
Entry-level Setup Fee
No setup fee
Required
Additional Details
Our platform is broken down into Pro and Enterprise Pricing. Pro includes monitoring for all of your cloud, hybrid, and on-premises infrastructure. Our Enterprise package includes all of this, plus our AIOps and Machine Learning functionality that provides dynamic thresholds, root cause analysis, anomaly detection and more!
LogicMonitor only charges by the device. What is considered a device? A device is anything with an IP address that you want to monitor, including a physical device or a cloud resource. This means multiple data sources under the same IP address can be monitored for the same price. Unlike some monitoring platforms. we don’t charge per node, interface, or metric.
ScienceLogic SL1 offers four tiers:
SL1 Advanced – Application Health, Automated Troubleshooting and Remediation Workflows
SL1 Base – Infrastructure Monitoring, Topology & Event Correlation
SL1 Premium – AI/ML-driven Analytics, Low-Code Automated Workflow Authoring
SL1 Standard – Infrastructure Monitoring – with Agents, Business Services, Incident Automation, CMDB Synchronization, Behavioral Correlation
I was one of the members who were looking for a better application for our system security, and we tried Datadog and New Relic. Those software were very good for normal usage. New Relic was working fine until we started facing problems if any sudden system increase as it was …
I did use Dynatrace for my freelance work, as I was doing some projects on weekends for some extra income. We used to protect all of the financial information. However, LogicMonitor is used by our organization. I must say I really like LogicMonitor, as it is the best solution …
It was a fantastic product, but I used it in my previous company. After I changed jobs, I became familiar with LogicMonitor because my current employer was considering it. I must say I have not faced any issue within my career since the time I started using it, and we are happy …
We did not use software like LogicMonitor for the same work before, but I must say that my experience with LogicMonitor has been outstanding so far. It helps me to be free of tension. I can now concentrate on the actual work I was hired to do for my company.
Some teams in our company are also using New Relic, and they are pretty satisfied with it. However, I also used it for some time, and I did not find it as flexible as LogicMonitor for our needs. So, yes, I suggested that management remove New Relic, as we have a superior tool …
Our business used the trial period they provided on one of our systems and conducted sessions with all of this software. Our team tested all of these software options before deciding on LogicMonitor, as our business is expanding daily and we needed a system that could …
Basically, we did not have any idea about it and how to choose, but we asked one of our former bosses, as they were very experienced with it, so they helped us by clarifying a few things between New Relic and LogicMonitor, as they told us that if you are looking for an …
We evaluated Datadog, but it was primarily focused on data-related issues. So we decided to use LogicMonitor because it is excellent and offers so many more things than just data protection. It also keeps our systems safe with an advanced alert system, which is more critical …
SaaS monitoring makes so much sense. Why run your monitoring inside the same environment you're trying to monitor, and how do you monitor your on prem monitoring if there's an outage affecting your own infrastructure? Whilst LogicMonitor isn't a specific point solution so …
SolarWinds Access Rights Manager (ARM), SolarWinds NetFlow Traffic Analyzer (NTA), SolarWinds Network Automation Manager (NAM) and Microsoft System Center Operations Manager (SCOM)
When looking for a monitoring tool, LogicMonitor was similar or better than all of them. We moved away from SolarWinds because of its inability to monitor other network environments and lack of a collector or probe type device that could collect remote data. PRTG was very …
LogicMonitor was the most versatile and easy to deploy solution. The data from LogicMonitor could be integrated with our other platforms, so it became the source of truth.
We replaced N-Central with LogicMonitor, and had an extended bakeoff with Datadog. There were many things we liked (and still like) about Datadog, but its deployment model and less agnostic focus were disqualifying for our specific use case.
Our initial business requirements in 2016 were to monitor Vblock and FlexPod deployments. We had specific gaps with particular storage appliances the monitoring tool we used at that time could not monitor effectively. When evaluating the mentioned solutions, LogicMonitor was …
After switching from Solarwinds to LogicMonitor we would never go back. The higher price for LogicMonitor is well worth all the areas that this platform excels when compared to Solarwinds. The support is great, they are available directly through the web portal in a chat and I …
During the evaluation process we looked a number of other solutions, a detailed technically analysis was carried out to map functionlity, deployment and scalabilty across the solutions.
The primary areas that LogicMonitor succeeded are around the simplicity of deployment, …
Domotz didnt cover all devices, for example MacOS devices. Which we dont have a lot of but are still critical to monitor on our network. Solarwinds Network Device monitoring was free and great, however the display was a bit much. Also had a lot of stuff we didnt really need to …
Auvik did not provide historical data and could not monitor as many device types as LM. We found the Auvik collector to be more "buggy" and have had less issues with LM. We do feel that Auvik had a better network topology map and would clearly show device relationship. That is …
LogicMonitor has a ton more ways to customize and monitor specific processes or items that other products simply cannot do. We started monitoring applications and actually logging into them to verify everything from start to finish is fully monitored and is working properly. I …
SolarWinds had the big breach just as we left it. We loved how powerful it was, and how customizable - however, it is an ON-Prem tool, and as a growing MSP, that dynamic didn't and couldn't scale. We then moved to Auvik, which had the cleanest GUI and some neat features. That …
LogicMonitor is much easier to configure, deploy, and manage than Zabbix. Alert tuning and client configuration is clear and intuitive in LogicMonitor. Zabbix is agent based, very convoluted configuration, and is difficult to adjust tuning to minimize false positives and alert …
real-time data monitoring, scalability of a complex environment is the key feature. For any new requirement, powerpack installation is very easy & handful.
Both of the tools we used before were with agents, so there was a need to configure the agent initially, before it could be used. Sometimes, there were issues with the service or the configuration of the agent, and deep troubleshooting was necessary to find the mistake in …
Restorepoint is a great tool and perfectly integrated with ScienceLogic SL1. However, PowerFlow implementation is not smooth and don't have enough resources to help build out the features necessary for a successful implementation. Also, documentation is not well written.
ScienceLogic SL1 supports large scale of IT Infrastructure devices and vendors. Was the single tool providing multiple functionalities at same time and allowed to remove additional legacy tools used for monitoring. Allowed integration with incident management and CMDB. Allowed …
From a capability perspective they stack up very similar but from a look and feel, ScienceLogic SL1 one is miles behind the curve on all three. We chose SL because we already had elements of the service in place on our infrastructure from our previous MSP so they were a …
I see great potential and infact i do strongly beleive it offers even beter capabilities than the traditional tools out there but again it comes down to how well you have trained us on how to unlock these capabilities. I suggest incentives for techs for providing feedback for …
Geneos is more complicated and 'heavy' to setup. It requires a lot of expertise in setting up. Also the dashboards are not great. ScienceLogic SL1 works well for customer facing dashboards.
Entuity was lacking a lot of custom reporting and also the out of the box automation and RBA was also less. Our customers were mainly looking for devices which are next gen like sdwan which Entuity doesn't support. When it come to ScienceLogic SL1 it will support all sets of …
As a fresher, this is my first organization, and they use SL1. So, I don’t have more knowledge of other tools. But I do know Grafana, which is predominantly used for dashboards. I think compared to that, the SL1 dashboard gives more details about devices. So, I feel SL1 would …
Galileo analyzes storage arrays and backups more thoroughly, but SL1 is much better for host and network monitoring. SL1 has some storage monitoring features for some storage arrays, but they are not as detailed.
I was not part of the team selecting ScienceLogic SL1. Our goal was to increase event visibility in our server environment. We were using scripting which created many false events. SolarWinds is primarily used in the Network space to monitor network gear.
Agentless product that can integrate easily with other product and also allow us to automate tasks, example closing tickets when events are cleared automatically which user interactions.
Just because Science logic provides much more better enhancement and getting improved everyday. The autonomous integration and overall customization provided by the SL1 Platform is outstanding. In every sections be it in Monitoring or checking system logs and provide the best …
We have several government departments and universities as our clients, and we conduct online examinations for them. Therefore, our servers require additional security to prevent unauthorized access to our systems remotely without our permission. We were performing an examination for one of our clients when someone from outside attempted to access our systems by creating a backdoor to our servers. Our team was busy handling the examination process and ensuring its smoothness. However, thanks to LogicMonitor, we were alerted at the right time, and we were able to save our data and clients' information with its help.
Appropriate if you are setting up a monitoring suite in new Infrastructure Environment. Definitely NOT suited for Migration Projects. ScienceLogic SL1 cannot cater to a lot of monitoring requirements which already would have been configured in old monitoring suite. Plus, limited support for customizations and having to go to "Feature Requests" route makes in extremely complicated.
LogicMonitor is very customizable. We can build whatever modules we need, because it uses standard protocols like HTTPS, SNMP and WMI to gather data and metrics.
We like that LogicMonitor is an agentless solution for our use case. Not all customers will allow an agent-based approach to 3rd party tools.
LogicMonitor has thousands of out of the box modules, which work on their own and also act as good baselines for the ones that we will end up customizing more. We are rarely starting at zero when we decide to do something new with LogicMonitor.
LogicMonitor has great documentation, and support has been helpful in the instances where we've needed them.
Creating powerpacks from scratch for new devices may be straightforward but will rarely be easy. Rewarding when completed, but not easy.
Developer documentation needs a rethink. While the information may be there (it isn't always) it is not easy to find. This is not helped by using different terms for the same things.
A developer console/dashboard for monitoring data collection from powerpacks instances without having to switch webpages or have to monitor multiple webpages.
This product has met virtually all of our needs. It was easy to implement and has been simple to support. Customization has been intuitive with many options available. They keep adding features and expanding available options. The future of LogicMonitor looks even better than it is today which is very promising. The management and support teams at LogicMonitor are always helpful
We migrated away from our 20-year-old homegrown solution and have no back-tracking capability. ScienceLogic is demonstrating new capabilities that we would not have been able to do on our own using our legacy system. We understand the capabilities of competitors based on our bake-off selection where ScienceLogic won on capabilities and future near-term potential (expandability, platform growth). We know that those competitors are not really close to where we have been able to push ScienceLogic (as a partner).
Set up is super easy. Just stand up a small Linux or Windows server to act as a collector. There are no agents to install on monitored devices and all you need is SNMP or WMI access. When creating dashboards, all you have to do is find the widget on the device you want to show up and choose the menu option to add it.
We use ScienceLogic SL1 in our organization to serve effective monitoring solutions to our external customers. Our customers depend upon us for critical events/alerts related to their IT infrastructure gears and using SL1, we're able to provide them with a proactive monitoring solution that resolves an issue before an impact is noticed by the customer. There are very few monitoring solutions that can cater to a variety of Cloud platforms like Public Cloud (AWS, Azure) and private cloud simultaneously and SL1 addresses this business problem very well
Science Logic SL1 provides the option of Distributed deployment where multiple instances of each appliance can be deployed to manage the load and availability. SL1 provides a High Availability feature for Database Servers and Data Collection. If one of the Data Collectors in the collector group fails, it will automatically redistribute the devices from the failed Data Collector among the other Data Collectors in the Collector Group. The high availability feature for the Database server ensures that SL1 performs failover automatically to another server without causing the outage to the application.
The performance is entirely dependent on the complexity of the environment/network being used to host the platform. Outside of those factors, the platform runs very efficiently and quickly out of the box. We have integrations with other platforms and neither seem to take a hit from our moderate API usage. Any issues with performance would be experienced by choices made in infrastructure or complexity of things built by the customer to display in the GUI (overly complicated and cluttered dashboards for example)
The sales team support we received was top notch. They worked hand in hand to make sure the product met all expectations. So far we have not really had to work with support that much; we have worked with setup team after purchase to deploy product fully. No issues so far and we are four weeks in.
So far, it's good as part of my overall experience, except for a couple of use cases. The support team is well knowledgeable, has technical sound, and is efficient. When support escalates to engineering, the issue gets stuck and takes months to resolve.
When I joined our company, I did not know about the in person training at firts. Logging onto the SL University, I realised that there were different sessions being held at different times throughout the year. The training itself was good, but being in a different time zone, made it difficult to attend, but the sessions that I attended was great!
There are a lot of educational materials and courses on the SL1 training site (Litmos university). However the recording quality is sometimes not very good - screen resolution is low. There is a lack of professional rather than user-oriented documents and there are mistakes in documentation and education is not well structured.
I did not truly dedicate myself to implementing LogicMonitor. However, I overheard the IT team members explain that "LogicMonitor is perfect for us as it has made most of the work automated, and implementation and training sessions were perfect for us." Thus, I can state that everything went smoothly with our implementation.
Along with the purchase of the solution, we purchased a statement of work with their Professional Services organization to meet our outcomes and fill our critical gaps. The PS team was outstanding, very professional and allowed us to screen share while they built our integrations. In many cases they would teach us how they did certain things within the platform.
We did not use software like LogicMonitor for the same work before, but I must say that my experience with LogicMonitor has been outstanding so far. It helps me to be free of tension. I can now concentrate on the actual work I was hired to do for my company.
Both of the tools we used before were with agents, so there was a need to configure the agent initially, before it could be used. Sometimes, there were issues with the service or the configuration of the agent, and deep troubleshooting was necessary to find the mistake in configuration before the communication with the endpoint was restored. Once the tools were running, they enabled very smooth reporting of what is running and what not, and the performance impact was lover than with WINRM monitoring.
Our deployment model is vastly different from product expectations. Our global / internal monitoring foot print is 8 production stacks in dual data centers with 50% collection capacity allocated to each data center with minimal numbers of collection groups. General Collection is our default collection group. Special Collection is for monitoring our ASA and other hardware that cannot be polled by a large number of IP addresses, so this collection group is usually 2 collectors). Because most of our stacks are in different physical data centers, we cannot use the provided HA solution. We have to use the DR solution (DRBD + CNAMEs). We routinely test power in our data centers (yearly). Because we have to use DR, we have a hand-touch to flip nodes and change the DNS CNAME half of the times when there is an outage (by design). When the outage is planned, we do this ahead of the outage so that we don't care that the Secondary has dropped away from the Primary. Hopefully, we'll be able to find a way to meet our constraints and improve our resiliency and reduce our hand-touch in future releases. For now, this works for us and our complexity. (I hear that the HA option is sweet. I just can't consume that.)
We have been able to eliminate multiple tools through LogicMonitor's ability to use collectors to run scripts and collect any numerical data from any reachable endpoint along with the customization and widgets available for dashboards. This has allowed for reduced costs and consolidation to a single point of view.
The ability to grant our clients access to see their data in real time has improved both our client satisfaction surveys and attributed to a few point gain in our NPS score. The ease of getting to the data has also reduced the quoting time for our sales teams during renewals to quantify what a client is consuming.
The amount of data that LogicMonitor collects affords our technicians a wide area of review when trying to isolate an issue and find a root cause. With the standard out of box data that is collected we have often been able to set a new threshold on something not previously thought of to proactively alert us in the future after identifying those root causes. This has reduced our Major Issues from 3-5 per month to usually 1-2 or less per quarter.