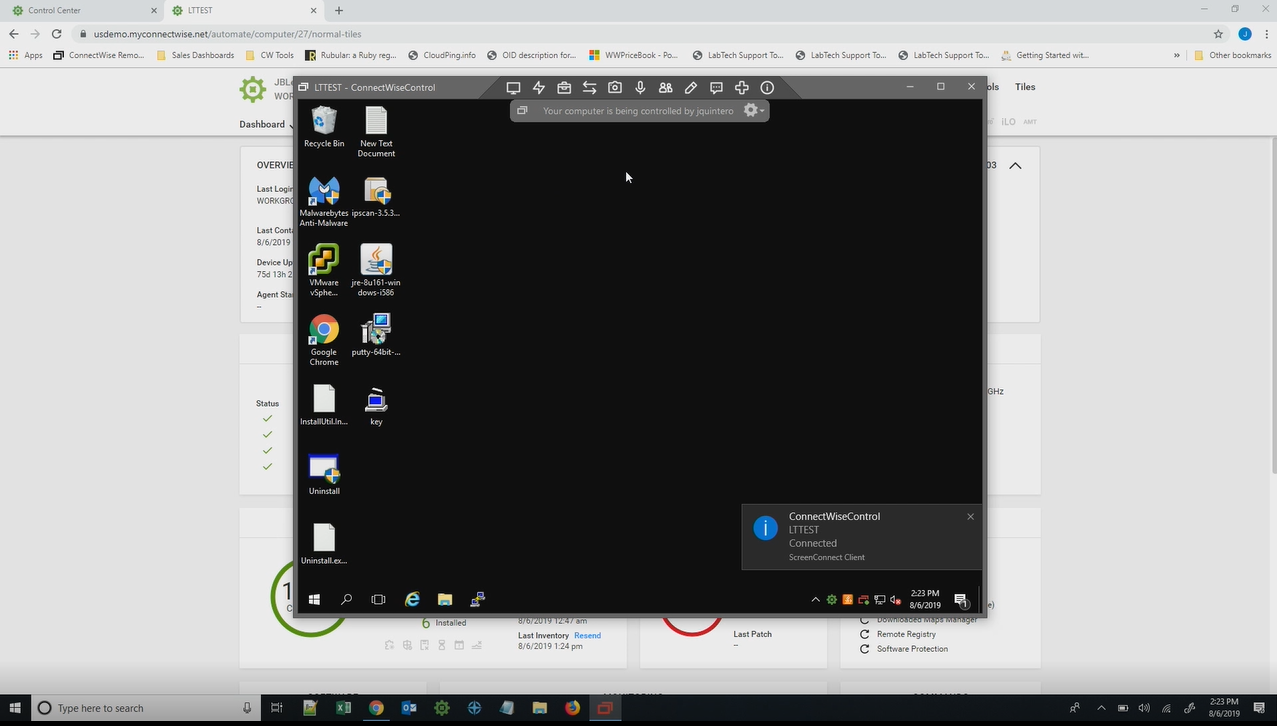
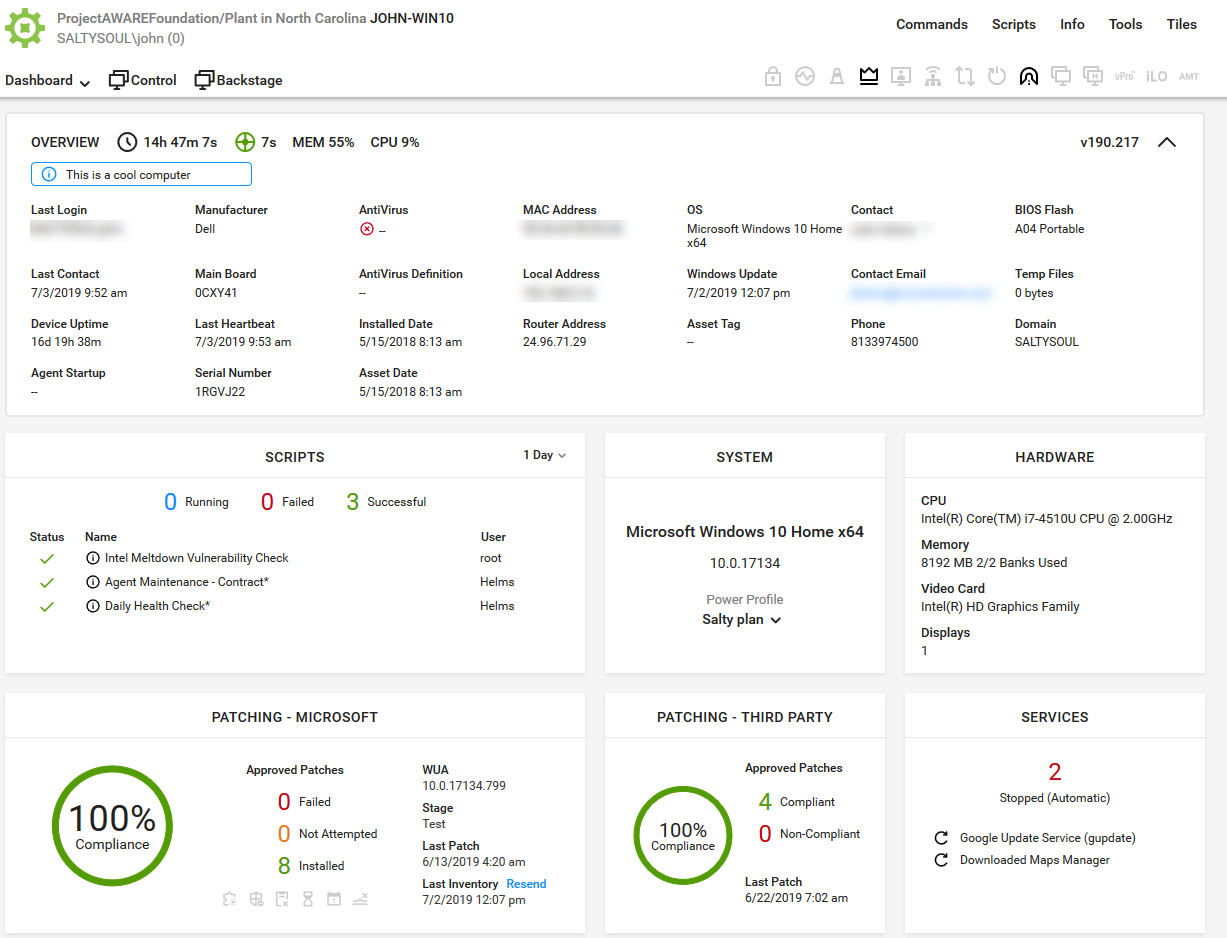
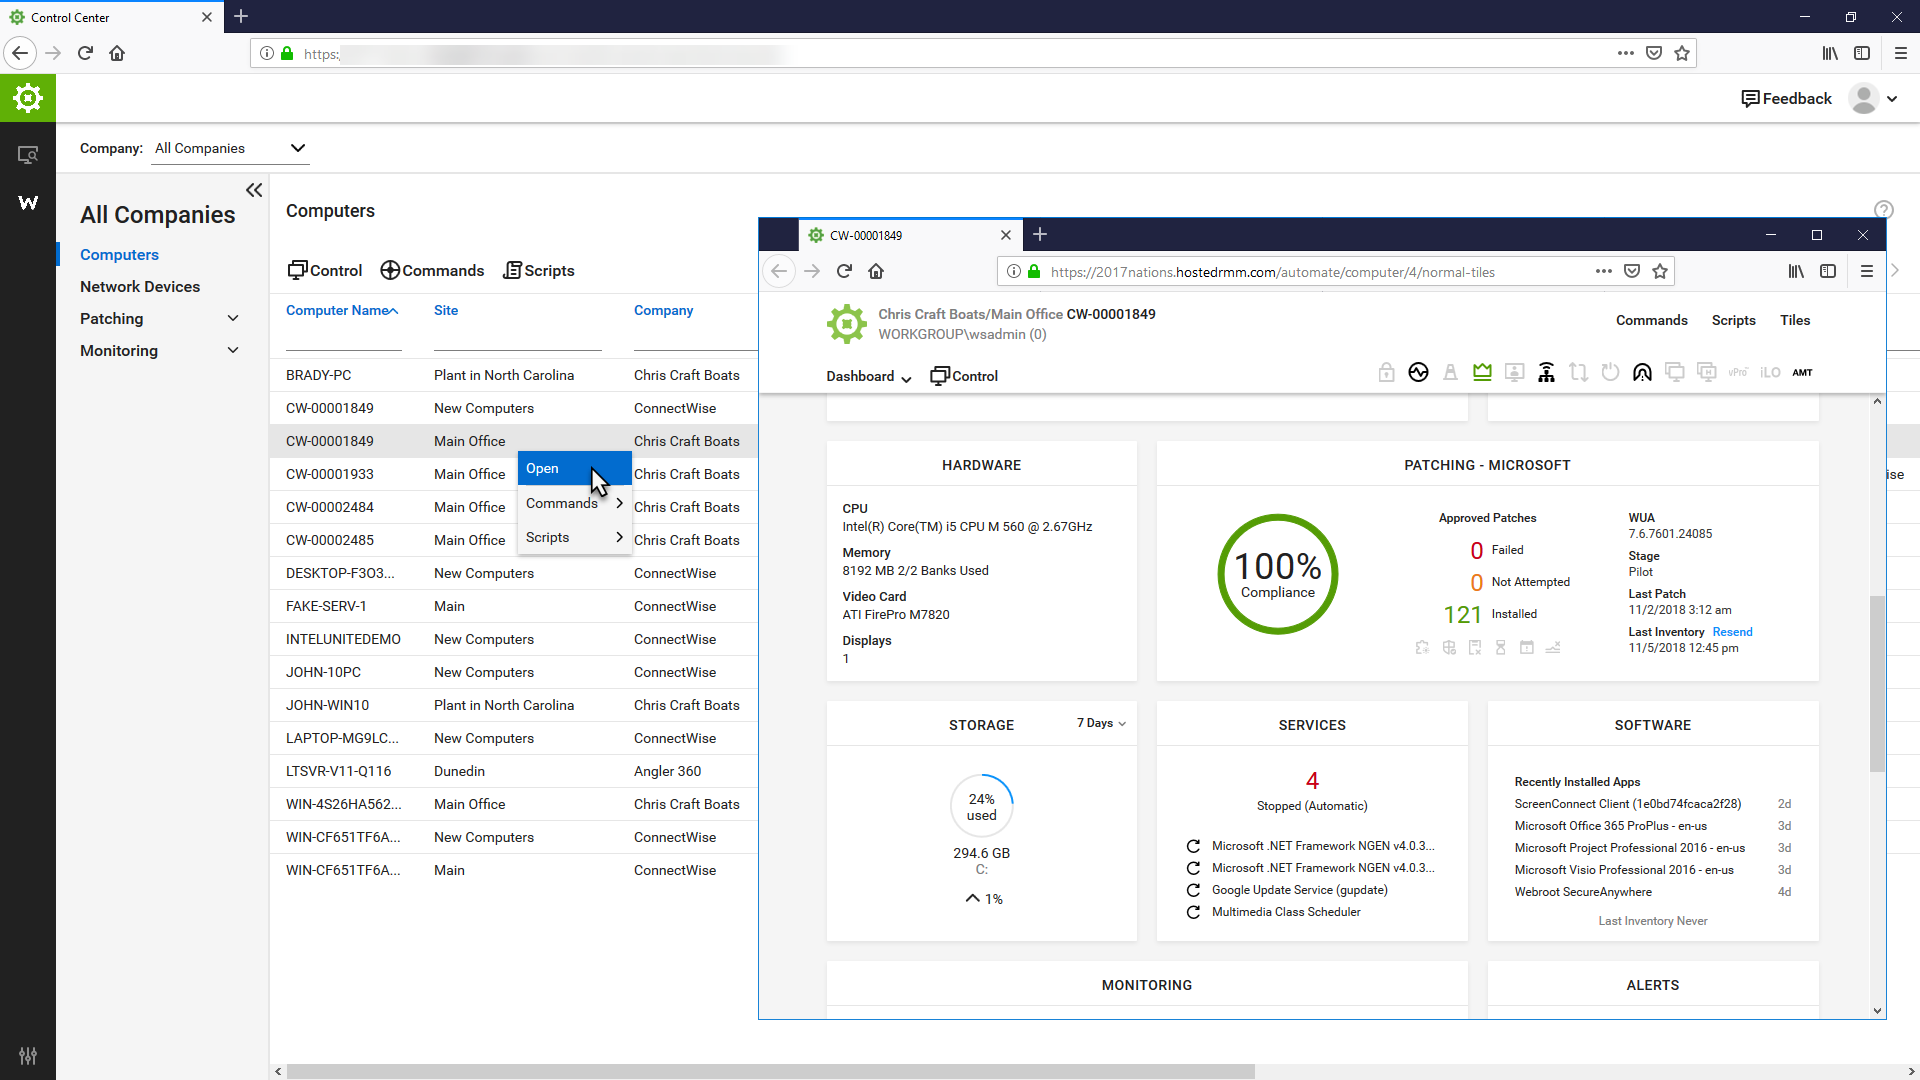
ConnectWise Automate, formerly LabTech, is a remote monitoring and management (RMM) platform. It provides powerful automation to discover and manage devices, monitor for problems, and scripts repetitive action.
$700
Datadog
Score 8.7 out of 10
N/A
Datadog is a monitoring service for IT, Dev and Ops teams who write and run applications at scale, and want to turn the massive amounts of data produced by their apps, tools and services into actionable insight.
$18
per month per host
Elastic Observability
Score 9.0 out of 10
N/A
Elastic Observability, from Elastic, the makers of Elasticsearch, is a solution that aims to bring logs, metrics, and APM based on the former Opbeat (acquired by Elastic in 2017) traces together at scale in a single stack so users can monitor and react to events happening anywhere in an IT environment. It's free and open to start, and adds the Logs, Metrics, APM (formerly Opbeat), and Uptime modules to the Elastic (ELK) Stack.
N/A
Pricing
ConnectWise Automate
Datadog
Elastic Observability
Editions & Modules
Agents
$1.00-$6.00
per month/per agent
Implementation Fee
$700
Log Management
$1.27
per month (billed annually) per host
Infrastructure
$15.00
per month (billed annually) per host
Standard
$18
per month per host
Enterprise
$27
per month per host
DevSecOps Pro
$27
per month per host
APM
$31.00
per month (billed annually) per host
DevSecOps Enterprise
$41
per month per host
No answers on this topic
Offerings
Pricing Offerings
ConnectWise Automate
Datadog
Elastic Observability
Free Trial
Yes
Yes
No
Free/Freemium Version
No
Yes
No
Premium Consulting/Integration Services
No
No
No
Entry-level Setup Fee
No setup fee
Optional
No setup fee
Additional Details
—
Discount available for annual pricing. Multi-Year/Volume discounts available (500+ hosts/mo).
I use Datadog because it concentrates all these features into a single tool, facilitating the learning curve that my platform and development engineering team needs in order to be able to set up the monitors/alerts/SLIs/SLOs as well as to diagnose a production issue. Its easier …
Elastic observability has a lot of features and good customer support. And Overall cost is good. Product functionality and performance are good but have some charting issues. But it is good. Elastic observability has a product roadmap and future vision. And it also has a good …
I recommend it to all IT colleagues; regardless of the size of the PCs with which you work most of the time, the application allows connection stability between computers that make it possible to continue working or taking care of the infrastructure from afar.
Datadog may be better suited for teams that have a more out-of-the-box infrastructure, on the primary platforms Datadog supports. You may also have better results if you have a bigger team dedicated to devops and/or a bigger budget. We found that trying to adapt it to our use case (small team, .NET on AWS Fargate) wasn't feasible. We continually ran into roadblocks that required us to dig through documentation (and at times, having to figure out some documentation was wrong), go back and forth with support, and in my opinion, waste money on excessive and unintended usages due to opaque pricing models and inaccurate usage reports, as well as broken/non-functional rate sampling controls.
We can use this Elastic Observability in our business problems such as Creating internal/operational efficiencies issues, customer relations/service, and business process outcomes issues. This product has a lot of features for the above problems. But this product may be having some issues when charting purposes. But it can adjust for that purpose.
The thing which Datadog does really well, one of them are its broad range of services integrations and features which makes it one step observability solution for all. We can monitor all types of our application, infrastructure, hosts, databases etc with Datadog.
Its custom dashboard feature which helps us to visualize the data in a better way . It supports different types of charts through those charts we can create our dashboard more attractive.
Its AI powered alerting capability though that we can easily identify the root cause and also it has a low noise alerting capability which means it correlated the similar type of issues.
They have conflicting scheduling paradigms. When scheduling patching for clients, the 1st Friday is interpreted as the very first Friday of the month, even if this is the 1st of the month. For scripting, the 1st Friday of the month is interpreted as the 1st Friday of the 1st FULL WEEK of the month. This makes no sense to have two different interpretations, and makes it unreliable to schedule recurring scripts to fall when recurring maintenance does. The scripts need to be done manually because of this.
There is no way to dictate reboot orders for patch policies. This tied directly in with my first point. We have some clients that require reboot orders. This is not possible without having different patch policies for each server and specifying a time this way. But, there aren't small enough increments of time to make this reliable, plus patching duration might vary. Excluding reboots with patching and scheduling reboot scripts fixes this. However, this can't be done once on a recurring schedule due to the different scheduling paradigms already discussed. We have to schedule these manually each month.
Alert windows cause lag in notifications (e.g. if the alert window is X errors in 1 hour, we won't get alerted until the end of the 1 hour range)
I would appreciate more supportive examples for how to filter and view metrics in the explorer
I would like a more clear interface for metrics that are missing in a time frame, rather than only showing tags/etc. for metrics that were collected within the currently viewed time frame
The primary reason for this rating is that ConnectWise Automate is currently so integral to our operations that moving away would involve more man hours than we would realistically have to invest. However, ConnectWise Automate is also completely capable of meeting all of our business needs and customizable to the point where if something is not meeting those needs out of the box, it can be modified to do what we want. From only installing software on machines if a different software package exists, to push a new version of that software is available, to check if credentials for user/machine have been updated to our new standards and then updating them if they have not, ConnectWise Automate is capable of doing everything we ask of it.
Basic use of the product is fairly easy. Information about the machines you manage can be found in customizable dashboards, which can be unique for each user, and, therefore, properly suited to the users' needs/job function. This is not a 10 because some of the interfaces are very clunky (Patch Management), and some features are not intuitive and not well documented (reporting). Scripting and Patch Management have a fairly steep learning curve (For structure in patch management and syntax in scripting), but once learned, they work well.
There are so many features that it can be hard to figure out where you need to go for your own use case. For example, RUM monitoring us buried in a "Digital Experience" sidebar setting when this is one of our key use cases that I sometimes struggle to find in the application. It appears that ECS + Fargate monitoring was recently released which is great because we had to build a lambda reporting solution for ephemeral task monitoring. But this new feature was never on my radar until I starting clicking around the application.
It used to be great, but then they broke reporting, speed and responsiveness with version 11 and the new Patch Manager. It's really bad and their support people are way behind on fixing so many bugs. They have really gone downhill. If they don't get it together soon, we'll start looking around.
ConnectWise Automate lets you manage more endpoints, with enhanced productivity and improved service, all without increasing expenses. It can manage patches and updates across thousands of computers. We also use it for customized monitoring and alerting on workstations and servers. Monitoring is really robust and granular. It does a great job of gathering a TON of data about the network, and that data is searchable. There are a bunch of different reports built in. Integrates with Manage, Control, and other applications. It does a ton of stuff out of the box, and has endless customization options.
The support team usually gets it right. We did have a rather complicate issue setting up monitoring on a domain controller. However, they are usually responsive and helpful over chat. The downside would be I don’t think they have any phone support. If that is important to you this might not be a good fit.
The Online training has been re-done and needs a lot more work. When you look at training in different roles, it shows a lot of the same topics but no explanation to what is different about them. Several times that topics are the exact same, but they make you re-take the same information for a different topic, instead of marking that you have already completed that portion of training.
Start small and learn the in's and out's before making policies and rolling things out company wide. Ask the questions of why if you don't agree with something or your company does things a different way. Usually they are done a certain way for a reason. Start simple with roll out and slowly enable or add on the functionality that is needed.
I believe the monitoring and alerts in Continuum command is better, but [ConnectWise Automate (formerly LabTech)] does have stronger scripting, and perhaps a better interface. N-Central is inferior on all fronts to both. I did not make the purchasing decision. I would myself likely pick Continuum if I had to make a on the spot choice.
Our logs are very important, and Datadog manages them exceptionally well. We frequently use Datadog services for our investigations. Use case: Monitor your apps, infrastructure, APIs, and user experience.
Key features:
Logs, metrics, and APM (Application Performance Monitoring)
Real-time alerting and dashboards
Supports Kubernetes, AWS, GCP, and other integrations
RUM (Real User Monitoring) and Synthetics
✅ Best for backend, server, and distributed systems monitoring.
Splunk is a very good product but the licensing costs are high; we utilise the best of both worlds by using both products for slightly different purposes. We put the voluminous data with simple use cases in Elastic where it doesn't cost too much and can be searched quickly while putting the less voluminous data with more complex use cases in Splunk so we can take advantage of Splunk's very comprehensive but often much slower SPL search query language
We found we were able to provide good monitoring of our customers sites which was an objective. However, that came at a significant time investment that never seemed to be finished.
We were able to negotiate a price that worked for us for an up-front purchase which was nice.
We found the pricing to be very competitive.
Bottom line for us was despite the pros of the product, we found other RMM solutions to be a better overall "value" due to not having to dedicate technicians to maintaining the product.