Chose Datadog
Datadog has reliable monitoring with deep insights and straightforward integrations.
| Product | Rating | Most Used By | Product Summary | Starting Price |
|---|---|---|---|---|
 Datadog | N/A | Datadog is a monitoring service for IT, Dev and Ops teams who write and run applications at scale, and want to turn the massive amounts of data produced by their apps, tools and services into actionable insight. | $18 per month per host | |
 IBM Cloudability | N/A | IBM Cloudability is a cloud cost management and optimization (FinOps) tool that enables IT, finance, and business teams to optimize their cloud spend across all cost sources, all maturity levels, and for all stakeholders. | N/A | |
 Zabbix | N/A | Zabbix is an open-source network performance monitoring software. It includes prebuilt official and community-developed templates for integrating with networks, applications, and endpoints, and can automate some monitoring processes. | N/A |
| Datadog | IBM Cloudability | Zabbix | ||||||||||||||||||||||
|---|---|---|---|---|---|---|---|---|---|---|---|---|---|---|---|---|---|---|---|---|---|---|---|---|
| Editions & Modules |
| No answers on this topic | No answers on this topic | |||||||||||||||||||||
| Offerings |
| |||||||||||||||||||||||
| Entry-level Setup Fee | Optional | No setup fee | No setup fee | |||||||||||||||||||||
| Additional Details | Discount available for annual pricing. Multi-Year/Volume discounts available (500+ hosts/mo). | — | — | |||||||||||||||||||||
| More Pricing Information | ||||||||||||||||||||||||
| Datadog | IBM Cloudability | Zabbix | |
|---|---|---|---|
| Considered Multiple Products |  Datadog  Deepshikha Gandhi DevOps Engineer Chose Datadog Datadog empowers us to create dashboards and visualize the state of our infrastructure in real time. It gives us control over what we want to view and how. The graphs provide deep insight into trends and anamoly detectives. These features are lacking in some of the other … |  IBM Cloudability |  Zabbix Chose Zabbix Zabbix was much better at handling traditional systems, and in ease of customization, both in the system itself, and customizing data sources, such as adding deep MySQL or JMX integrations. It's very good for organizing large-scale (hundreds or thousands of servers) systems; …  Eric O'Callaghan Linux Engineer Chose Zabbix I personally prefer Zabbix over any other monitoring software that I have ever tried. Zabbix is so customizable that if there is a feature I need, I can easily implement it. I can then add that feature to a template in no time and have it applied to hundreds, or even thousands, …  Josh Quint Lead AWS Systems Architect Chose Zabbix More extensive and customizable than SaaS solutions. Much less learning curve than Nagios. Cost is very much lower than SaaS monitoring especially at scales over 1000 hosts ($15,000/month for SaaS!!) Templating systems allows for easy management and monitoring of groups of …  Nishanthi Mohan DevOps Engineer Chose Zabbix Zabbix is cost effective maybe and certainly a good tool but not the best. The other ones have features that Zabbix is missing and we use couple of them. Deepshikha Gandhi DevOps Engineer Chose Zabbix |
| Datadog | IBM Cloudability | Zabbix | |
|---|---|---|---|
| Small Businesses |  InfluxDB Score 8.8 out of 10 | No answers on this topic |  ConnectWise Automate Score 8.4 out of 10 |
| Medium-sized Companies |  Sumo Logic Score 8.8 out of 10 |  IBM Turbonomic Score 8.8 out of 10 |  Icinga Score 8.9 out of 10 |
| Enterprises |  NetBrain Technologies Score 9.2 out of 10 |  vRealize Operations (discontinued) Score 9.1 out of 10 |  ScienceLogic SL1 Score 8.8 out of 10 |
| All Alternatives | View all alternatives | View all alternatives | View all alternatives |
| Datadog | IBM Cloudability | Zabbix | |
|---|---|---|---|
| Likelihood to Recommend | 9.4 (55 ratings) | 8.8 (135 ratings) | 8.3 (28 ratings) |
| Likelihood to Renew | - (0 ratings) | 8.0 (5 ratings) | 9.0 (3 ratings) |
| Usability | 9.2 (34 ratings) | 8.0 (135 ratings) | 8.6 (4 ratings) |
| Availability | - (0 ratings) | 6.4 (1 ratings) | - (0 ratings) |
| Performance | - (0 ratings) | 5.5 (1 ratings) | - (0 ratings) |
| Support Rating | 8.9 (6 ratings) | 2.3 (3 ratings) | 5.0 (5 ratings) |
| In-Person Training | - (0 ratings) | 1.0 (1 ratings) | - (0 ratings) |
| Online Training | - (0 ratings) | 7.3 (1 ratings) | - (0 ratings) |
| Implementation Rating | - (0 ratings) | 9.0 (1 ratings) | 8.0 (2 ratings) |
| Configurability | - (0 ratings) | 6.4 (1 ratings) | - (0 ratings) |
| Contract Terms and Pricing Model | - (0 ratings) | 6.4 (1 ratings) | - (0 ratings) |
| Ease of integration | - (0 ratings) | 7.3 (1 ratings) | - (0 ratings) |
| Product Scalability | - (0 ratings) | 6.4 (1 ratings) | - (0 ratings) |
| Professional Services | - (0 ratings) | 7.3 (1 ratings) | - (0 ratings) |
| Vendor post-sale | - (0 ratings) | 7.3 (1 ratings) | - (0 ratings) |
| Vendor pre-sale | - (0 ratings) | 7.3 (1 ratings) | - (0 ratings) |
| Datadog | IBM Cloudability | Zabbix | |
|---|---|---|---|
| Likelihood to Recommend | Datadog
| Apptio an IBM Company
| Zabbix
|
| Pros | Datadog
| Apptio an IBM Company
| Zabbix
 Thomas Higgins Infrastructure Engineer |
| Cons | Datadog
| Apptio an IBM Company
| Zabbix
 Asad Khan Technical CARE Specialist |
| Likelihood to Renew | Datadog
| Apptio an IBM Company
 Saurav Vaish Cloud Engineer | Zabbix
Thomas Higgins Infrastructure Engineer |
| Usability | Datadog
 Jeffrey van Santen Sr SWE | Apptio an IBM Company
| Zabbix
|
| Reliability and Availability | Datadog No answers on this topic | Apptio an IBM Company
 David James Chiswell Public Cloud Engineer | Zabbix No answers on this topic |
| Performance | Datadog No answers on this topic | Apptio an IBM Company
David James Chiswell Public Cloud Engineer | Zabbix No answers on this topic |
| Support Rating | Datadog
| Apptio an IBM Company
| Zabbix
|
| Online Training | Datadog No answers on this topic | Apptio an IBM Company
David James Chiswell Public Cloud Engineer | Zabbix No answers on this topic |
| Implementation Rating | Datadog
| Apptio an IBM Company
| Zabbix
Thomas Higgins Infrastructure Engineer |
| Alternatives Considered | Datadog
| Apptio an IBM Company
 Shankarabanda Raghava LEAD CLOUD ENGINEER | Zabbix
|
| Contract Terms and Pricing Model | Datadog No answers on this topic | Apptio an IBM Company
David James Chiswell Public Cloud Engineer | Zabbix No answers on this topic |
| Scalability | Datadog No answers on this topic | Apptio an IBM Company
David James Chiswell Public Cloud Engineer | Zabbix No answers on this topic |
| Return on Investment | Datadog
| Apptio an IBM Company
| Zabbix
|
| ScreenShots | Datadog Screenshots      | IBM Cloudability Screenshots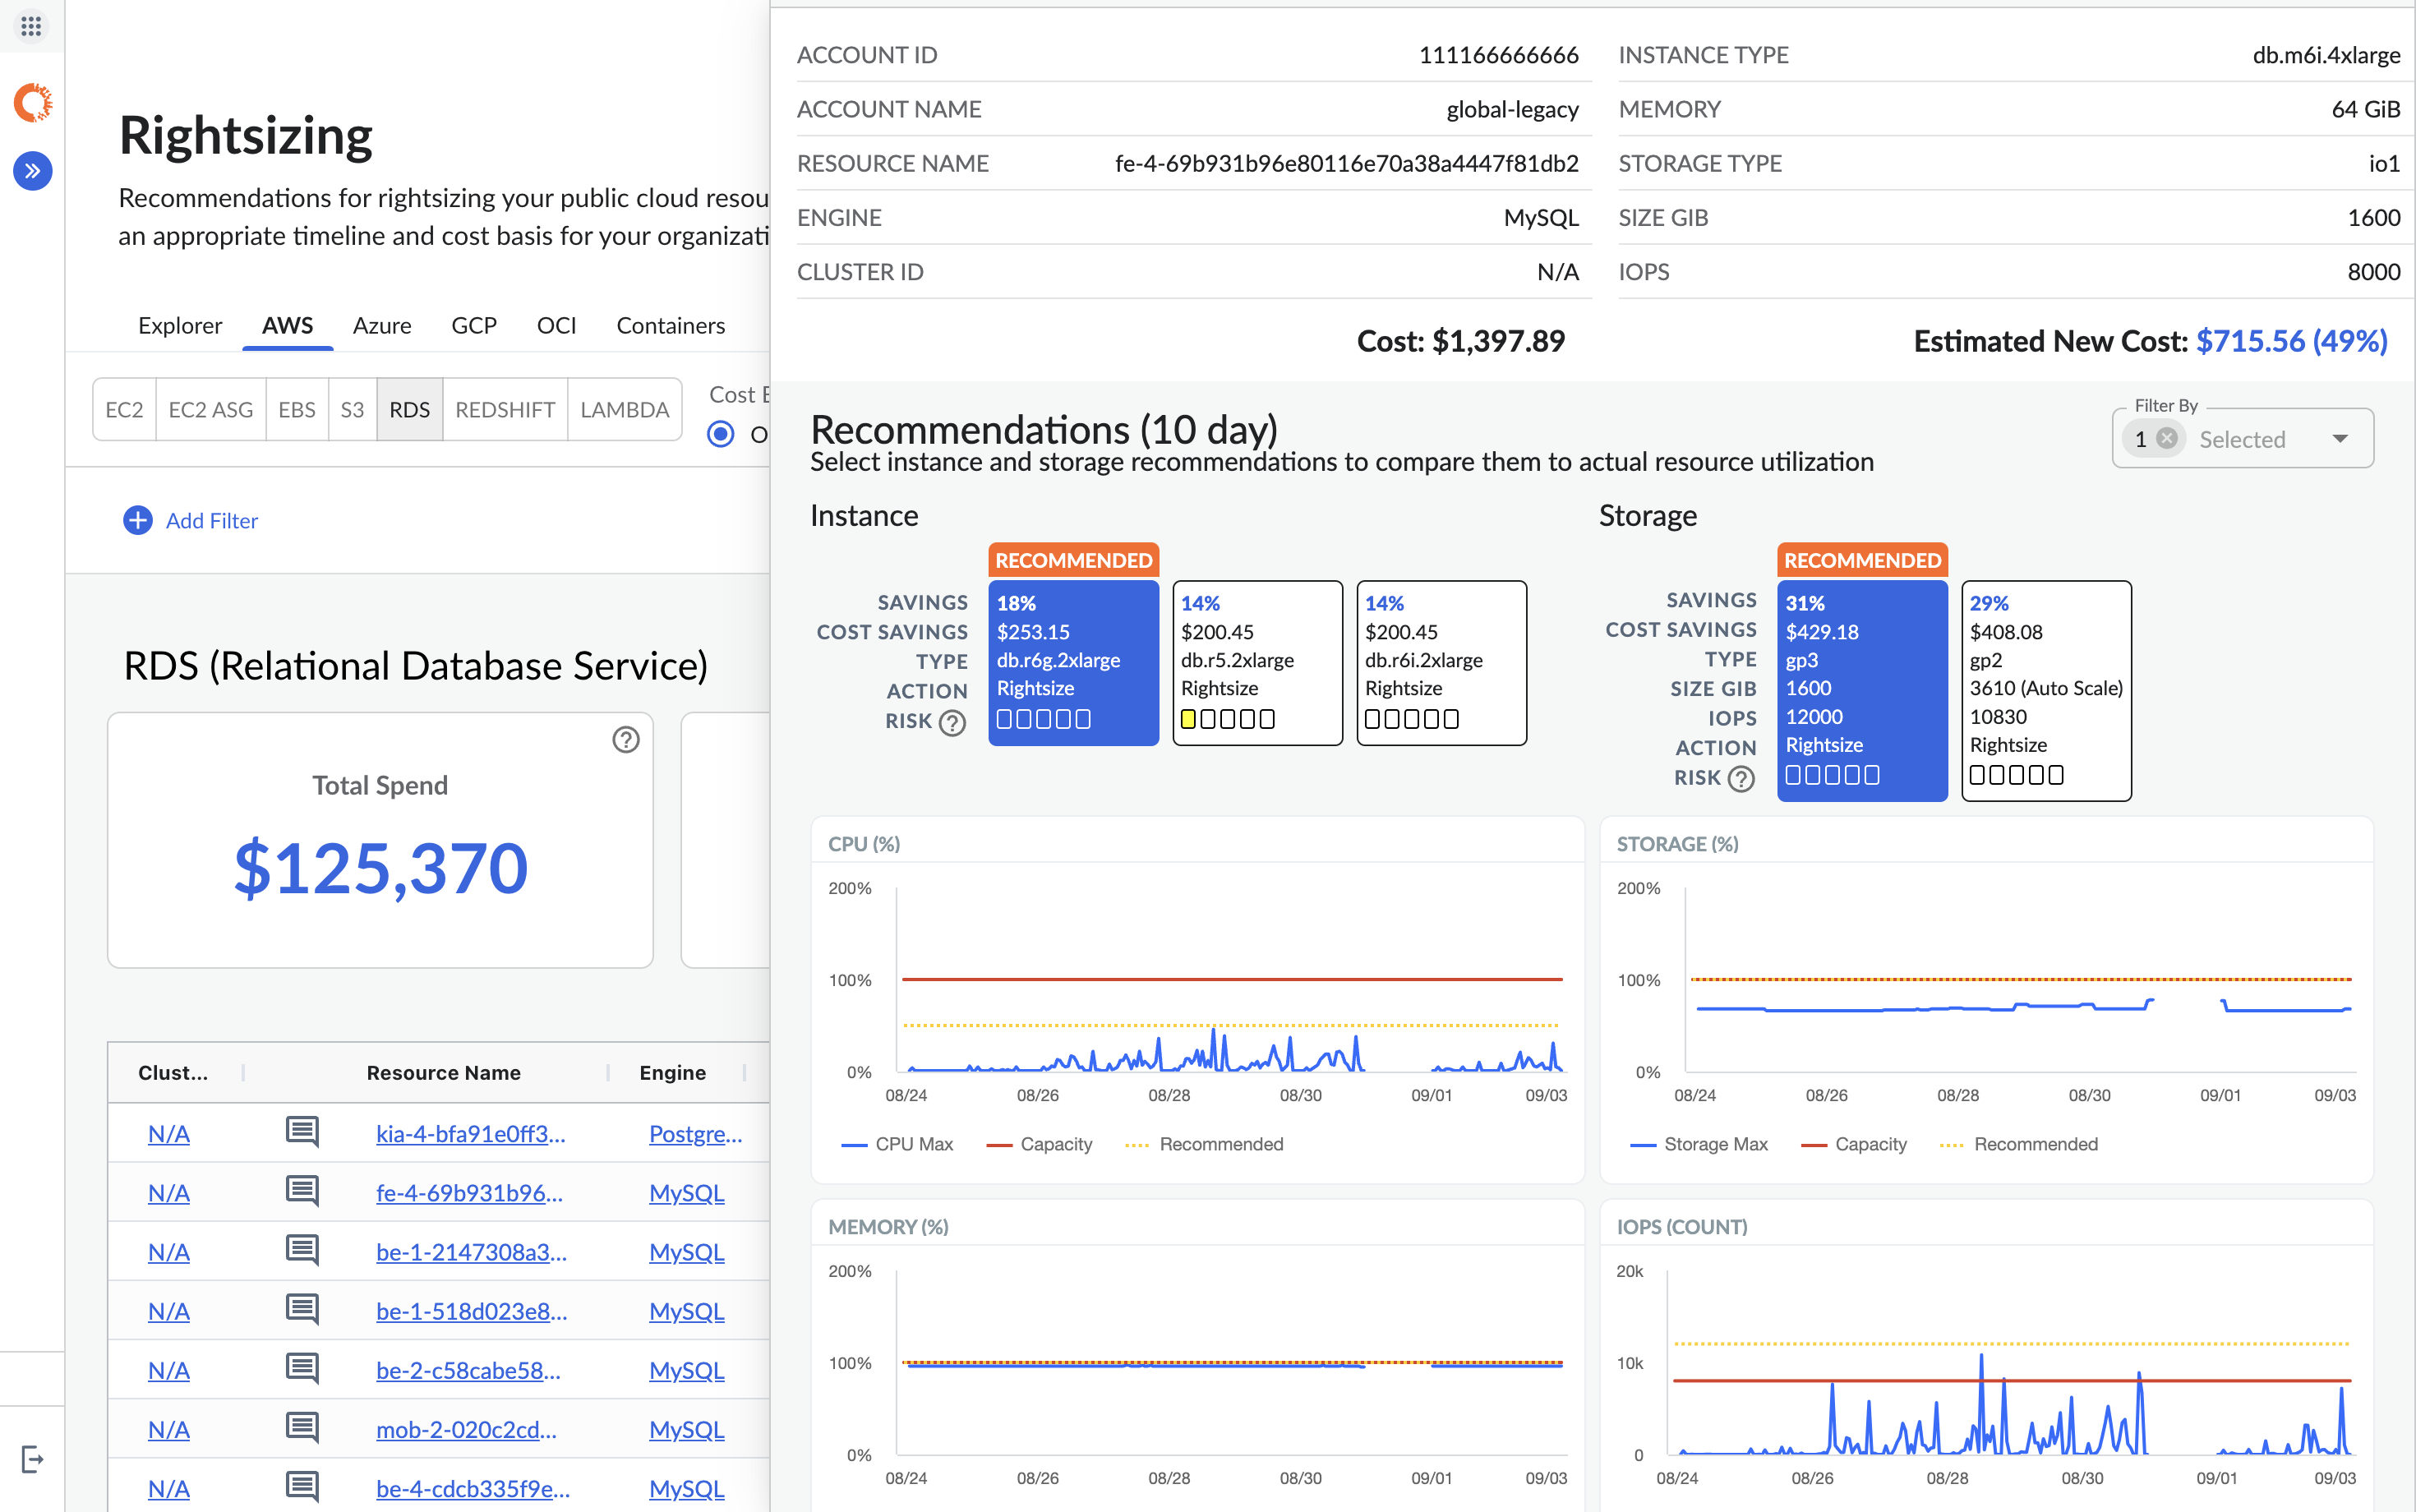 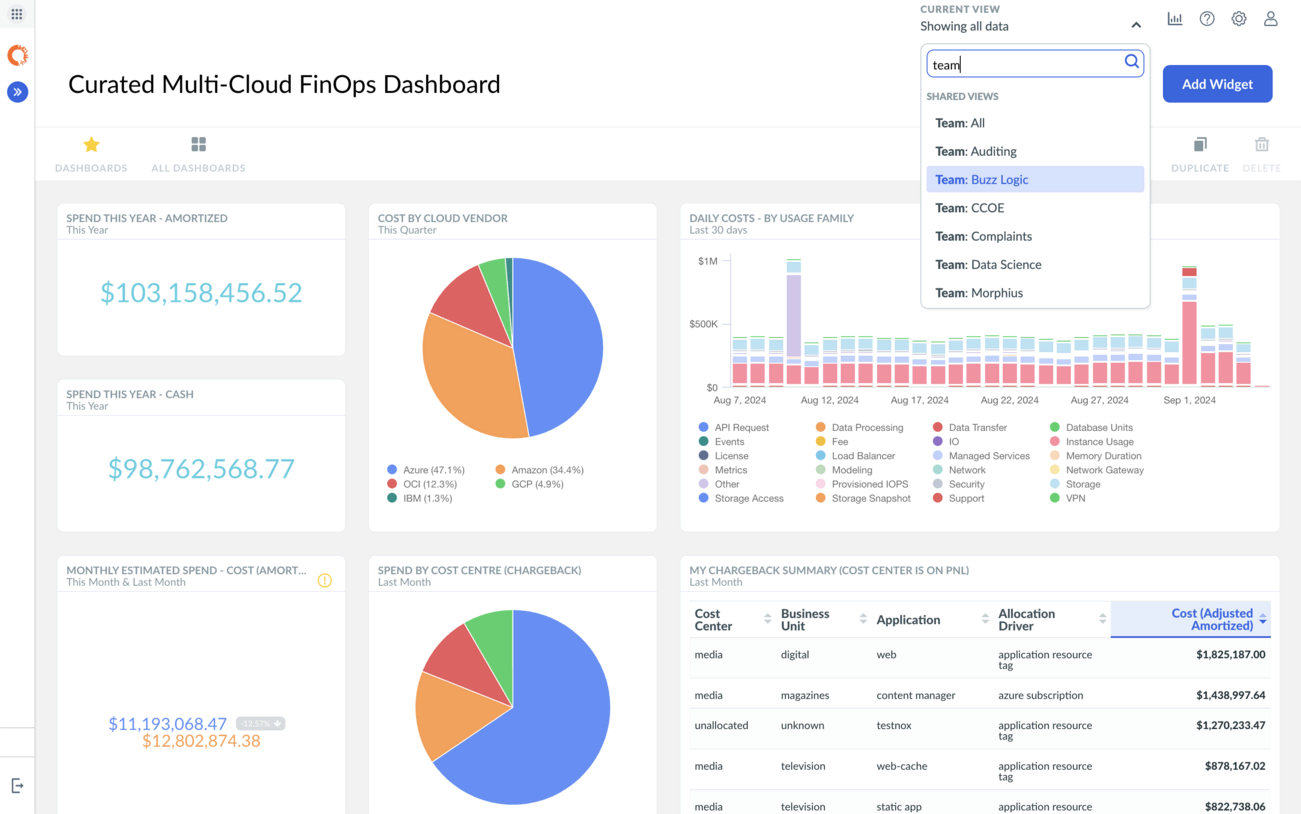 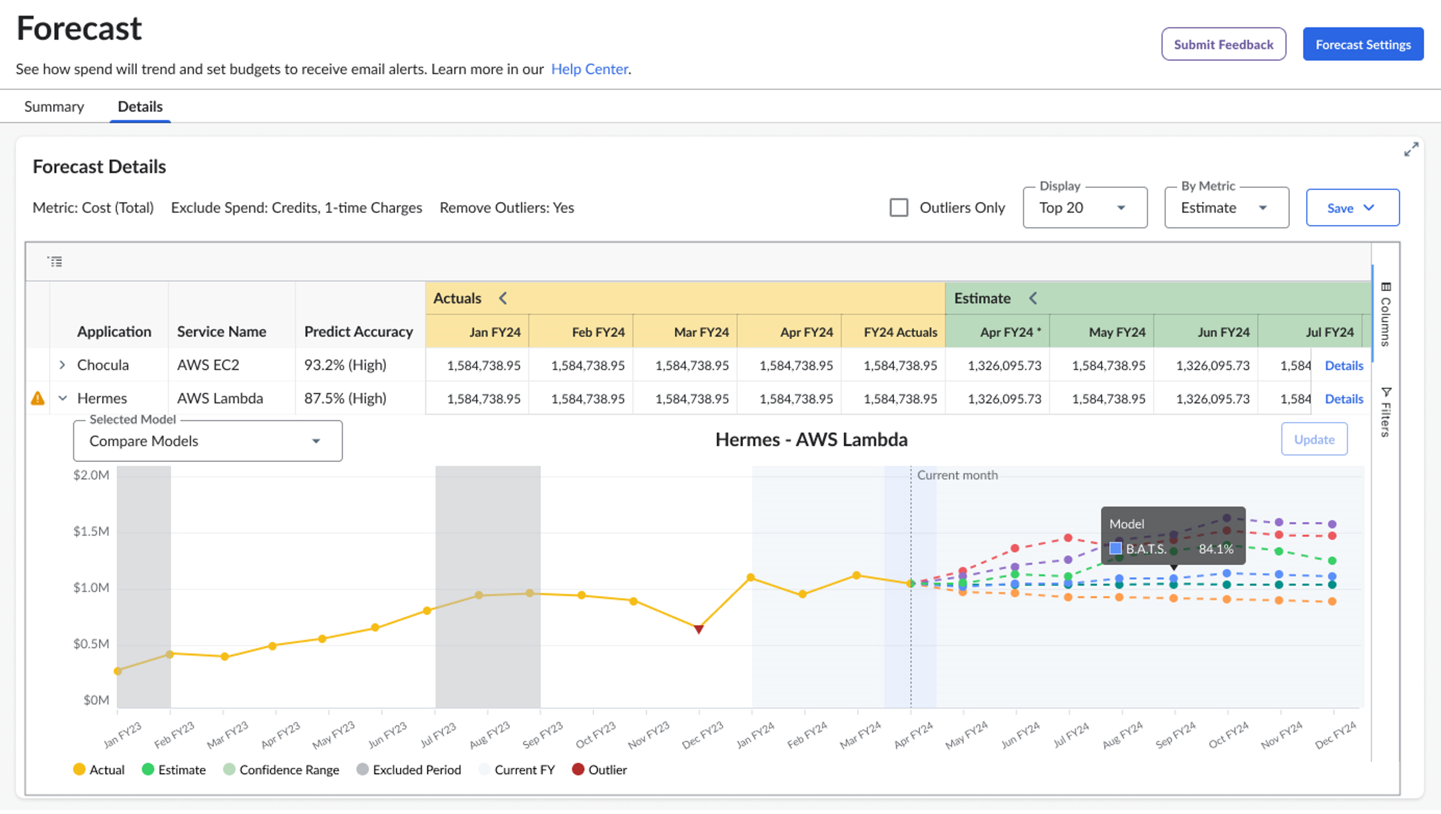 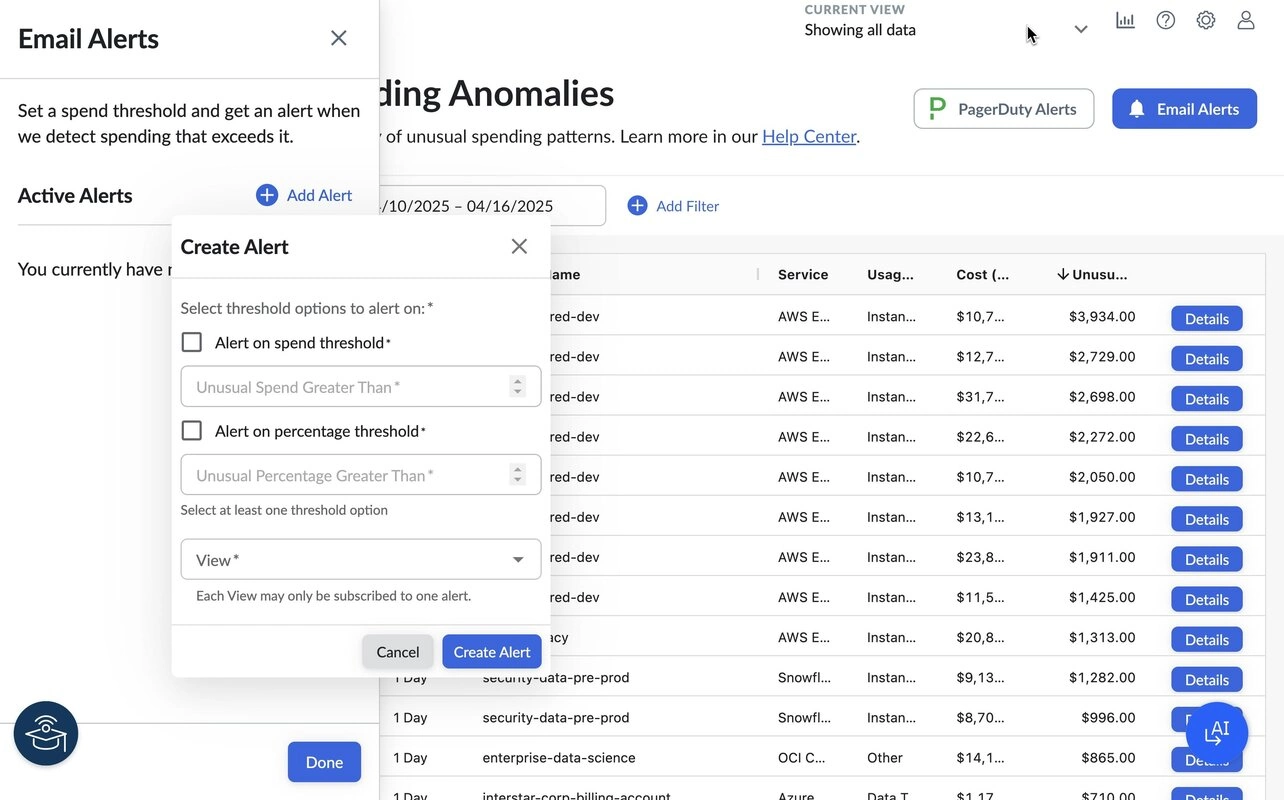 |
