Chose SolarWinds Server & Application Monitor
Datadog vs. SolarWinds Server & Application Monitor
Datadog vs. SolarWinds Server & Application Monitor
| Product | Rating | Most Used By | Product Summary | Starting Price |
|---|---|---|---|---|
 Datadog | N/A | Datadog is a monitoring service for IT, Dev and Ops teams who write and run applications at scale, and want to turn the massive amounts of data produced by their apps, tools and services into actionable insight. | $18 per month per host | |
 SolarWinds Server & Application Monitor | N/A | SolarWinds Server & Application Monitor (SAM) delivers application and server monitoring capabilities. SAM allows for self-service for easy setup, 1200+ monitoring templates, and customization options, as well as integrate with other SolarWinds products. | N/A |
| Datadog | SolarWinds Server & Application Monitor | |||||||||||||||
|---|---|---|---|---|---|---|---|---|---|---|---|---|---|---|---|---|
| Editions & Modules |
| No answers on this topic | ||||||||||||||
| Offerings |
| |||||||||||||||
| Entry-level Setup Fee | Optional | No setup fee | ||||||||||||||
| Additional Details | Discount available for annual pricing. Multi-Year/Volume discounts available (500+ hosts/mo). | SAM pricing starts at $2,995. | ||||||||||||||
| More Pricing Information | ||||||||||||||||
| Datadog | SolarWinds Server & Application Monitor | |
|---|---|---|
| Considered Both Products |  Datadog No answer on this topic | SolarWinds Server & Application Monitor  Nikhil Kumar Sharma Associate Consultant Chose SolarWinds Server & Application Monitor Solarwinds Server and Application monitor is my first choice of tools preferred for server and application infrastructure monitoring because of the following reasons - 1. Single product to offer on-prem, hosted, cloud monitoring 2. Single Product to offer Server, Database and …  Eric Broz System Administrator Chose SolarWinds Server & Application Monitor SolarWinds was easier to install and configure and their pricing model was much more flexible for how our on-demand services utilize the hardware. SolarWinds gave us what we were looking for for our environment at about the price we wanted to pay. |
| Datadog | SolarWinds Server & Application Monitor | |||||||||||||||||||||||||||||||||||||||
|---|---|---|---|---|---|---|---|---|---|---|---|---|---|---|---|---|---|---|---|---|---|---|---|---|---|---|---|---|---|---|---|---|---|---|---|---|---|---|---|---|
| Application Performance Management |
|
| Datadog | SolarWinds Server & Application Monitor | |
|---|---|---|
| Small Businesses |  InfluxDB Score 8.8 out of 10 |  GitLab Score 8.8 out of 10 |
| Medium-sized Companies |  Sumo Logic Score 8.8 out of 10 |  ManageEngine Site24x7 Score 9.5 out of 10 |
| Enterprises |  NetBrain Technologies Score 9.2 out of 10 | ManageEngine Site24x7 Score 9.5 out of 10 |
| All Alternatives | View all alternatives | View all alternatives |
| Datadog | SolarWinds Server & Application Monitor | |
|---|---|---|
| Likelihood to Recommend | 9.4 (55 ratings) | 8.8 (278 ratings) |
| Likelihood to Renew | - (0 ratings) | 8.9 (10 ratings) |
| Usability | 9.2 (34 ratings) | 8.6 (29 ratings) |
| Availability | - (0 ratings) | 9.9 (3 ratings) |
| Performance | - (0 ratings) | 6.0 (3 ratings) |
| Support Rating | 8.9 (6 ratings) | 9.0 (21 ratings) |
| Online Training | - (0 ratings) | 4.5 (1 ratings) |
| Implementation Rating | - (0 ratings) | 4.5 (3 ratings) |
| Configurability | - (0 ratings) | 1.0 (2 ratings) |
| Ease of integration | - (0 ratings) | 4.5 (2 ratings) |
| Product Scalability | - (0 ratings) | 9.9 (3 ratings) |
| Vendor post-sale | - (0 ratings) | 4.5 (2 ratings) |
| Vendor pre-sale | - (0 ratings) | 4.5 (2 ratings) |
| Datadog | SolarWinds Server & Application Monitor | |
|---|---|---|
| Likelihood to Recommend | Datadog
| SolarWinds
|
| Pros | Datadog
| SolarWinds
|
| Cons | Datadog
| SolarWinds
|
| Likelihood to Renew | Datadog
| SolarWinds
 Derek Benson IT, Network Administrator |
| Usability | Datadog
 Jeffrey van Santen Sr SWE | SolarWinds
|
| Reliability and Availability | Datadog No answers on this topic | SolarWinds
|
| Performance | Datadog No answers on this topic | SolarWinds
|
| Support Rating | Datadog
| SolarWinds
 Ryhlen Schoeberl System Administrator |
| Online Training | Datadog No answers on this topic | SolarWinds
 Joe Parlett Programmer Analyst |
| Implementation Rating | Datadog
| SolarWinds
|
| Alternatives Considered | Datadog
| SolarWinds
|
| Scalability | Datadog No answers on this topic | SolarWinds
Joe Parlett Programmer Analyst |
| Return on Investment | Datadog
| SolarWinds
|
| ScreenShots | Datadog Screenshots      | SolarWinds Server & Application Monitor Screenshots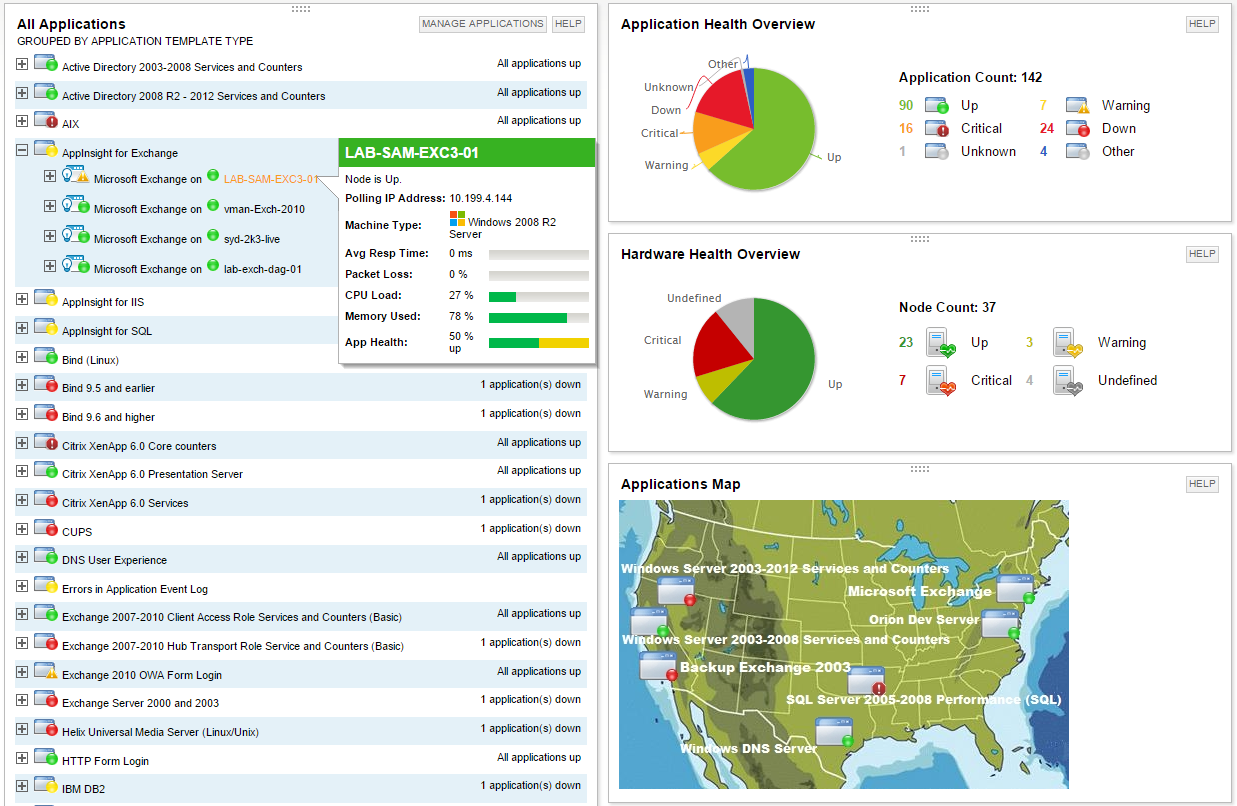      |