erwin Data Modeler vs. Looker
erwin Data Modeler vs. Looker
| Product | Rating | Most Used By | Product Summary | Starting Price |
|---|---|---|---|---|
 erwin Data Modeler | N/A | erwin Data Modeler by Quest is a data modeling tool used to find, visualize, design, deploy and standardize high-quality enterprise data assets. It can discover and document any data from anywhere for consistency, clarity and artifact reuse across large-scale data integration, master data management, metadata management, Big Data, business intelligence and analytics initiatives, accomplishing this whil esupporting data governance and intelligence efforts. | N/A | |
 Looker | N/A | Looker is a BI application with an analytics-oriented application server that sits on top of relational data stores. It includes an end-user interface for exploring data, a reusable development paradigm for data discovery, and an API for supporting data in other systems. | N/A |
| erwin Data Modeler | Looker | |||||||||||||||
|---|---|---|---|---|---|---|---|---|---|---|---|---|---|---|---|---|
| Editions & Modules | No answers on this topic | No answers on this topic | ||||||||||||||
| Offerings |
| |||||||||||||||
| Entry-level Setup Fee | Optional | Required | ||||||||||||||
| Additional Details | — | Must contact sales team for pricing. | ||||||||||||||
| More Pricing Information | ||||||||||||||||
| erwin Data Modeler | Looker |
|---|
| erwin Data Modeler | Looker | |||||||||||||||
|---|---|---|---|---|---|---|---|---|---|---|---|---|---|---|---|---|
| BI Standard Reporting |
| |||||||||||||||
| Ad-hoc Reporting |
| |||||||||||||||
| Report Output and Scheduling |
| |||||||||||||||
| Data Discovery and Visualization |
| |||||||||||||||
| Access Control and Security |
| |||||||||||||||
| Mobile Capabilities |
|
| erwin Data Modeler | Looker | |
|---|---|---|
| Small Businesses |  Egnyte Score 9.5 out of 10 |  Yellowfin Score 8.6 out of 10 |
| Medium-sized Companies |  IBM InfoSphere Information Server Score 8.0 out of 10 |  Reveal Score 10.0 out of 10 |
| Enterprises | IBM InfoSphere Information Server Score 8.0 out of 10 |  Kyvos Semantic Layer Score 9.5 out of 10 |
| All Alternatives | View all alternatives | View all alternatives |
| erwin Data Modeler | Looker | |
|---|---|---|
| Likelihood to Recommend | 6.1 (7 ratings) | 8.2 (132 ratings) |
| Likelihood to Renew | - (0 ratings) | 9.2 (8 ratings) |
| Usability | 9.0 (2 ratings) | 8.8 (12 ratings) |
| Availability | - (0 ratings) | 10.0 (1 ratings) |
| Performance | - (0 ratings) | 6.0 (1 ratings) |
| Support Rating | 9.0 (3 ratings) | 8.8 (14 ratings) |
| Implementation Rating | - (0 ratings) | 10.0 (1 ratings) |
| Configurability | - (0 ratings) | 10.0 (1 ratings) |
| Contract Terms and Pricing Model | - (0 ratings) | 10.0 (1 ratings) |
| Ease of integration | - (0 ratings) | 10.0 (1 ratings) |
| Product Scalability | - (0 ratings) | 10.0 (1 ratings) |
| Professional Services | - (0 ratings) | 10.0 (1 ratings) |
| Vendor post-sale | - (0 ratings) | 10.0 (1 ratings) |
| Vendor pre-sale | - (0 ratings) | 10.0 (1 ratings) |
| erwin Data Modeler | Looker | |
|---|---|---|
| Likelihood to Recommend |  Quest Software
|  Google
 Daniel Dammerman Regional Sales Director |
| Pros | Quest Software
 Ravinder Gupta Senior Oracle Database Administrator | Google
|
| Cons | Quest Software
| Google
|
| Likelihood to Renew | Quest Software No answers on this topic | Google
|
| Usability | Quest Software
| Google
|
| Reliability and Availability | Quest Software No answers on this topic | Google
 David Mynář Head Of Online Marketing |
| Performance | Quest Software No answers on this topic | Google
David Mynář Head Of Online Marketing |
| Support Rating | Quest Software
| Google
 Anson Abraham Data Lord |
| Implementation Rating | Quest Software No answers on this topic | Google
David Mynář Head Of Online Marketing |
| Alternatives Considered | Quest Software
| Google
|
| Contract Terms and Pricing Model | Quest Software No answers on this topic | Google
David Mynář Head Of Online Marketing |
| Return on Investment | Quest Software
 Rina Falkovich Data Architect | Google
|
| ScreenShots | erwin Data Modeler Screenshots  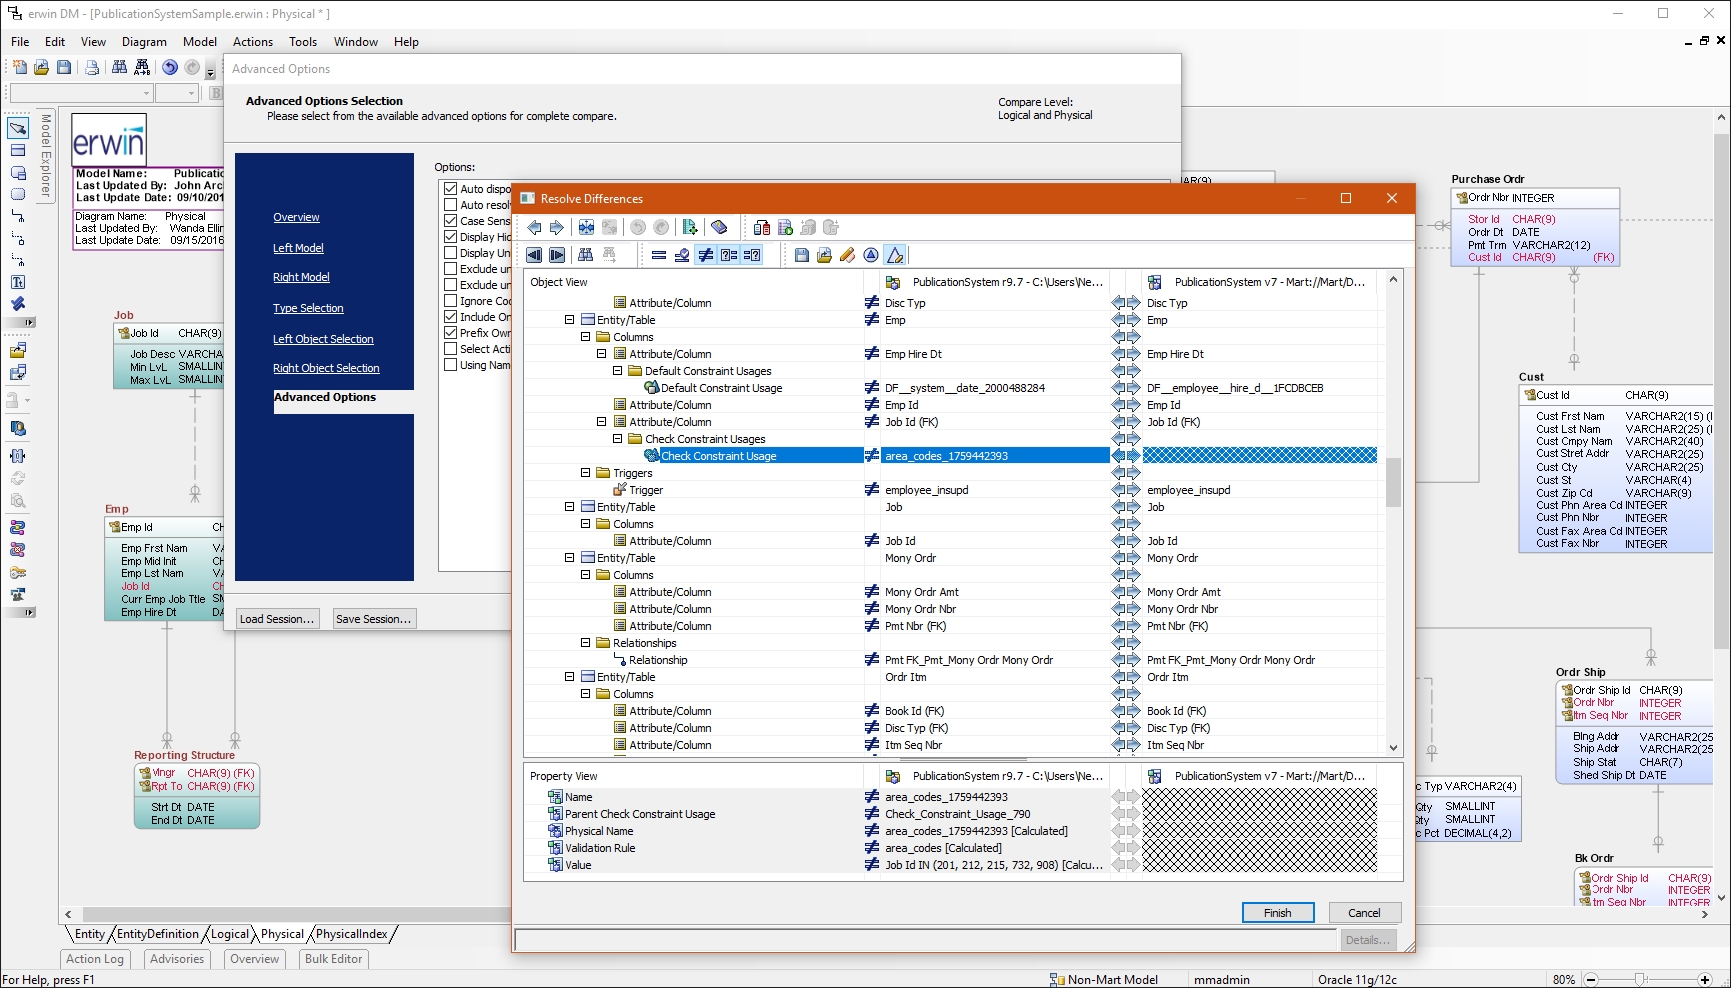 | Looker Screenshots |