Looker Studio is a data visualization platform that transforms data into meaningful presentations and dashboards with customized reporting tools.
$9
per month per user per project
ThoughtSpot
Score 8.5 out of 10
N/A
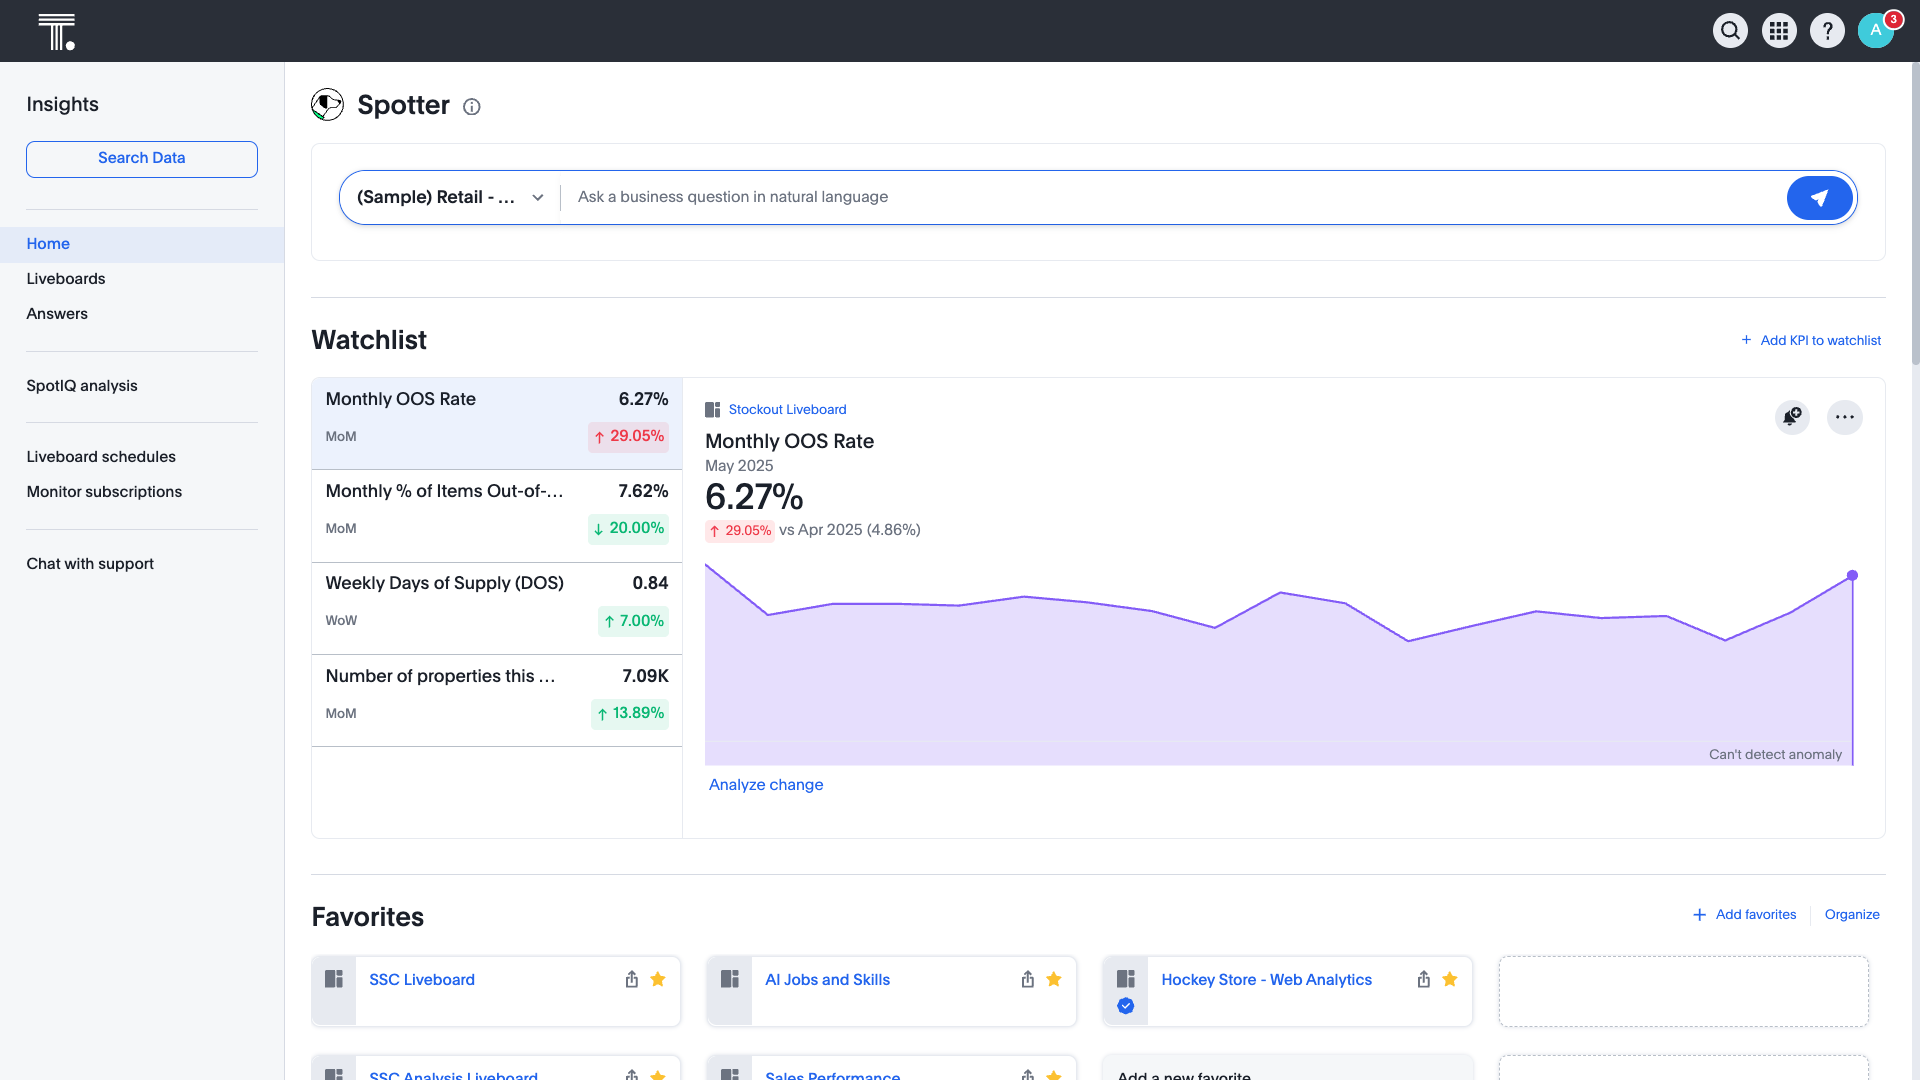
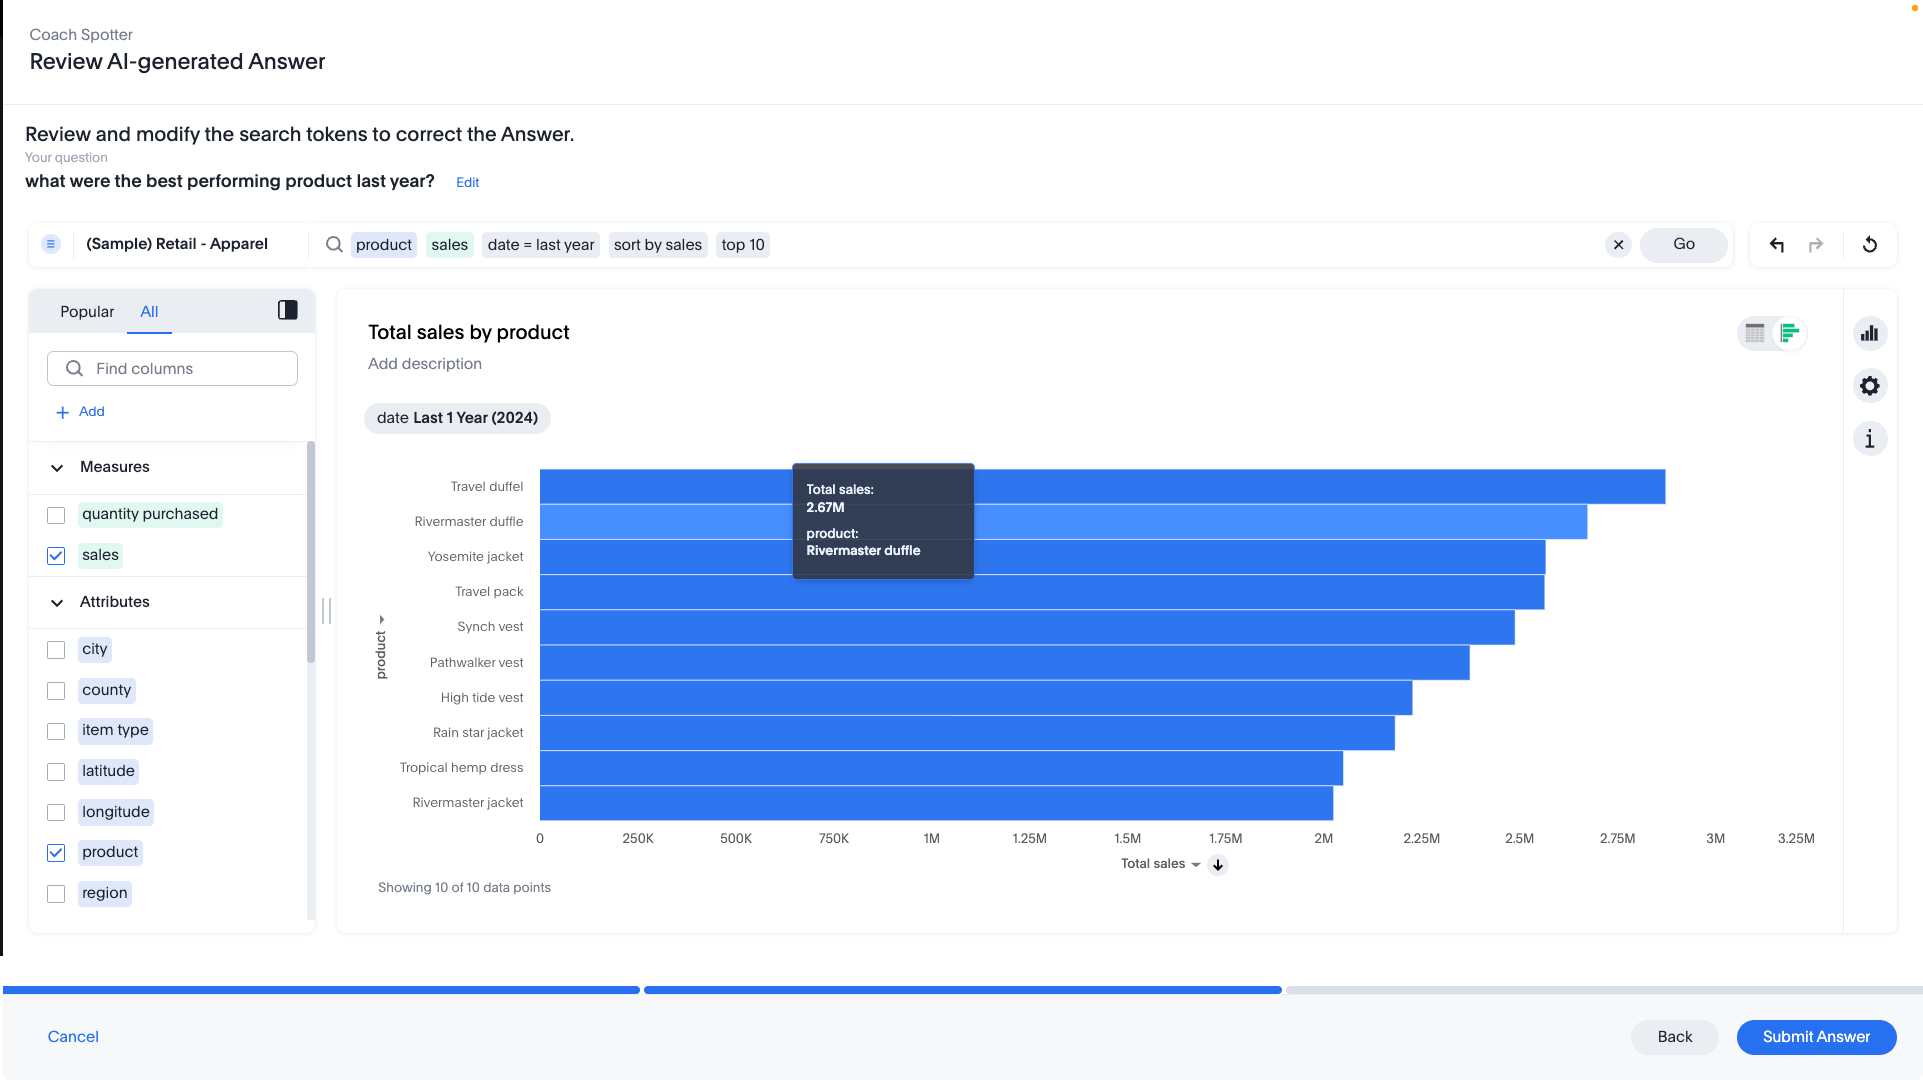
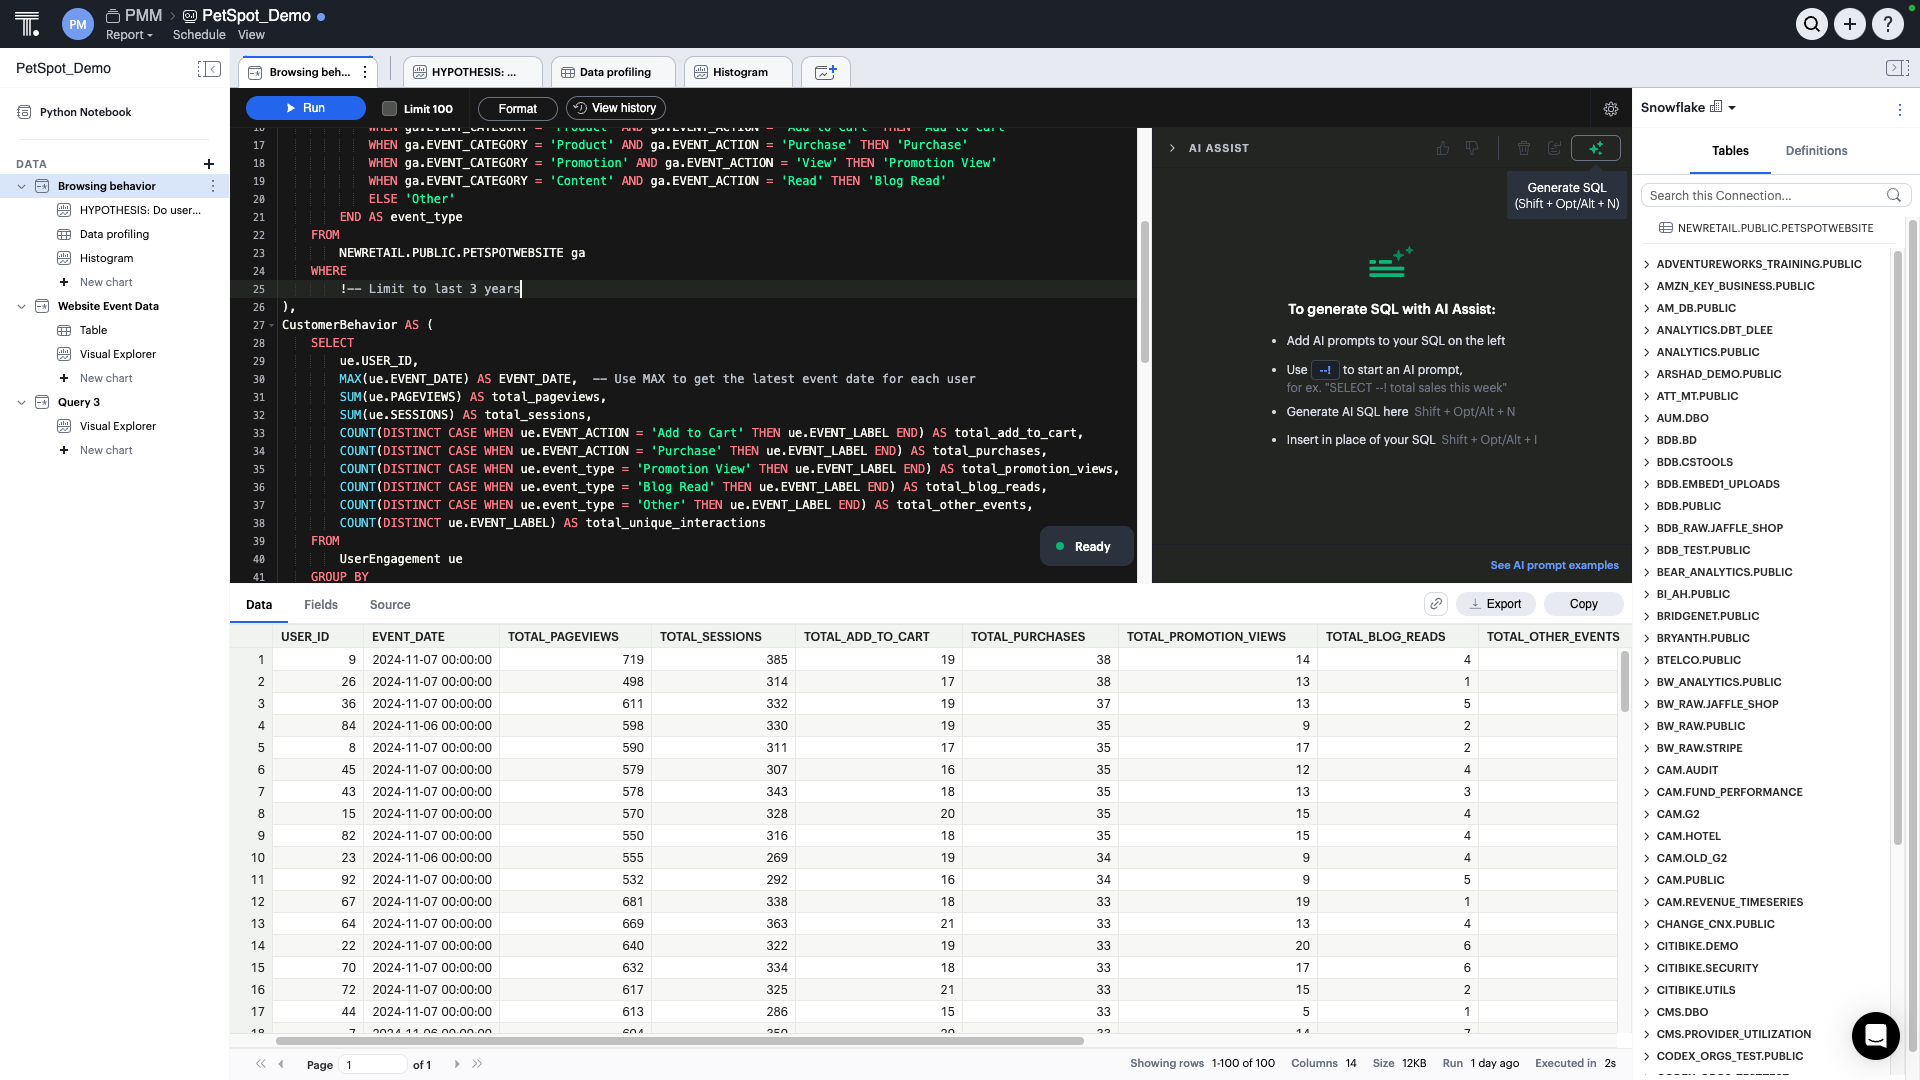
ThoughtSpot is an Agentic Analytics Platform for enterprises where users ask data questions using natural language and get answers with AI. Code-first for data teams and code-free for business users, ThoughtSpot can handle large, complex cloud data at scale.
$1,500
per year (5 users)
Pricing
Looker Studio
ThoughtSpot
Editions & Modules
Looker Studio Pro
$9
per month per user per project
Looker Studio
No charge
Thoughtspot Analytics - Pro
$50
per month (billed annually) per user (25-1000 users)
Thoughtspot Analytics - Enterprise
Custom
Offerings
Pricing Offerings
Looker Studio
ThoughtSpot
Free Trial
No
Yes
Free/Freemium Version
Yes
Yes
Premium Consulting/Integration Services
No
Yes
Entry-level Setup Fee
No setup fee
Optional
Additional Details
—
—
More Pricing Information
Community Pulse
Looker Studio
ThoughtSpot
Considered Both Products
Looker Studio
No answer on this topic
ThoughtSpot
Verified User
Manager
Chose ThoughtSpot
We selected ThoughtSpot with the promise that it would evolve into a Google search for business insights. To date, it has not gotten close in my opinion.
Visualizing cross-channel campaign performance can blend data from a few different sources to compare performance metrics like spend, clicks, and conversions side-by-side in a single view, which helps in quick budget reallocation decisions. When dealing with massive volumes of data (millions of rows) or highly complex queries, Looker Studio dashboards can become slow, laggy, or even crash. Performance issues are a frequent complaint when working with large datasets, making it unsuitable for enterprise-level companies
It is well suited when the same data is consumed by many different people with different analytics and visualization requirements because, if you have the data available in ThoughtSpot, every user can prepare different views. Also, it is a good reporting tool, you can get rid of slides if you have a good dashboard prepared, gaining flexibility and agility.
Breath of data - the number of ways to interrogate the data is endless, and the options to view metrics alongside each other make for comprehensive datasets.
Data visualisation and customisation - the options for presenting data and separating out across pages allow for clean visuals and segmented information.
Easy shareability/usability - a quick and simple tool to introduce colleagues to, and easy to grant access for them to be able to view the data, without having to understand the setup itself.
Beautiful visualizations. The visuals are distinct, clean, and easy to discern from one another.
Intelligent querying functionality. When looking to manipulate the data, the search function makes it easy to manipulate the features in the data, along with aggregating them in the way you'd like.
Embedding! It has been a smooth process thus far for our product & technical teams to work with ThoughtSpot and bring it into our product.
It needs better handling of complex logic. We often need workarounds to perform complex custom calculations, and it can be really unpleasant at times.
Felt it got slow with a larger data set, and in one minor report, we had to set up time filters so that calculations during spikes could be traced more quickly.
Compare to competition they need to improve with notification things.
It would be great if ThoughtSpot can add the feature to filter by clicking on visualizations. i.e if I click on a particular data point in the chart if the full dashboard can filter just for that particular data point.
Color coding the heatmap with different colors like green to orange to red.
It is the simplest and least expensive way for us to automate our reporting at this time. I like the ability to customize literally everything about each report, and the ability to send out reports automatically in emails. The only issue we have been having recently is a technical glitch in the automatic email report. Sadly, there is almost no support for this tool from Google, but is also free, so that is important to take into consideration
I give it just waiting because passport is brilliant and it has helped our organisation In advancing to the next stage in the age of AI. It has allowed or non-tech people to better service and clients in a cost-effective way. George port has allowed us to create new products for us and for our clients increasing our revenue streams and reducing clients churn
Looker Studio is easy to use, and it offers a sufficient variety of predefined visualizations to choose from. It's easy for us, and anyone can set up basic reporting without extensive data visualization skills. The interface layout is easy to understand, and it doesn't take long to get used to.
The rating is because of the ease of use of the interface as it has a no code interface that makes it easy to setup data pipelines without extensive programming. Cloud native integration: It integrates seamlessly with cloud based data warehouses. Automated data loading, Scalability, Cost Effective, Transformations, Data Governance and security.
I give it a lower support rating because it seems like our Dev team hasn't gotten the support they need to set up our database to connect. Seems like we hit a roadblock and the project got put on pause for dev. That sucks for me because it is harder to get the dev team to focus on it if they don't get the help they need to set it up.
I give it this meeting because the team is not only help able to help us in the current solutions but also amazing and taking feedback and feeding it back to their development team which includes more products and features into ThoughtSpot
Looker Studio is far easier to implement, stand up, and learn. The interface is simpler and user-friendly for various levels of data visualization/analysis knowledge and experience. The biggest benefit of Looker Studio, however, is its ease of connection to GA data and speed. Furthermore, since it is an online program/tool, it requires less CPU/battery/storage on the user's device.
We also explored Tableau Ask Data. Tableau is our standard for BI in our organization. We want to use the smallest amount of tools in our company to have the best adaption. ThoughSpot will fill a few gaps that we have with our current set up and will also enhance out offering for our employees in the transition of being more data driven within in near future
Because it is very reliable, inside the situation, we need strong internet connection to access a lot of data but easily never had any downtime except during the upgrades
Time to market ROI is massive vs hiring the full-time dedicated team to build and maintain a frontend multi-tenant SaaS data viz product.
It will be interesting to see over time how the advanced features play out in terms of usability and end value, such as Natural Search, which we are very excited about, and the machine learning tools.