Site24x7 from ManageEngine is a full-stack application, website, server, cloud and network monitoring tool. Site24x7 offers code-level diagnostics and customizable error thresholds, end-to-end monitoring with topology visualization tools, and mobile accessibility.
$9
10 monitors
Splunk Observability Cloud
Score 8.5 out of 10
N/A
Splunk Observability Cloud aims to enable operational agility and better customer experience through real-time AI-driven streaming analytics allowing accurate alerts in seconds. It is designed to shorten MTTD and MTTR by providing real-time visibility into cloud infrastructure and services.
$15
per month (billed annually) per host
Pricing
ManageEngine Site24x7
Splunk Observability Cloud
Editions & Modules
Starter
$9.00
10 monitors
Pro
$35.00
40 Monitors
Classic
$89.00
100 Monitors
Elite
$225.00
250 Monitors
Enterprise
$449.00
500 Monitors
Enterprise Plus Web
$899.00
2500 Monitors
Infrastructure
$15
per month (billed annually) per host
App & Infra
$60
per month (billed annually) per host
End-to-End
$75
per month (billed annually) per host
Offerings
Pricing Offerings
ManageEngine Site24x7
Splunk Observability Cloud
Free Trial
Yes
Yes
Free/Freemium Version
Yes
No
Premium Consulting/Integration Services
No
No
Entry-level Setup Fee
$1 monitors
No setup fee
Additional Details
Each Pack will also support additional benefits such as Network interfaces, Applogs, Alert credits etc. You can also, purchase add-ons to create custom pricing options. Please visit the vendor's pricing page, for more information.
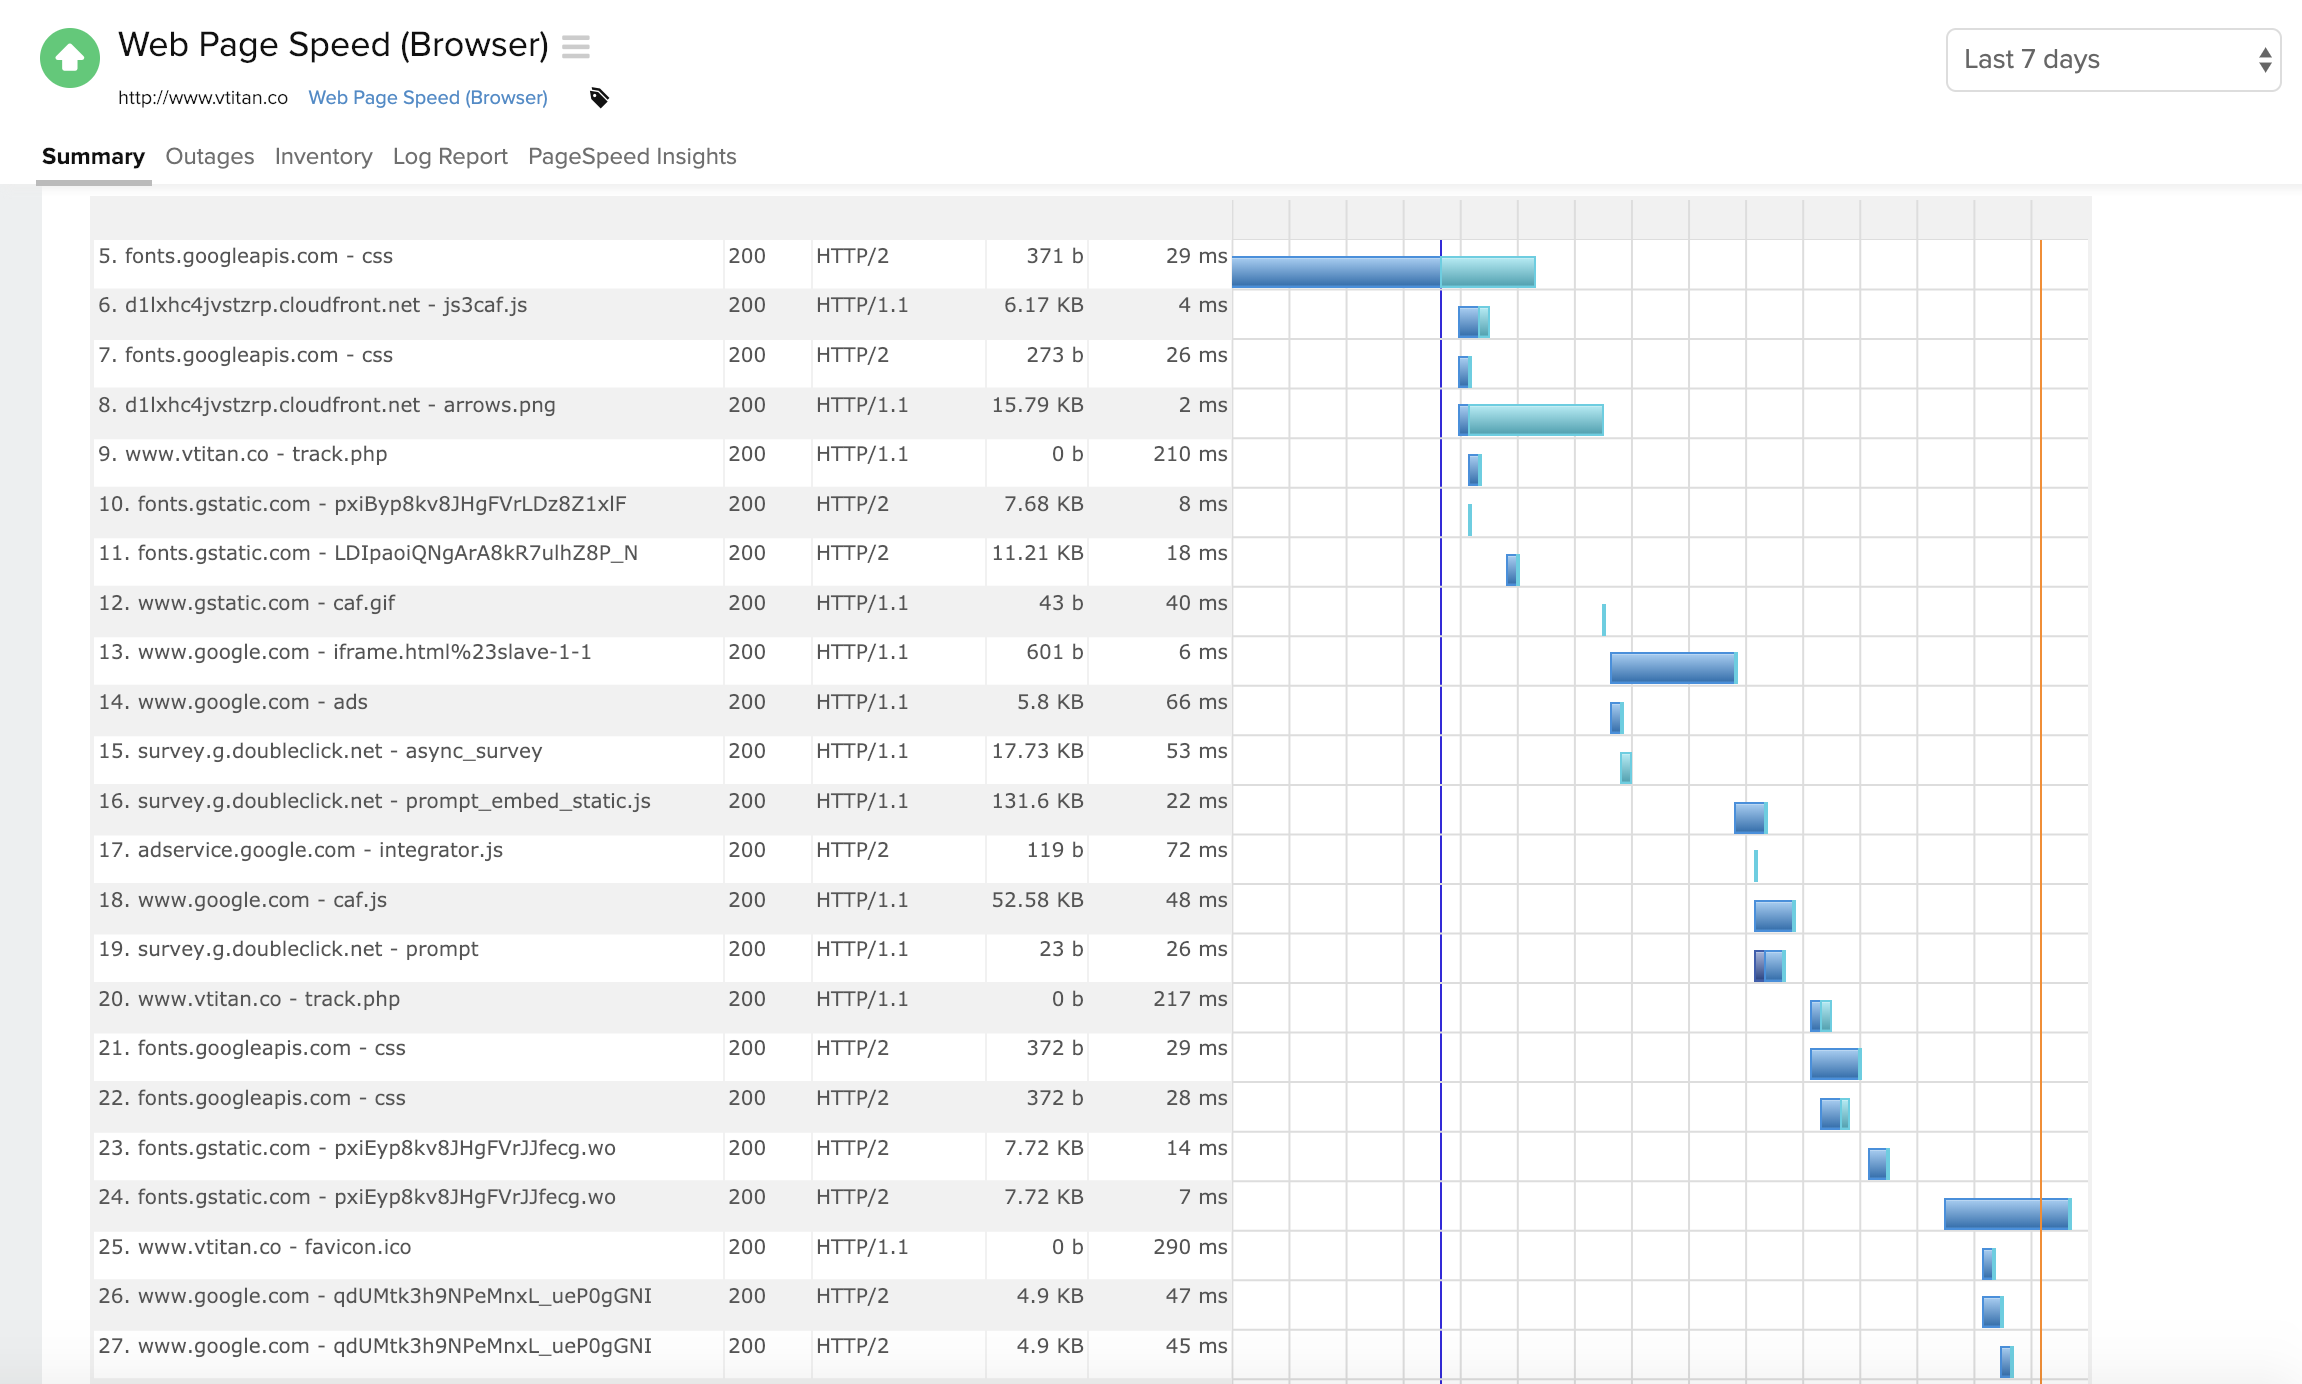
Site24x7 [All-in-One Monitoring] has some similarities to ThousandEyes. Especially in the troubleshooting aspect where both offer Web performance waterfall charts to analyze the issue better. Both have cloud-based servers globally that allow to determine performance on the …
Manage engine had OPs manager for alerting and security monitoring alerts, but is just not as robust an offering as [Site24x7 All-in-One Monitoring] (RUM.APM features etc..). Originally we had used Nagios on low, to no-cost linux platform, but Nagios will require license also, …
Initially, it came down to price. But, if you don't mind having a cloud monitoring solution (versus on-prem) then in my opinion Site24x7 is much easier to setup/manage/configure/use than other options I have managed in the past. Adding monitors takes seconds and I spend almost …
The biggest difference between Site24x7 and products like PRTG, Nagios, or Icinga, is that Site24x7 is hosted off the network, completely externally. The others do a great job on network alerts-- and some can even be configured to send SMS or phone calls with the right …
Each solution excels in their own areas. Site24x7 provides the easiest and most cost-effective transactional monitoring from the previous and existing solutions which we use. However, Solarwinds Orion suite, which includes the virtualization manager, gives us full-stack …
I haven't had a lot of experience evaluating Datadog but from the research and basic demo that we got I understand that it is significantly more expensive, but it does seem to have more AI features and can assist in predicting when/if applications or essential services may go …
site24x7 is really unique, I have been using it for many years and always recommend it in my classes. It is ideal for monitoring all web, apps, servers together in one place. Never let a website go down again.
I selected this [roduct because I needed something really quick to deploy and that we could easily integrate with our environment without having to deal with firewall setup and other stuff.
Simply put, Alertsite from Smartbear is a great product, with top-notch functionality. However, the cost of the platform when using multi-step transactions is incredibly pricey and the cost does not scale well when you want to increase your monitoring. Site24x7 alleviates the …
While Applications Manager and CA CEM can give a deep understanding of the services and applications, neither can compare with the shear speed at which Site24x7 can provide for the web performance of sites and how customer satisfaction is associated as well!!!
it could stack up against this version of Splunk because in this instance of having the cloud option as an available use case it furthermore has more use cases and the options for the data to always be readily available will furthermore allows for analysts to review the data in …
Datadog pushes intom proprietary ecosystem and pricing structure.Compared to self hosted prometheus and grafarna but it gave headache og managing our own monitoring infrastructure at scale.Prometheus is excellent for scraping cluster metrics but it doesnt handle distributed …
I guess scale is the main factor against grafana and ease of use against amazon elasticsearch service and also i have used signoz and ELK Stack also, but stability Splunk Observability Cloud gives is too good and also it comes with high avability and you have to maintain …
We initially chose Splunk Observability Cloud because it promised full-stack visibility and tighter integration. The other tools didn't offer this as part of the core package. Their analytics and real-time dashboards looked strong during the demo but it turned out to a lot …
I selected Splunk Observability Cloud because it focused so much on OTEL standards which will help us in future as OTEL is covering most of the observability standards. And also it has the best Kubernetes observability as I already explained it has several predefined dashboards …
Splunk Observability Cloud stood out for its real-time data ingestion, native OpenTelemetry support, and seamless correlation between metrics, traces, and logs, which gave us faster root cause analysis and better end-to-end visibility compared to Grafana setups that required …
To be honest, Datadog is very similar to Splunk and LogScale to a lesser degree, but it is just as good if you don't need too complex observability. Grafana is still growing and might reach the same level soon.
It's able to quickly detect and resolve issues across the entire spectrum of deployments including on-premises, public cloud, private cloud, hybrid cloud and multicloud
The above applications have their own use cases. Thousand Eyes or Sitescope is used for URL monitoring and Splunk is used for application monitoring. Appdynamics is also used for application monitoring and can monitor the server very well but it lacks when searching in logs …
Splunk is superior in many ways to these solutions when I'm comes to ingesting, storing, manipulating, and using data, but dynatraces automatic agents do make it much easier to use out of the box. Nagios seems much cheaper but does not provide as much functionality as Splunk. …
SQL is a great tool for smaller quick checks. When trying to monitor several different environments, applications, APIs, several thousand devices, connections, and technology, it just doesn't stand up to what you need. Splunk Infrastructure Monitoring has really stood out …
We are having other monitoring tools like AppDynamics, Dynatrace, Datadog and already using their end-user monitoring capability. Most of our customers are looking for agent-free monitoring where they don't want to instrument any agent on their client-side (as it might …
Splunk Infrastructure Monitoring provides far superior options for anybody using a complex hybrid multi-cloud environment and allows both your SOC and NOC to work together on the same data while driving their own insights.
We found other products are still in the old world view …
I have tried other tools (PRTG etc) in the past, and switched from US monitor to [Site24x7 All-in-One Monitoring], for all the built-in features and ability to implement by using with or without the agents deployed (ip discovery LAN). This is one tool that encompasses the entire organization and allows that single pane of glass feel (NOC screen view) for an accurate virtual snapshot of your entire organization, either cloud and/or LAN.
Good for below cases 1. There is a front end and need to correlate data with front end data 2. multiple microservices and need to check the health of each system 3. correlate data from various sources 4. Application performance is a key to be captured 5. application performance is a key metric.
Alerts: Site24x7 can be configured to send alerts in all sorts of ways, from email, to text messages, to even direct automated phone calls.
Internal monitoring: An agent installed on one or more machines can monitor internal connectivity to other network devices. This means if connectivity to a server goes down, we often know about it before users alert us.
External monitoring: Site24x7 also watched our websites and sends alerts if they're unreachable. It uses multiple locations to do so, which means if there's a partial network outage in some part of the country, we know who is affected.
The first one is its Kubernetes container monitoring.
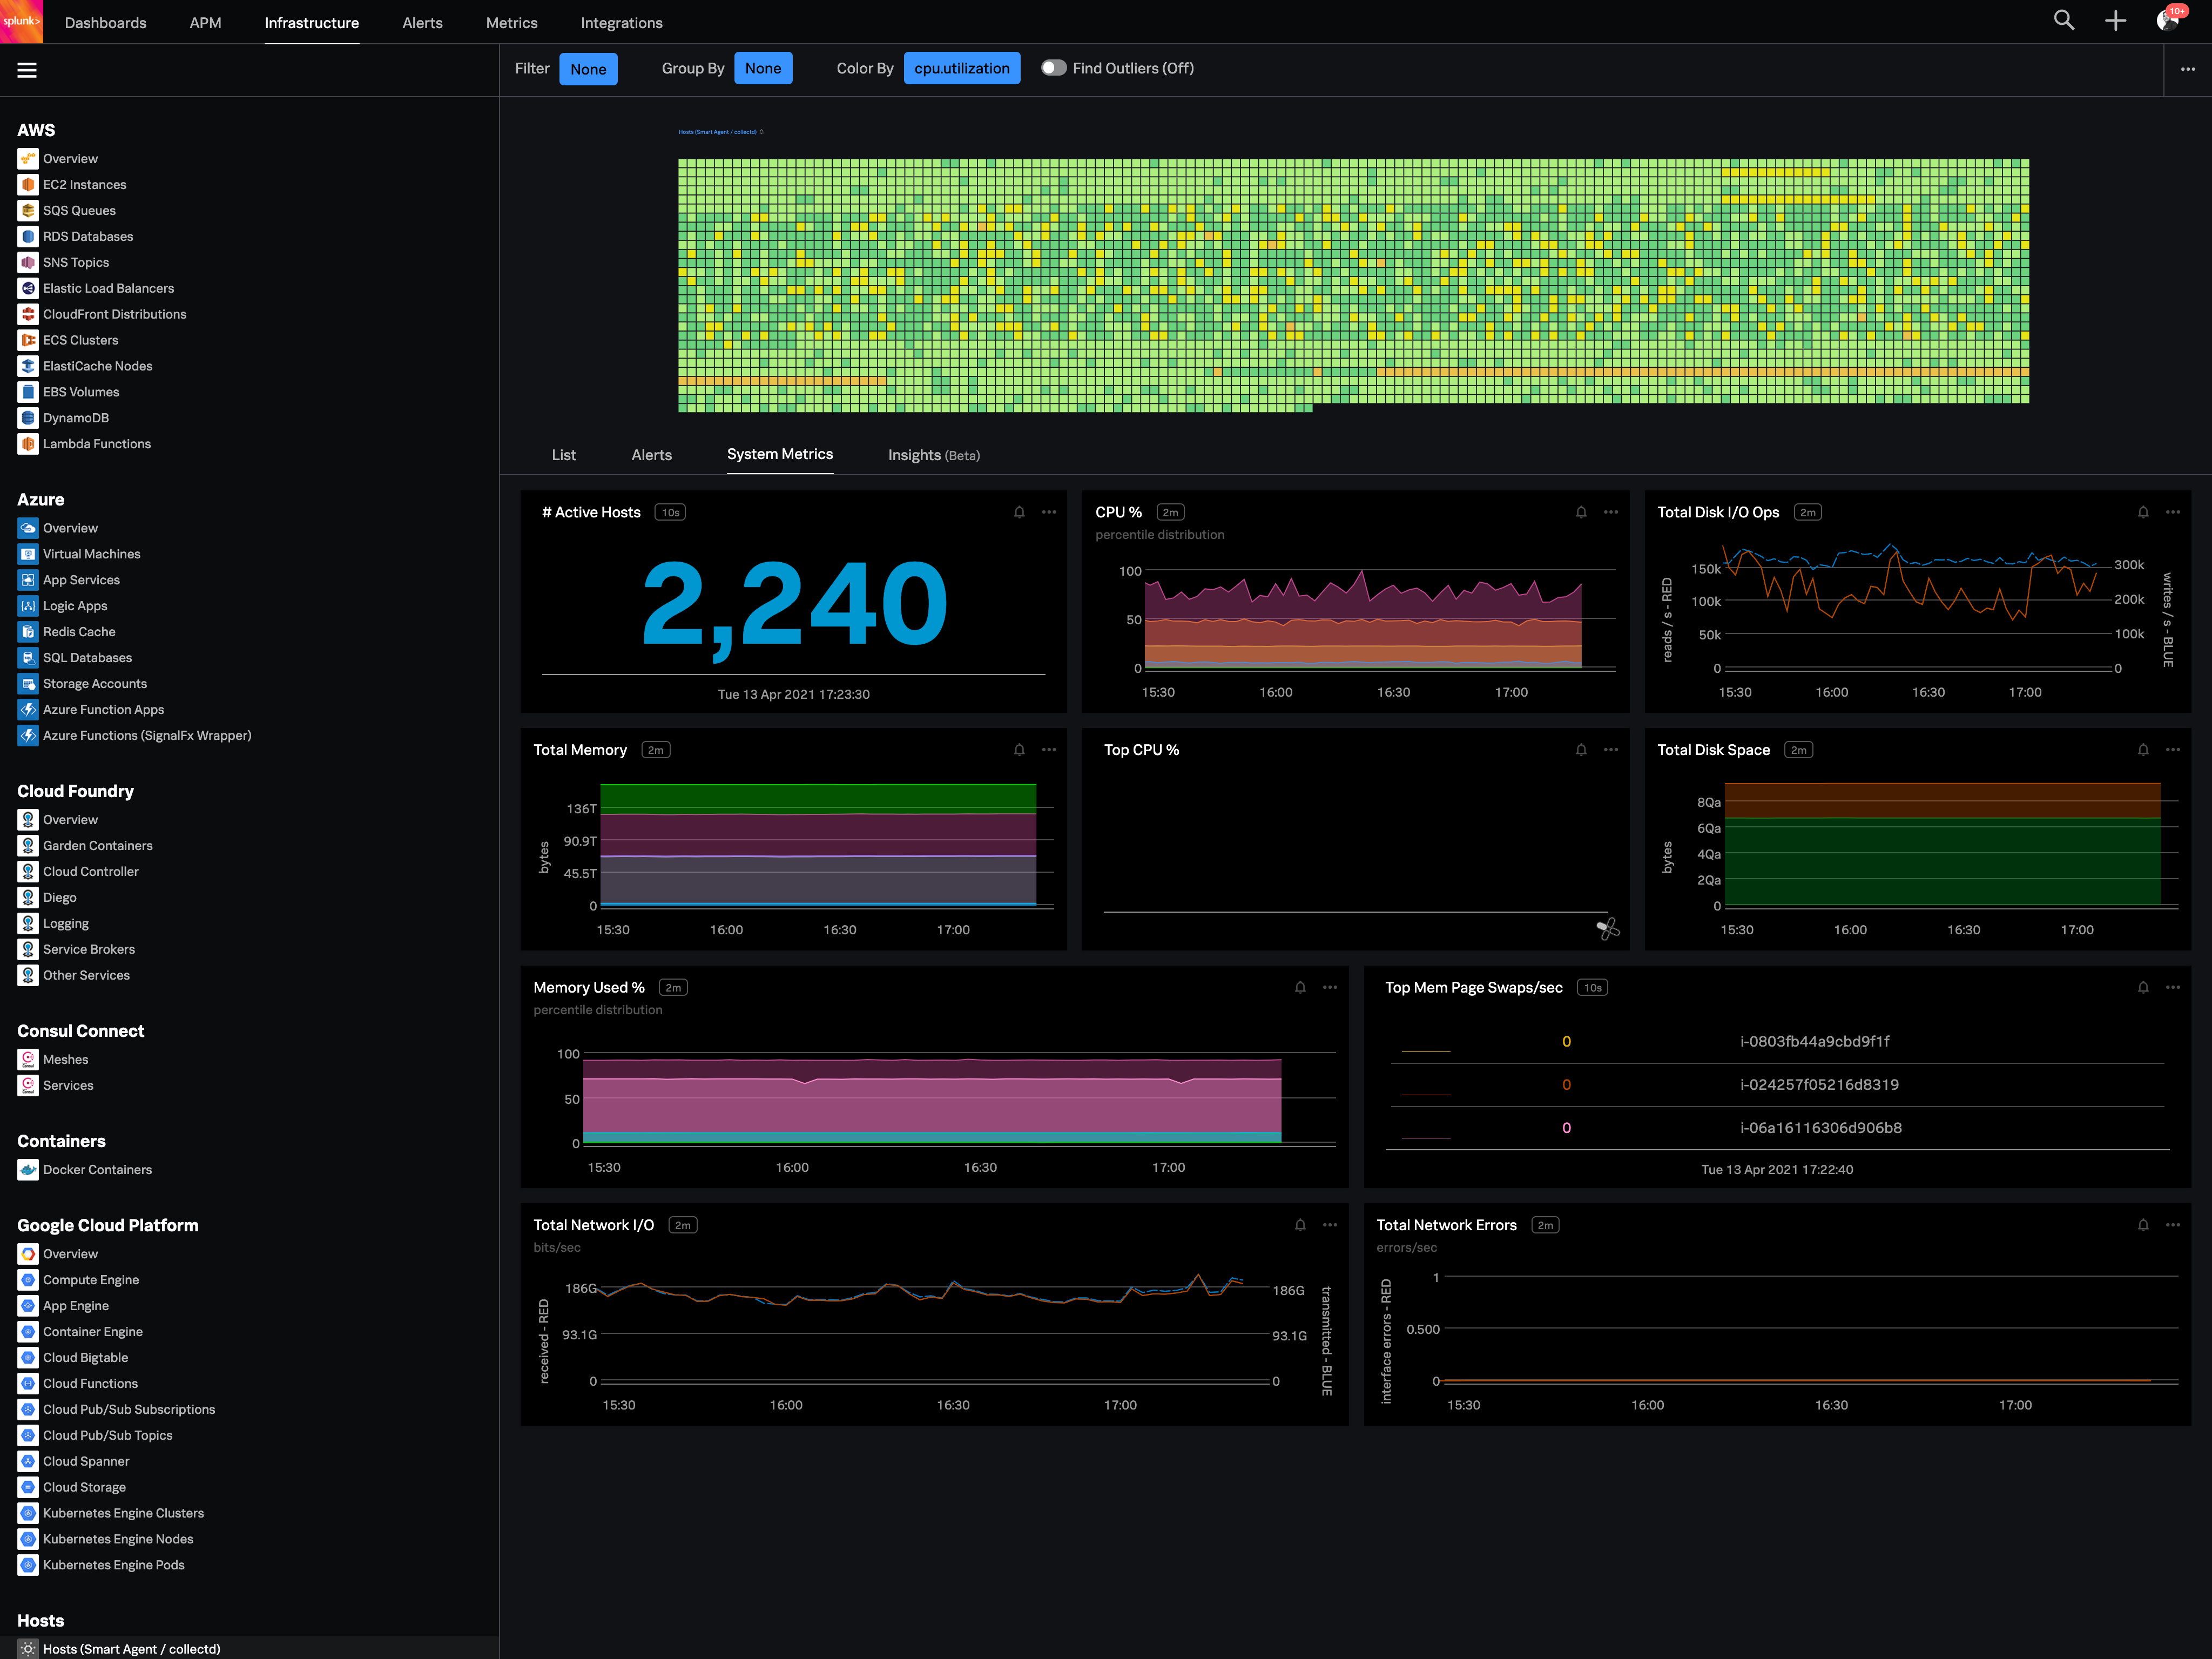
I really like this features because as we know how much K8s is vast and to manually monitor each part of the Kubernetes it takes so much time but Splunk Observability Cloud makes it easier. And even once we integrate K8s with Splunk Observability Cloud it gives us some prebuilt dashboards which gives holistic view of our Cluster and its nodes, pods, etc.
The dashbaord feature of Splunk Observability Cloud, it gives us full flexibility to customize our dashboard with a wide range of predefined chart types.
Now it also supports OTEL, which is a plus point for observability. As now everyone is moving towards Otel and in current market there are only few tools who supports OTEL based integrations, Splunk Observability Cloud is one out of them.
An indicator for errors on the navigations pane so that we don't have to go through each tab.
As we go more and more cloud maybe you guys can implement a pay-as-you-use strategy so that small companies using it not frequently can also afford it.
That's it can't think of any and it wont let me skip to next question. Thanks
Good: Stable system with low error rate Easy to use for simple use cases Bad: UI is not very clear for complex usage Mobile view (when logged in from phone) is bad No library for .net
Overall a great tool to have in your toolbox, It is very intuitive and our entire staff uses the tool. It is easy to use and cost is very reasonable. Splunk also has excellent support team and very easy to work with. Every time we had a challenge, support team was able to help us with the end result.
I have only had to use support once, so I can't go into much detail about their support team. The one time I did use it the response was fast but the resolution took some time.
Site24x7 [All-in-One Monitoring] has some similarities to ThousandEyes. Especially in the troubleshooting aspect where both offer Web performance waterfall charts to analyze the issue better. Both have cloud-based servers globally that allow to determine performance on the Internet. Site24x7 has more features available so we selected it instead.
To be honest, Datadog is very similar to Splunk and LogScale to a lesser degree, but it is just as good if you don't need too complex observability. Grafana is still growing and might reach the same level soon.
Positivity wise, we're spending a third of what we were on our website monitoring, this has allowed us to focus funding elsewhere (namely SolarWinds).
We have enhanced our core monitoring by now also being able to provide better coverage, whereas we were handicapped with our previous supplier due to the scaling costs of multi-step transactions.
The general feeling from our IT staff is that the platform is not great, which obviously reduces confidence in the ability for the platform to provide accurate monitoring data for our websites.