Mode, or Mode Analytics, from ThoughtSpot since the June 2023 acquisition, is a business intelligence platform that unifies company analytics by bringing data teams and business teams together, so analysts can provide rapid answers to strategic, ad hoc questions. And, business stakeholder can access relevant data to answer their own questions which can often detract more impactful work.
N/A
Woopra
Score 3.0 out of 10
Enterprise companies (1,001+ employees)
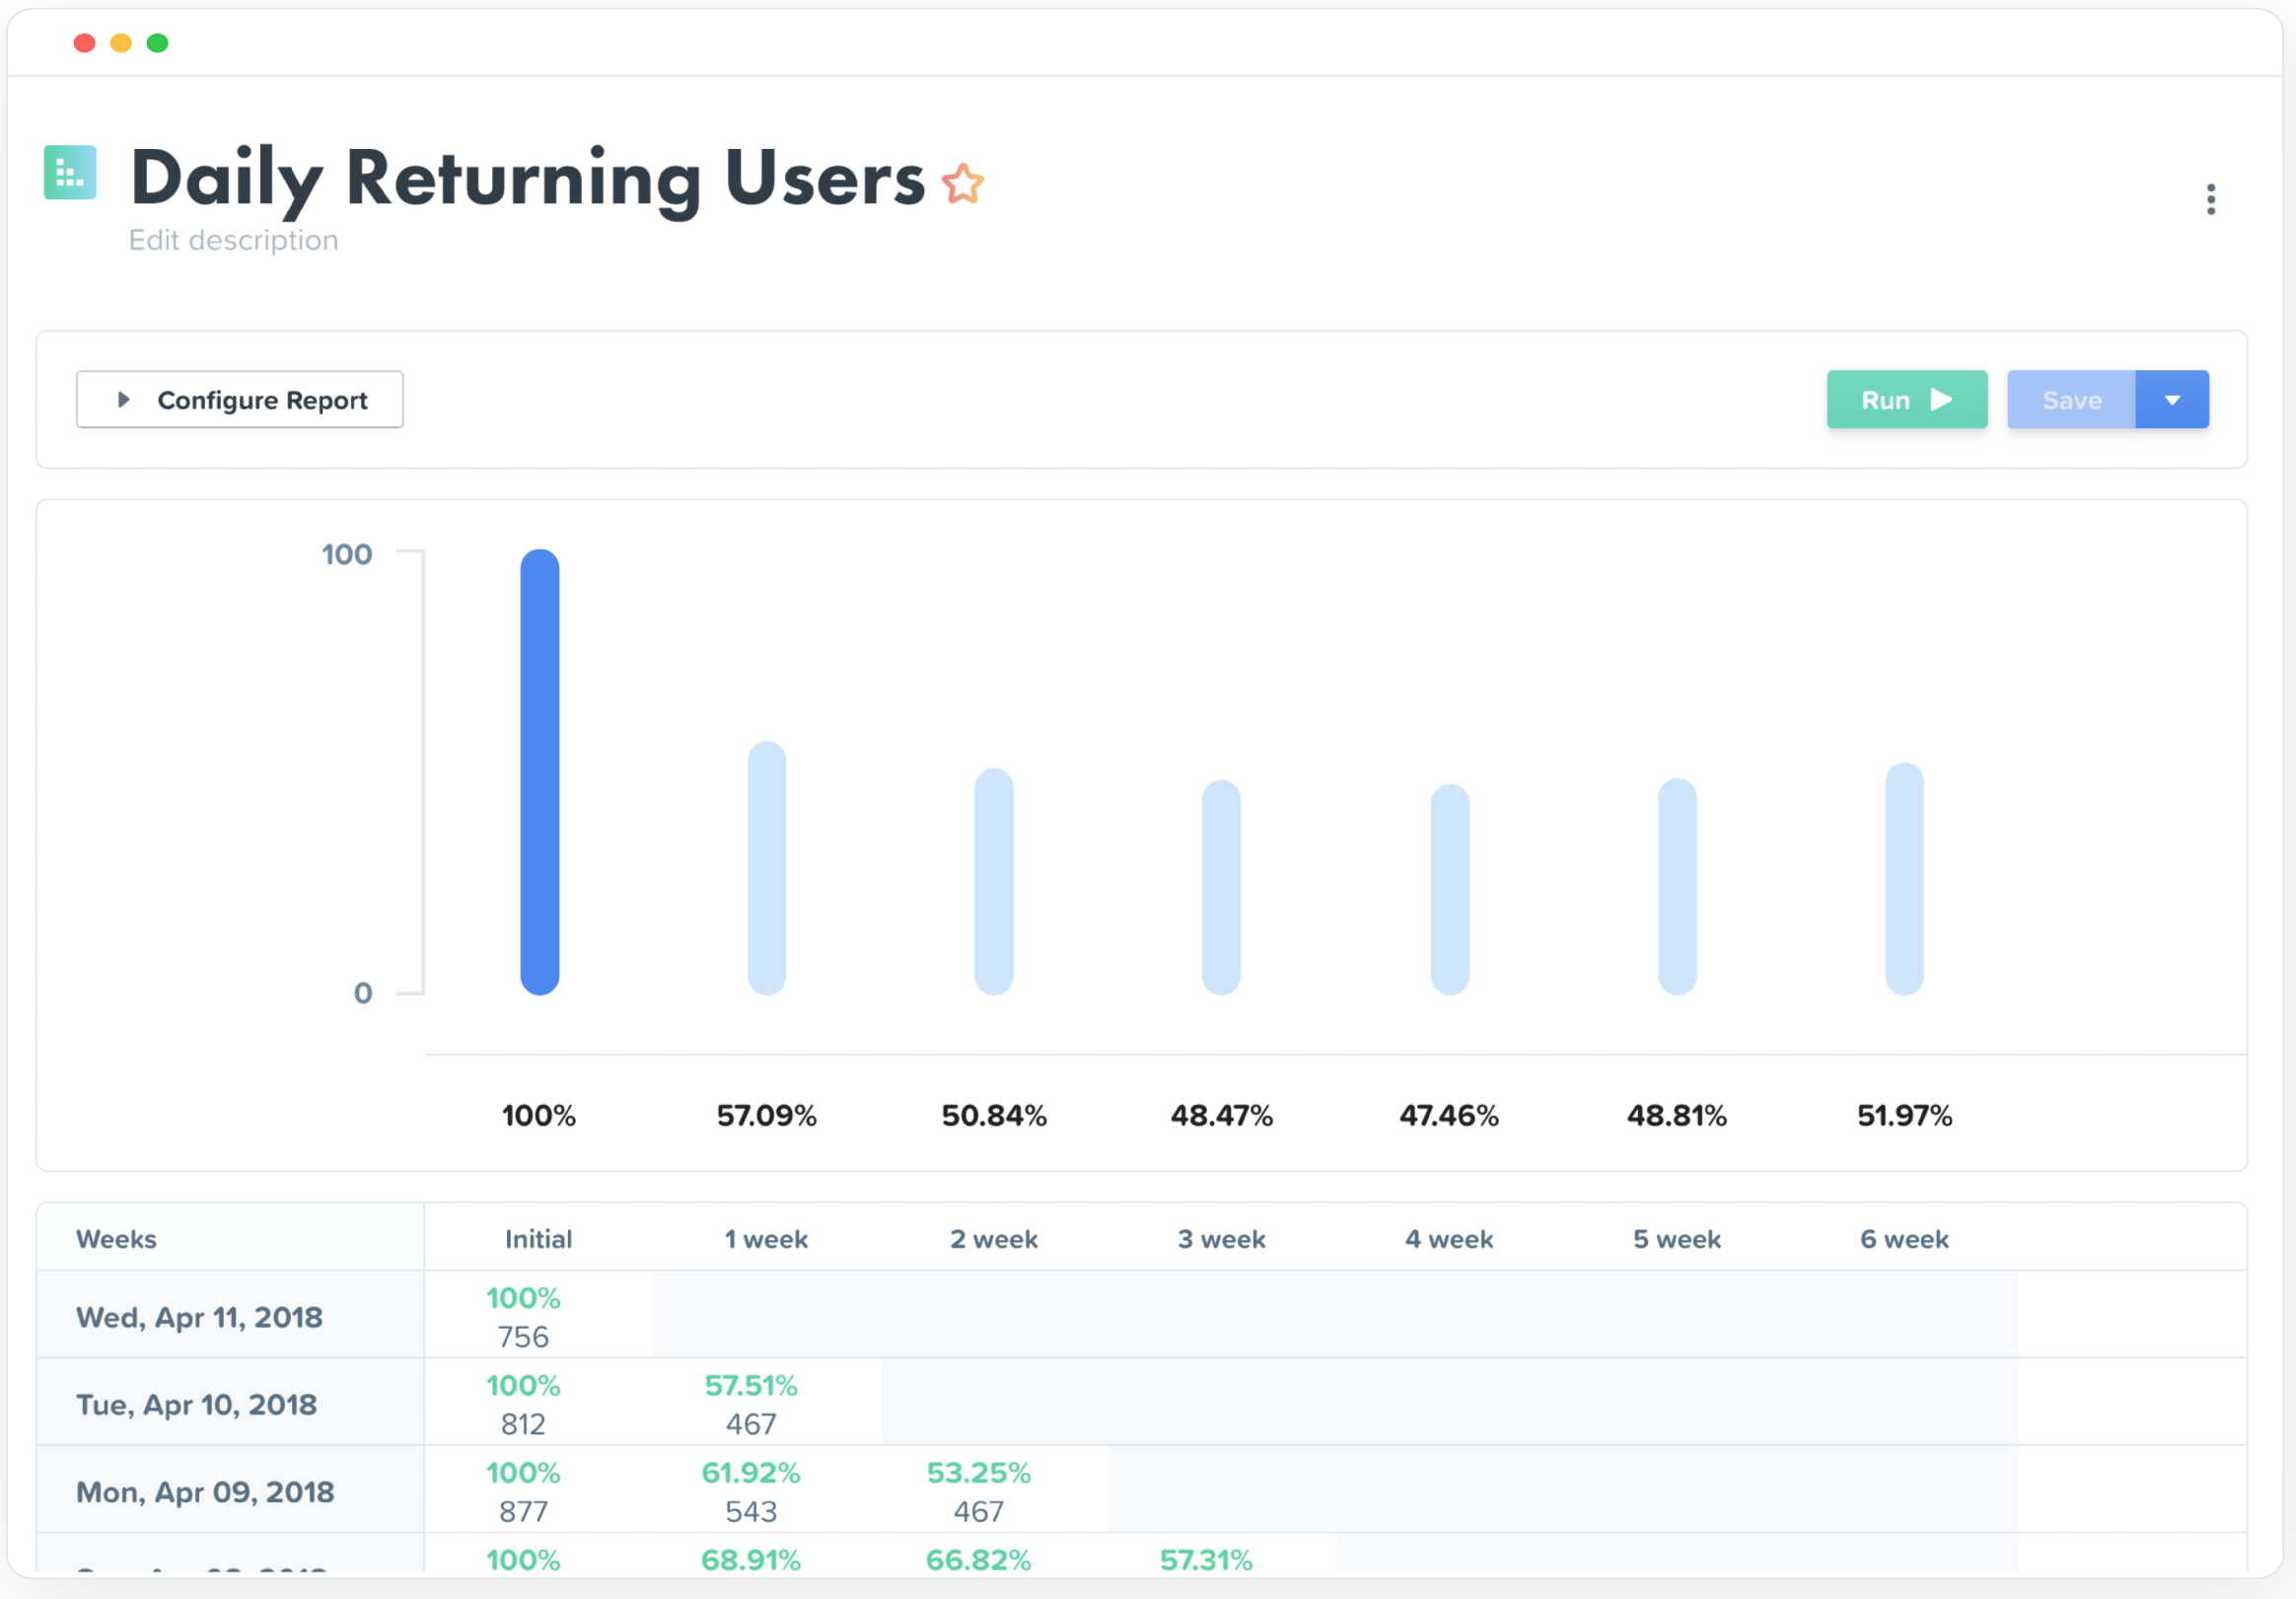
Woopra provides real-time customer analytics. It begins by tracking users across digital touch points (website, mobile app, help desk, marketing automation, etc.) and building a comprehensive behavioral profile for each user. These Customer Profiles are Woopra's building blocks, which are used to generate custom analytics reports, funnel analytics, retention analytics, and more.
$80
per month
Pricing
Mode Analytics
Woopra
Editions & Modules
No answers on this topic
Pro
$999.00
per month
Offerings
Pricing Offerings
Mode
Woopra
Free Trial
Yes
Yes
Free/Freemium Version
Yes
Yes
Premium Consulting/Integration Services
No
Yes
Entry-level Setup Fee
No setup fee
Optional
Additional Details
—
—
More Pricing Information
Community Pulse
Mode Analytics
Woopra
Features
Mode Analytics
Woopra
BI Standard Reporting
Comparison of BI Standard Reporting features of Product A and Product B
Mode Analytics
8.5
9 Ratings
4% above category average
Woopra
-
Ratings
Pixel Perfect reports
9.34 Ratings
00 Ratings
Customizable dashboards
8.49 Ratings
00 Ratings
Report Formatting Templates
7.86 Ratings
00 Ratings
Ad-hoc Reporting
Comparison of Ad-hoc Reporting features of Product A and Product B
Mode Analytics
7.4
9 Ratings
8% below category average
Woopra
-
Ratings
Drill-down analysis
7.18 Ratings
00 Ratings
Formatting capabilities
6.79 Ratings
00 Ratings
Integration with R or other statistical packages
7.39 Ratings
00 Ratings
Report sharing and collaboration
8.78 Ratings
00 Ratings
Report Output and Scheduling
Comparison of Report Output and Scheduling features of Product A and Product B
Mode Analytics
7.9
8 Ratings
4% below category average
Woopra
-
Ratings
Publish to Web
8.15 Ratings
00 Ratings
Publish to PDF
5.88 Ratings
00 Ratings
Report Versioning
7.74 Ratings
00 Ratings
Report Delivery Scheduling
9.68 Ratings
00 Ratings
Delivery to Remote Servers
8.34 Ratings
00 Ratings
Data Discovery and Visualization
Comparison of Data Discovery and Visualization features of Product A and Product B
Mode is a clear category winner for how it easy it is to go from interactive analysis to professional quality reporting. You can easily do all your SQL and quite a bit of R/Python. If you want to quickly go from your database to simple charts, this is your pick. If you need to do heavier data modeling, scheduling jobs, or ML, you'll need something else, like Databricks. In my opinion, the quality of visualizations and some developer/analyst features make Databricks an unacceptable substitute.
My rating of Woopra is the absolute best possible. I would recommend them to anyone looking for an analytics website that prefers a visual interface and a beautiful design. I have not encountered any problems using their app -- ZERO! Their integration with other marketing software, such as MailChimp, helps our company zero in on our marketing campaigns and gives us the information we need to make better choices. I LOVE Woopra and think they are the best out there! I have used other websites and there is no comparison!
Woopra tracks *individual users and customer accounts*. It cannot be understated how important this is. Google Analytics and other low cost solutions only sample users and provide aggregate data. For enterprise sales, this is critical. Likewise, for product managers trying to segment product usage by types of accounts, this is incredibly useful.
Woopra updates user analytics in real time. This is critical in a sales context as you want to be able to follow up quickly on opportunities. Likewise, it is useful for customer success as they can see usage in real time for an individual they are supporting.
Woopra has the most turnkey integrations of any web analytics solution on the market. By far the most useful are Marketo, SalesForce, and Slack, but there are several more we didn't tap into. While any solution worth its salt has an API, Woopra's integrations usually require a login and/or API key, and you are good to go. Here is the current list: https://www.woopra.com/appconnect/.
Woopra enables B2B product managers to track product and feature usage by revenue, not just clicks. Again, in a B2B context, this is critical, as there are high-value users and low-value users. Knowing the difference is critical.
Woopra's implementation is super simple. We were able to set it up with a couple of hours of one frontend developer and some help from our product intern.
We just really like the tool. There are lots of us using it internally... from Product, to marketing, to customer service, to optimization team, to traffic acquisition, to Executives. Really helps us answer questions about how well things are going, and what is not going well.
The UI and reports are great overall. Creating reports just requires a few too many screens and clicks. Also dashboard tiles can't be resized. Both of these are easy items that are being addressed
Compared to other products, the support was a small effort. We only had part time contributions from a product management intern and front end developer.
Woopra is much easier to setup and use than Google Analytics. I've spent hours trying to create custom reports in Google Analytics. Woopra does not take this much time to get solid reporting for our site. If you need something that tracks marketing efforts then Google Analytics will likely be a better fit.
Really helped us begin to segment our users based on their engagement and retention.
Helped increase retention by about 1.5% after about 5 months of implementation (don't shoot the messenger if your team can't implement that quickly).
I felt like it had great potential to create a pipeline between sales and the CSM, but I had trouble getting the sales team to implement it properly as they had their noses deep in calls and emails (they struggle entering notes in SalesForces as well, so it's more a company specific problem).