New Relic vs. Releem
New Relic vs. Releem
| Product | Rating | Most Used By | Product Summary | Starting Price |
|---|---|---|---|---|
 New Relic | N/A | New Relic is a SaaS-based web and mobile application performance management provider for the cloud and the datacenter. They provide code-level diagnostics for dedicated infrastructures, the cloud, or hybrid environments and real time monitoring. | $0 No credit card required; 100 GB free ingest per month, 1 free full user + unlimited basic users, 8 days retention, 100 Synthetics Checks | |
 Releem | N/A | Database performance management was a major pain point for developers: sifting through endless metrics and alerts, calculating variables, dealing with tons of documentation, query optimization, and index management. Releem is an AI-powered MySQL performance monitoring tool that helps keep database servers fast, secure and reliable. According to the vendor, its features beyond database performance monitoring and management include: 📊 Quick and simple to use with all the… | $0 per month 1 DB instance |
| New Relic | Releem | |||||||||||||||
|---|---|---|---|---|---|---|---|---|---|---|---|---|---|---|---|---|
| Editions & Modules |
|
| ||||||||||||||
| Offerings |
| |||||||||||||||
| Entry-level Setup Fee | No setup fee | Optional | ||||||||||||||
| Additional Details | — | 25% discount for annual plan. | ||||||||||||||
| More Pricing Information | ||||||||||||||||
| New Relic | Releem |
|---|
| New Relic | Releem | |
|---|---|---|
| Small Businesses |  InfluxDB Score 8.8 out of 10 | No answers on this topic |
| Medium-sized Companies |  Sumo Logic Score 8.8 out of 10 |  LogicMonitor Score 9.0 out of 10 |
| Enterprises |  NetBrain Technologies Score 9.2 out of 10 | LogicMonitor Score 9.0 out of 10 |
| All Alternatives | View all alternatives | View all alternatives |
| New Relic | Releem | |
|---|---|---|
| Likelihood to Recommend | 7.9 (145 ratings) | - (0 ratings) |
| Likelihood to Renew | 8.8 (16 ratings) | - (0 ratings) |
| Usability | 8.3 (11 ratings) | - (0 ratings) |
| Availability | 9.1 (2 ratings) | - (0 ratings) |
| Performance | 9.1 (2 ratings) | - (0 ratings) |
| Support Rating | 9.0 (7 ratings) | - (0 ratings) |
| Implementation Rating | 8.0 (9 ratings) | - (0 ratings) |
| Configurability | 7.3 (3 ratings) | - (0 ratings) |
| Ease of integration | 9.0 (1 ratings) | - (0 ratings) |
| Product Scalability | 9.1 (2 ratings) | - (0 ratings) |
| Vendor post-sale | 8.2 (2 ratings) | - (0 ratings) |
| Vendor pre-sale | 8.2 (2 ratings) | - (0 ratings) |
| New Relic | Releem | |
|---|---|---|
| Likelihood to Recommend |  New Relic
| Releem No answers on this topic |
| Pros | New Relic
| Releem No answers on this topic |
| Cons | New Relic
 Ratnesh Chandak Member of Techincal Staff | Releem No answers on this topic |
| Likelihood to Renew | New Relic
| Releem No answers on this topic |
| Usability | New Relic
| Releem No answers on this topic |
| Reliability and Availability | New Relic
| Releem No answers on this topic |
| Performance | New Relic
 Jayson E. Conry Lead Monitoring Engineer | Releem No answers on this topic |
| Support Rating | New Relic
 Piyush Goel Senior Vice President - Engineering | Releem No answers on this topic |
| Implementation Rating | New Relic
| Releem No answers on this topic |
| Alternatives Considered | New Relic
| Releem No answers on this topic |
| Scalability | New Relic
| Releem No answers on this topic |
| Return on Investment | New Relic
| Releem No answers on this topic |
| ScreenShots | Releem Screenshots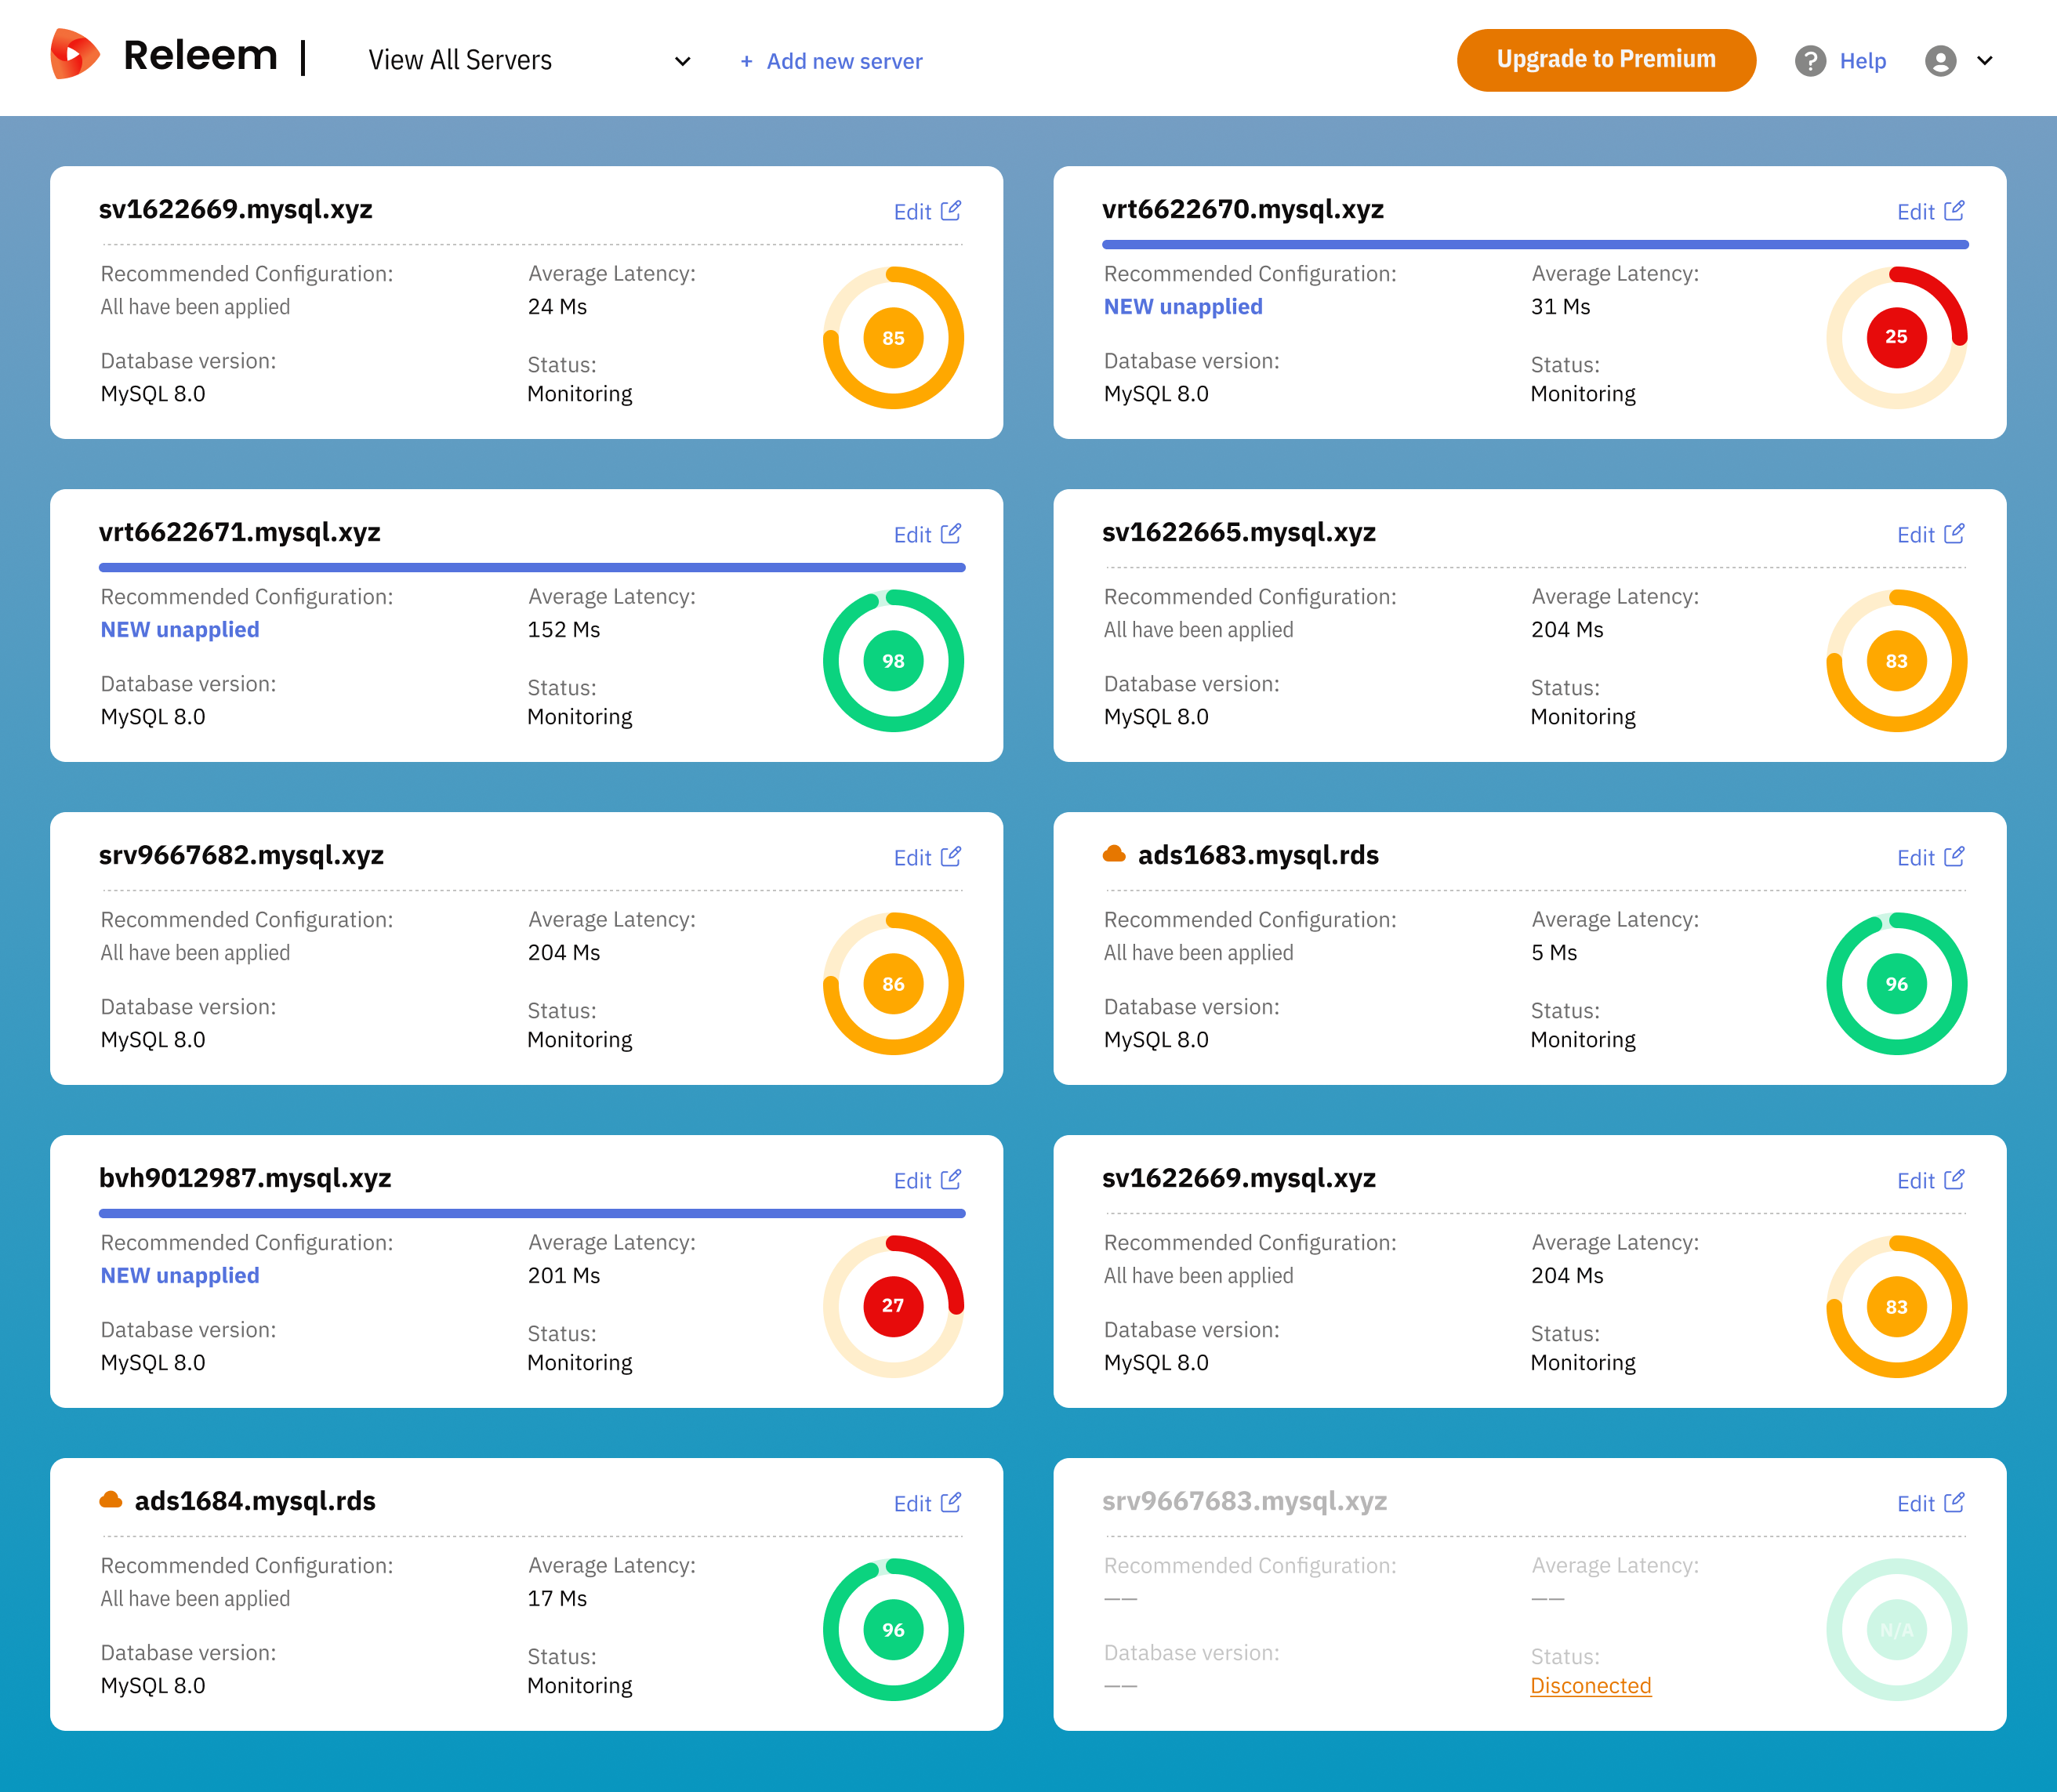 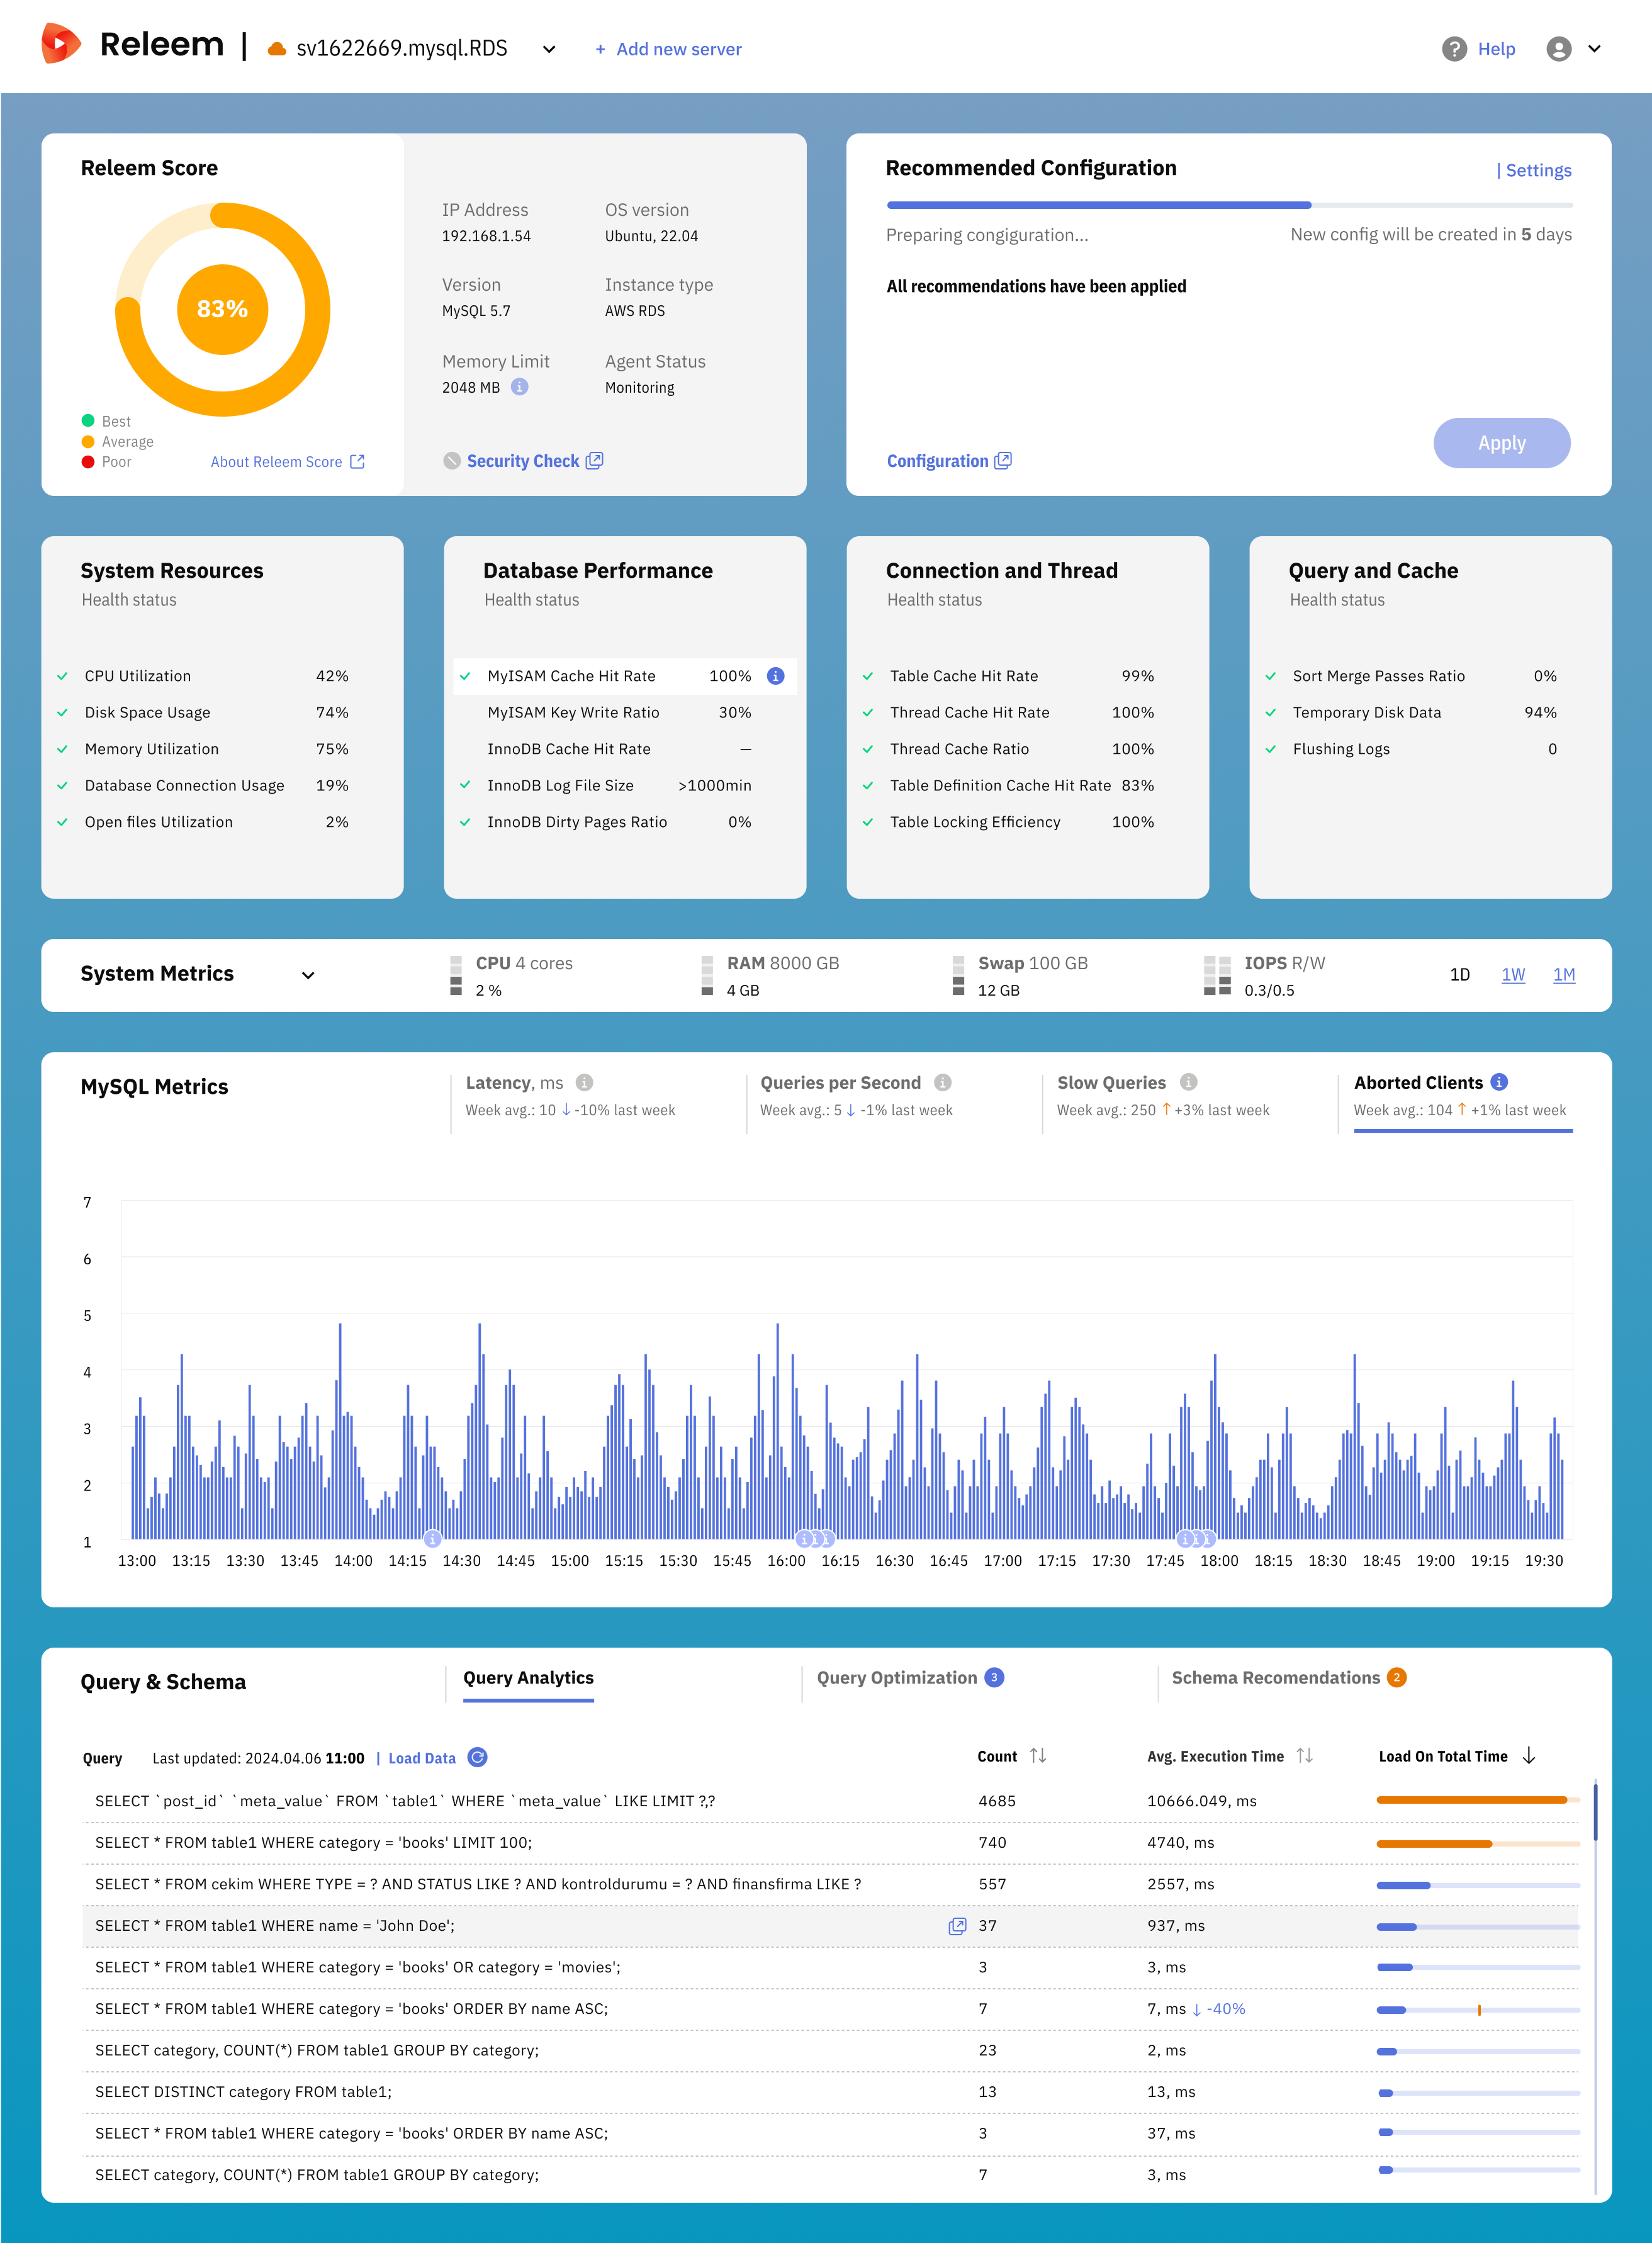 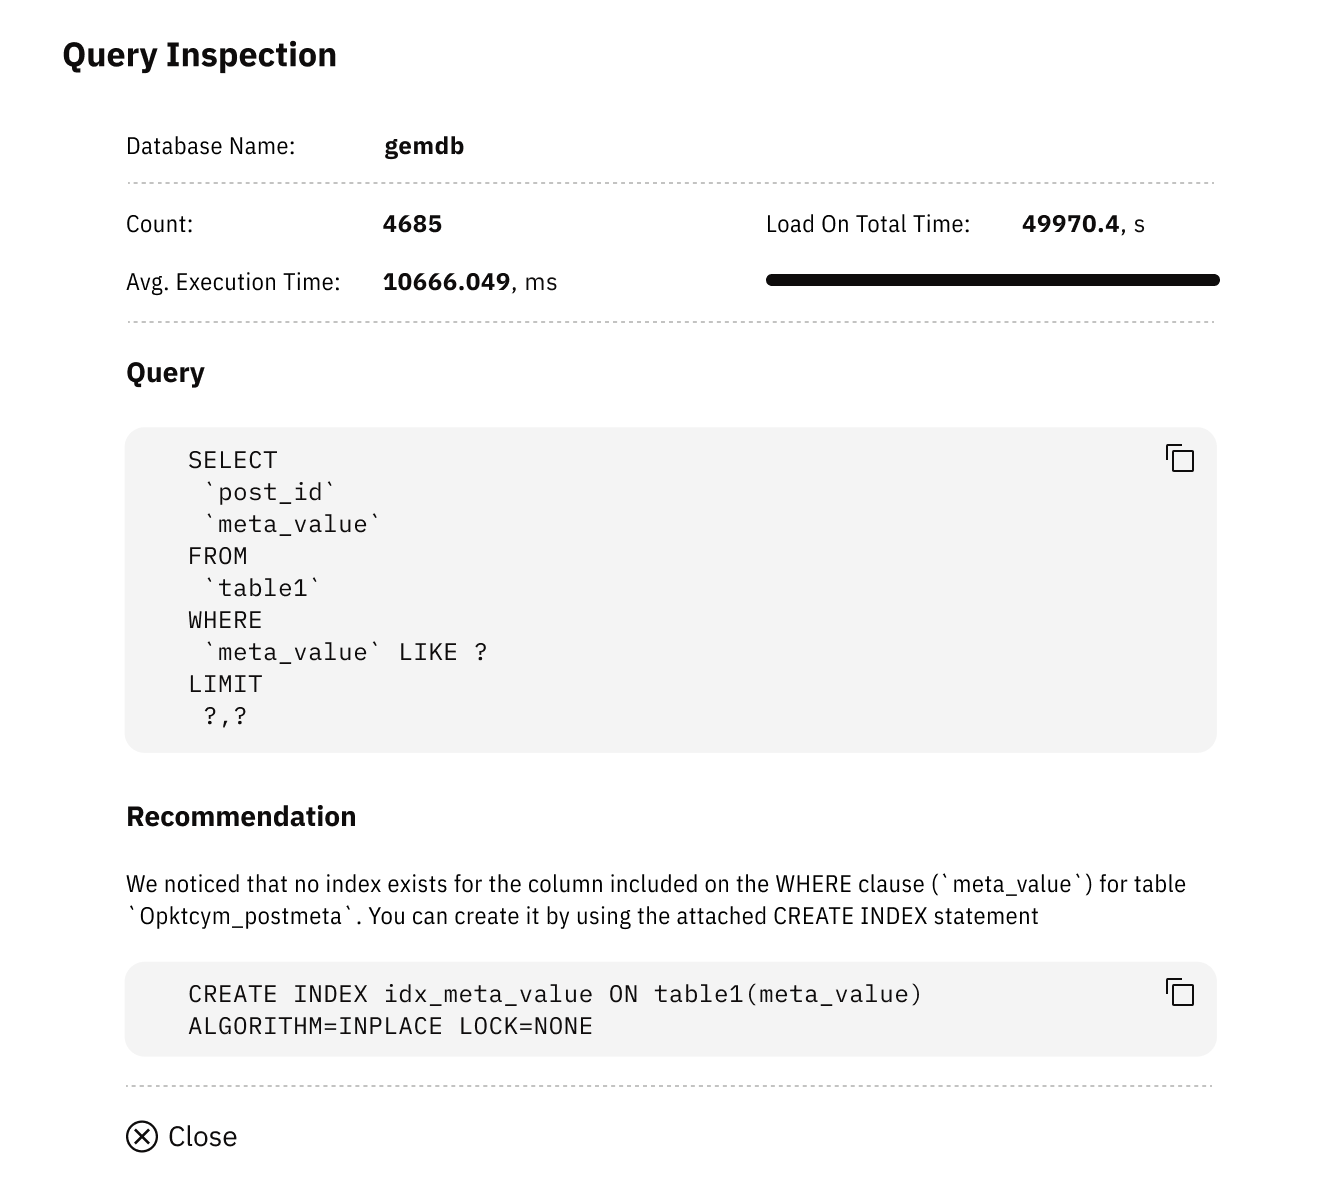 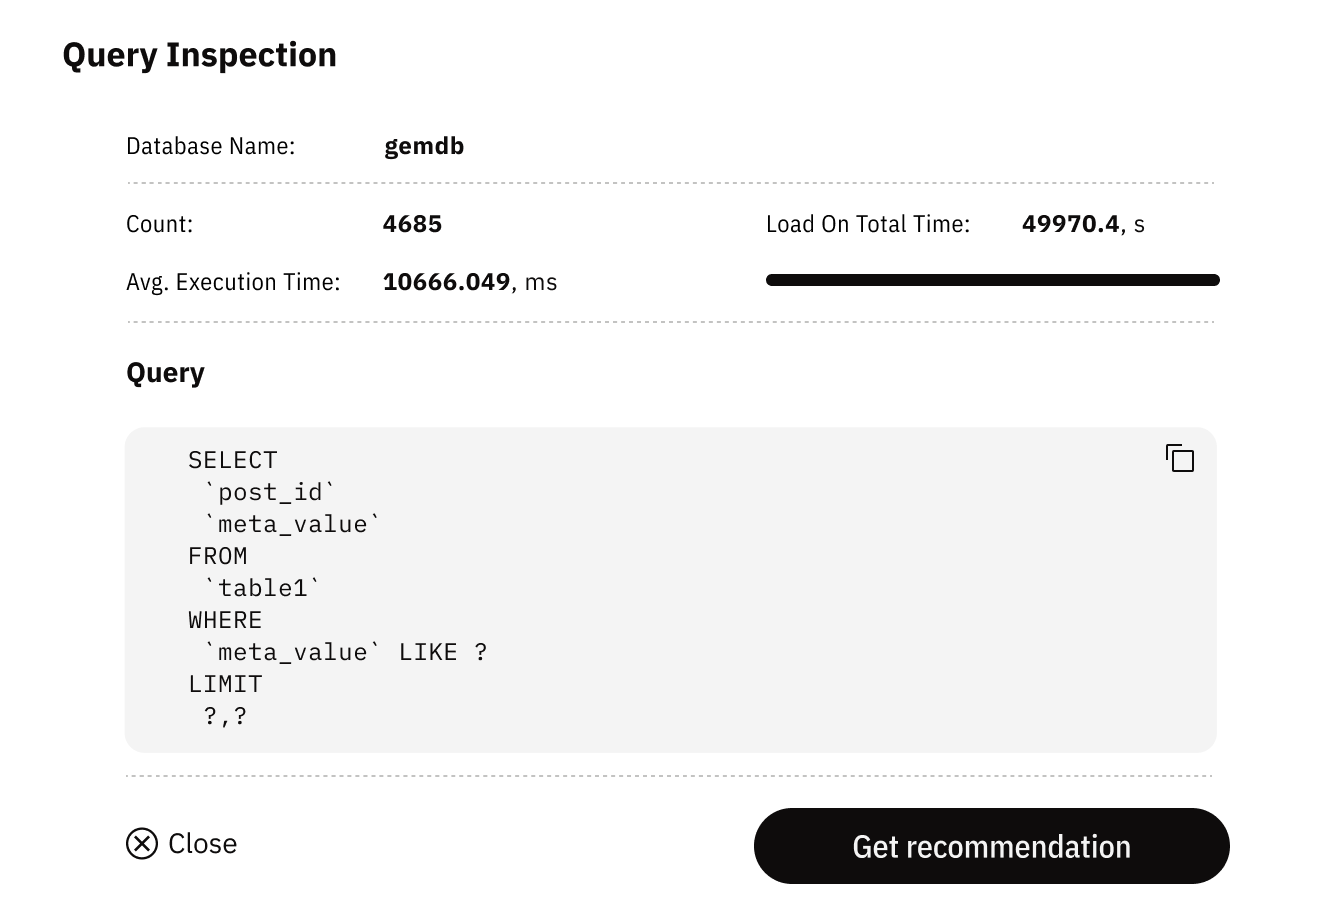 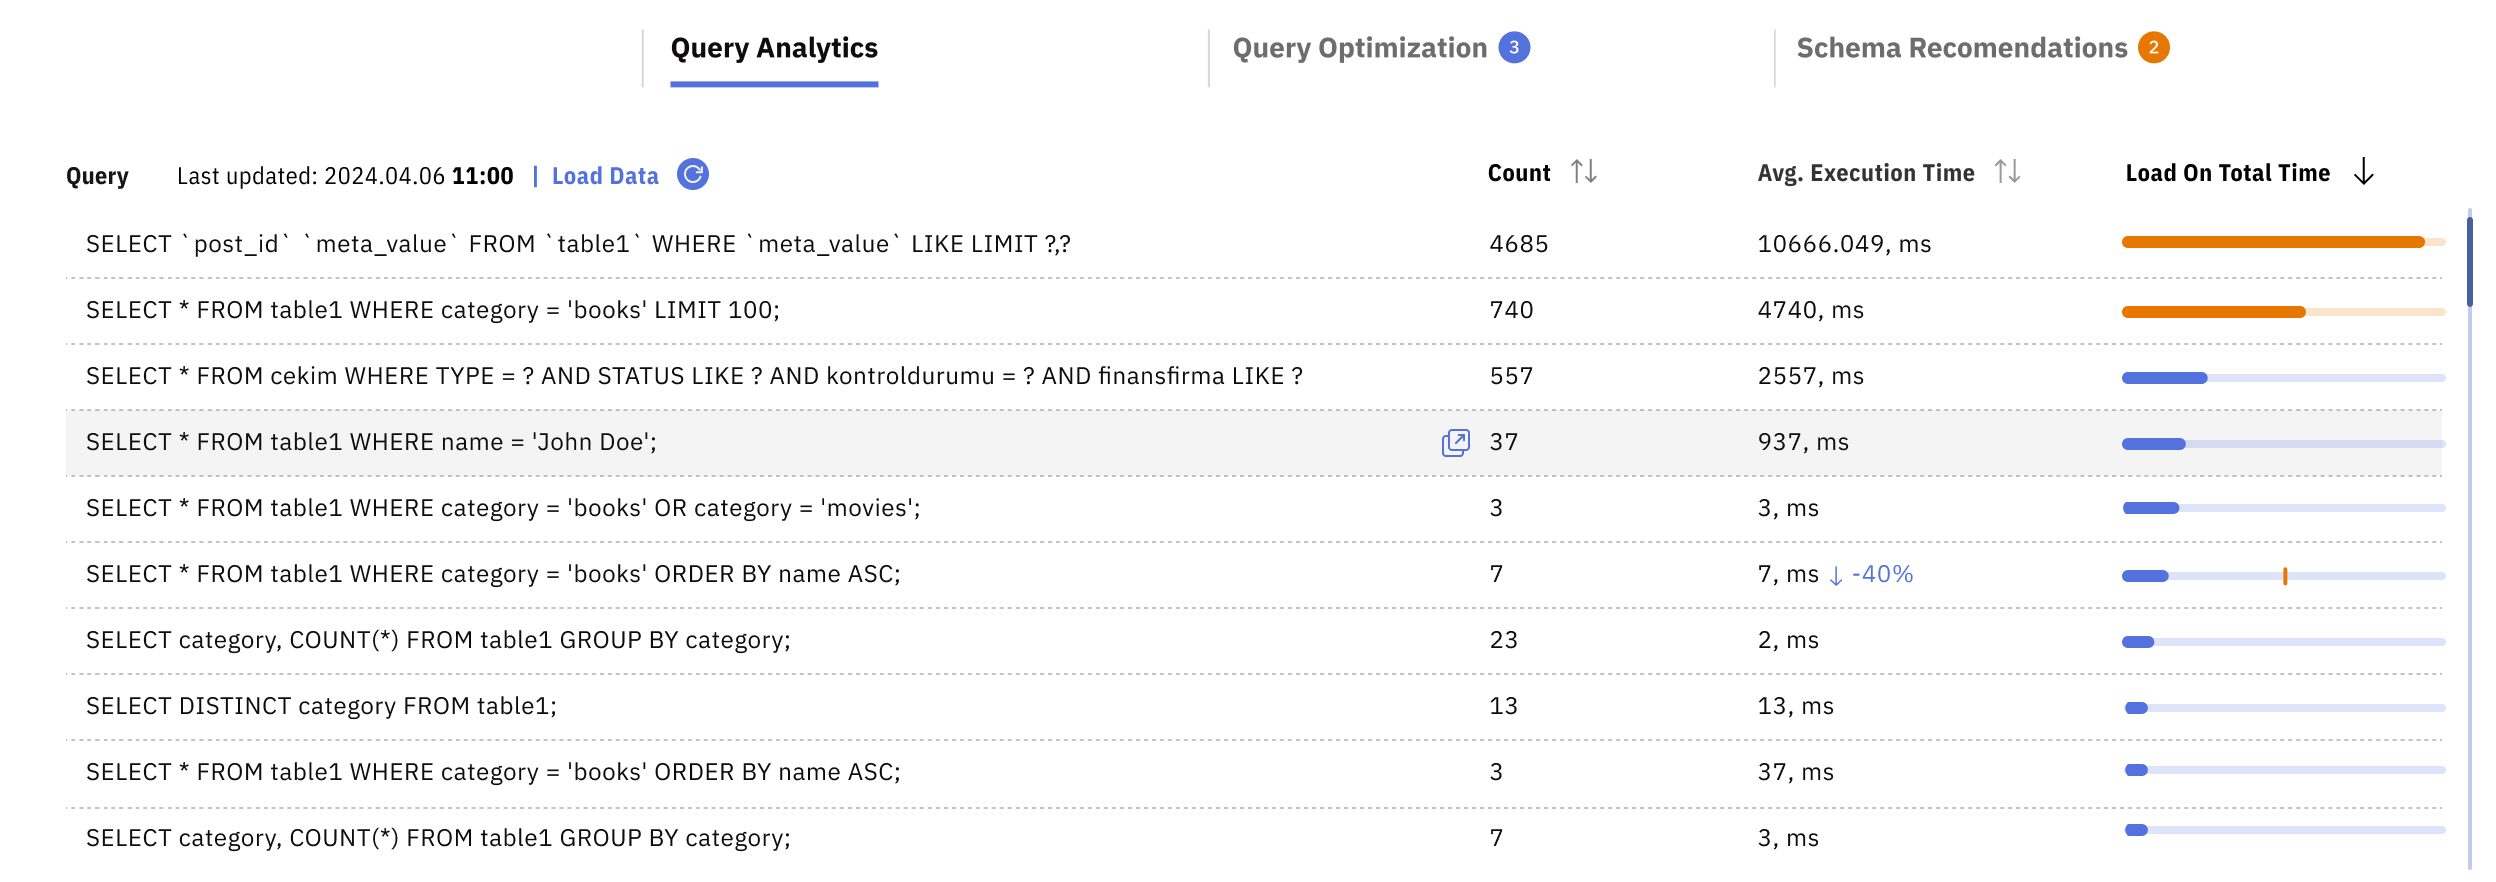 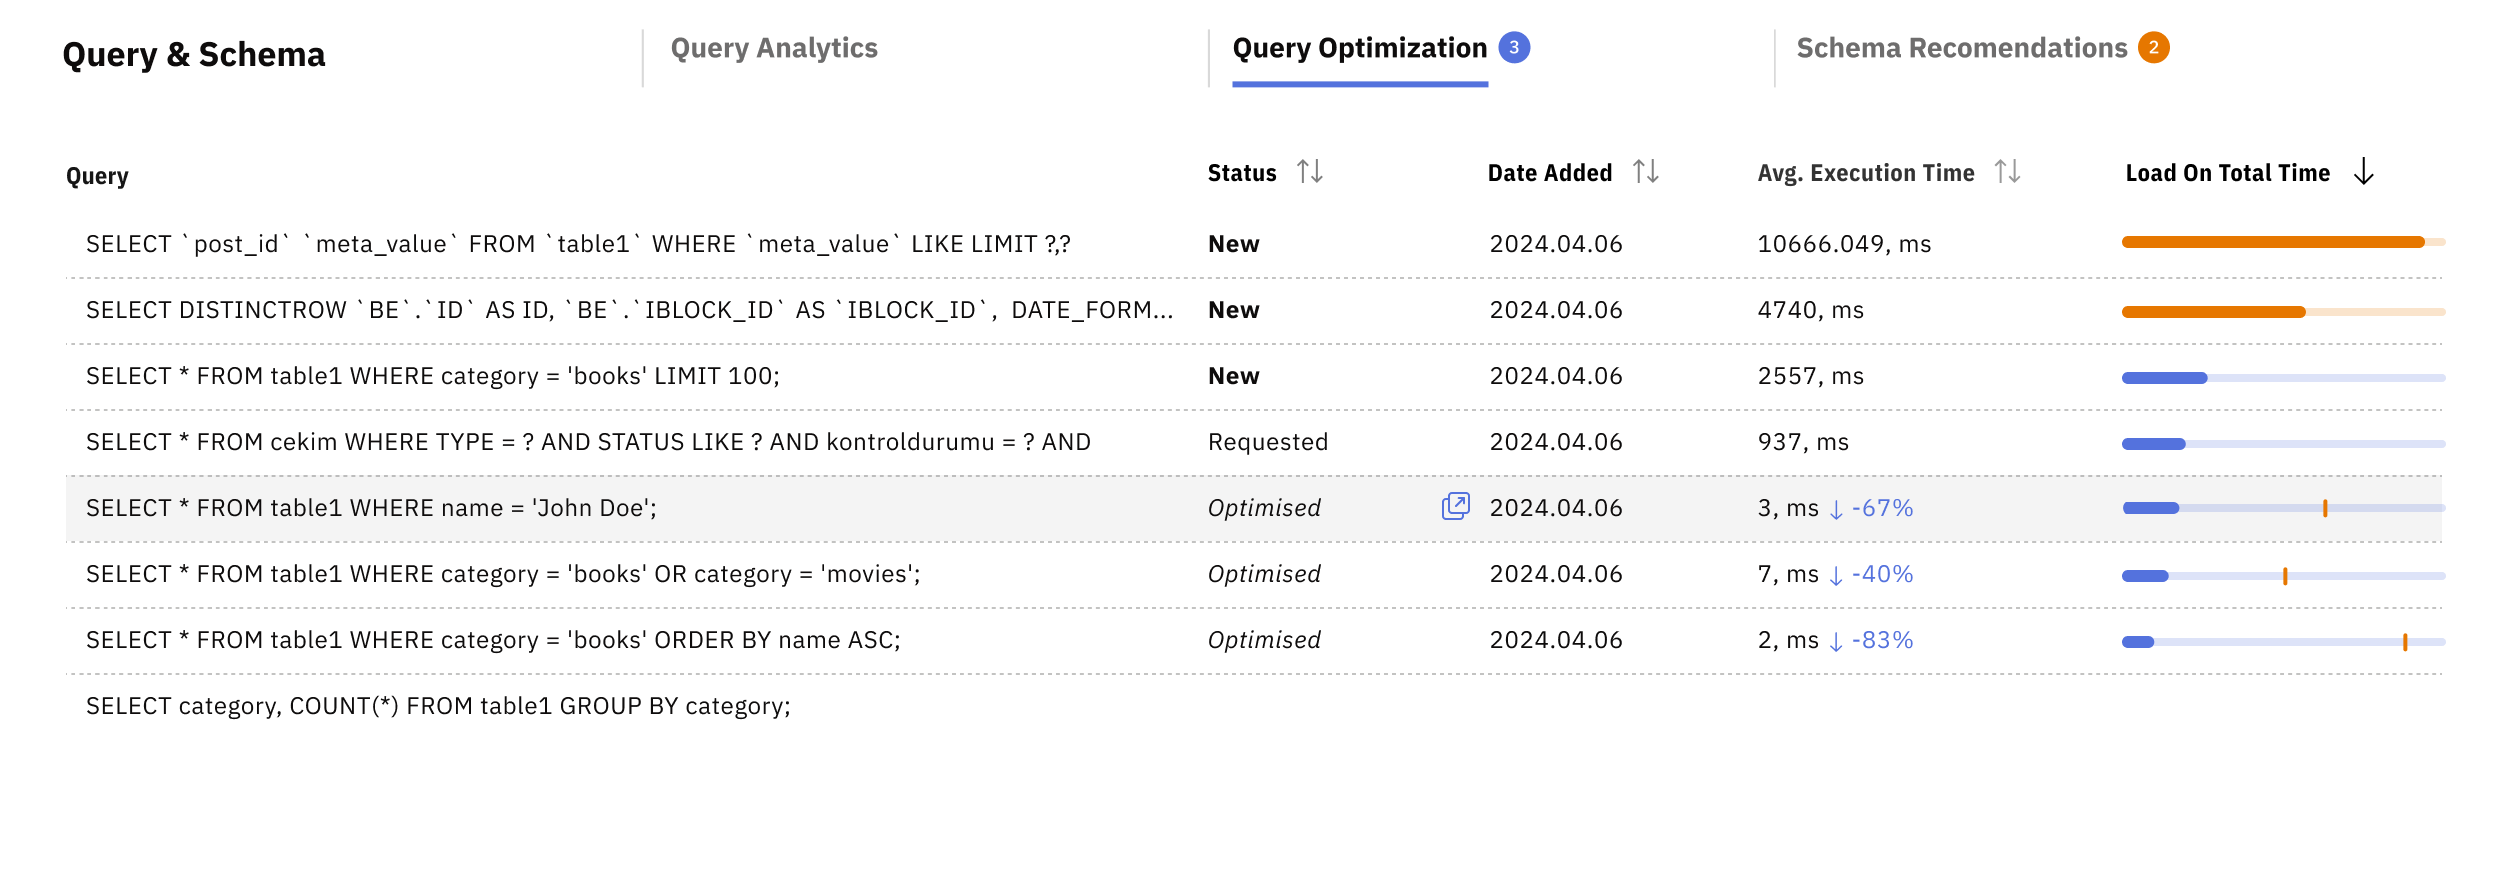 |
