
SmartSuite vs. Tableau Desktop
| Product | Rating | Most Used By | Product Summary | Starting Price |
|---|---|---|---|---|
 SmartSuite | Score10 out of 10 | N/A | SmartSuite provides a collaborative Work Management platform that enables teams to plan, track and manage workflows - whether it be a project, an ongoing process or routine everyday tasks. SmartSuite helps coordinate people and work across all levels of an organization to ensure that team members have the information they need to accomplish the work that matters most. Team members can create a workflow, or choose from over 200 templates that can be tailored to their exact needs. | $10 per month per user |
 Tableau Desktop | Score8.6 out of 10 | N/A | Tableau Desktop is a data visualization product from Tableau. It connects to a variety of data sources for combining disparate data sources without coding. It provides tools for discovering patterns and insights, data calculations, forecasts, and statistical summaries and visual storytelling. | $1,380 per year (purchased via a Creator license) |
| SmartSuite | Tableau Desktop | |||||||||||||||
|---|---|---|---|---|---|---|---|---|---|---|---|---|---|---|---|---|
| Editions & Modules | No answers on this topic |
| ||||||||||||||
| Offerings |
| |||||||||||||||
| Entry-level Setup Fee | No setup fee | No setup fee | ||||||||||||||
| Additional Details | — | All pricing plans are billed annually. A Creator license includes Tableau Desktop, Tableau Prep Builder, and Tableau Pulse. Discounts sometimes available for volume. | ||||||||||||||
| More Pricing Information | ||||||||||||||||
| SmartSuite | Tableau Desktop | |
|---|---|---|
| Considered Both Products | No answer on this topic | No answer on this topic |
| Key User Insights | ||
| Would buy again | ||
94% Would buy again 17 Answers | 93% Would buy again 52 Answers | |
| Delivers good value for the price | ||
100% Delivers good value for the price 18 Answers | 91% Delivers good value for the price 50 Answers | |
| Happy with the feature set | ||
100% Happy with the feature set 18 Answers | 98% Happy with the feature set 55 Answers | |
| Lived up to sales and marketing promises | ||
100% Lived up to sales and marketing promises 18 Answers | 93% Lived up to sales and marketing promises 38 Answers | |
| Implementation went as expected | ||
100% Implementation went as expected 18 Answers | 100% Implementation went as expected 44 Answers | |
| SmartSuite | Tableau Desktop | |||||||||||||||||||||||||||||||||||||||||||
|---|---|---|---|---|---|---|---|---|---|---|---|---|---|---|---|---|---|---|---|---|---|---|---|---|---|---|---|---|---|---|---|---|---|---|---|---|---|---|---|---|---|---|---|---|
| Project Management |
| |||||||||||||||||||||||||||||||||||||||||||
| Professional Services Automation |
| |||||||||||||||||||||||||||||||||||||||||||
| BI Standard Reporting |
| |||||||||||||||||||||||||||||||||||||||||||
| Ad-hoc Reporting |
| |||||||||||||||||||||||||||||||||||||||||||
| Report Output and Scheduling |
| |||||||||||||||||||||||||||||||||||||||||||
| Data Discovery and Visualization |
| |||||||||||||||||||||||||||||||||||||||||||
| Access Control and Security |
| |||||||||||||||||||||||||||||||||||||||||||
| Mobile Capabilities |
| |||||||||||||||||||||||||||||||||||||||||||
| Application Program Interfaces (APIs) / Embedding |
| |||||||||||||||||||||||||||||||||||||||||||
| SmartSuite | Tableau Desktop | |
|---|---|---|
| Small Businesses |  Any.do Score8 out of 10 |  Cyfe Score4 out of 10 |
| Medium-sized Companies |  KanbanFlow Score7.3 out of 10 |  Qlik Cloud Analytics (Qlik Sense) Score8.1 out of 10 |
| Enterprises |  Microsoft To Do Score7.9 out of 10 |  Sisense Score6.9 out of 10 |
| All Alternatives | View all alternatives | View all alternatives |
| SmartSuite | Tableau Desktop | |
|---|---|---|
| Likelihood to Recommend | 9.2 | 9.1 |
| Likelihood to Renew | 9.1 | 7.5 |
| Usability | 9.1 | 8.4 |
| Availability | - | 10.0 |
| Performance | - | 8.0 |
| Support Rating | 9.1 | 1.0 |
| In-Person Training | - | 9.4 |
| Online Training | - | 8.0 |
| Implementation Rating | 9.1 | 8.0 |
| Configurability | - | 7.0 |
| Data Sharing and Collaboration | - | 8.4 |
| Data Sources | - | 7.9 |
| Ease of integration | - | 10.0 |
| Product Scalability | - | 9.0 |
| Vendor post-sale | - | 10.0 |
| Vendor pre-sale | - | 10.0 |
| SmartSuite | Tableau Desktop | |
|---|---|---|
| Likelihood to Recommend |
|
|
| Pros |
|
|
| Cons |
|
|
| Likelihood to Renew |
|
|
| Usability |
|
|
| Reliability and Availability | No answers on this topic |
|
| Performance | No answers on this topic |
|
| Support Rating |
|
|
| In-Person Training | No answers on this topic |
|
| Online Training | No answers on this topic |
|
| Implementation Rating |
|
|
| Alternatives Considered | |
|
| Scalability | No answers on this topic |
|
| Return on Investment |
|
|
| ScreenShots | SmartSuite Screenshots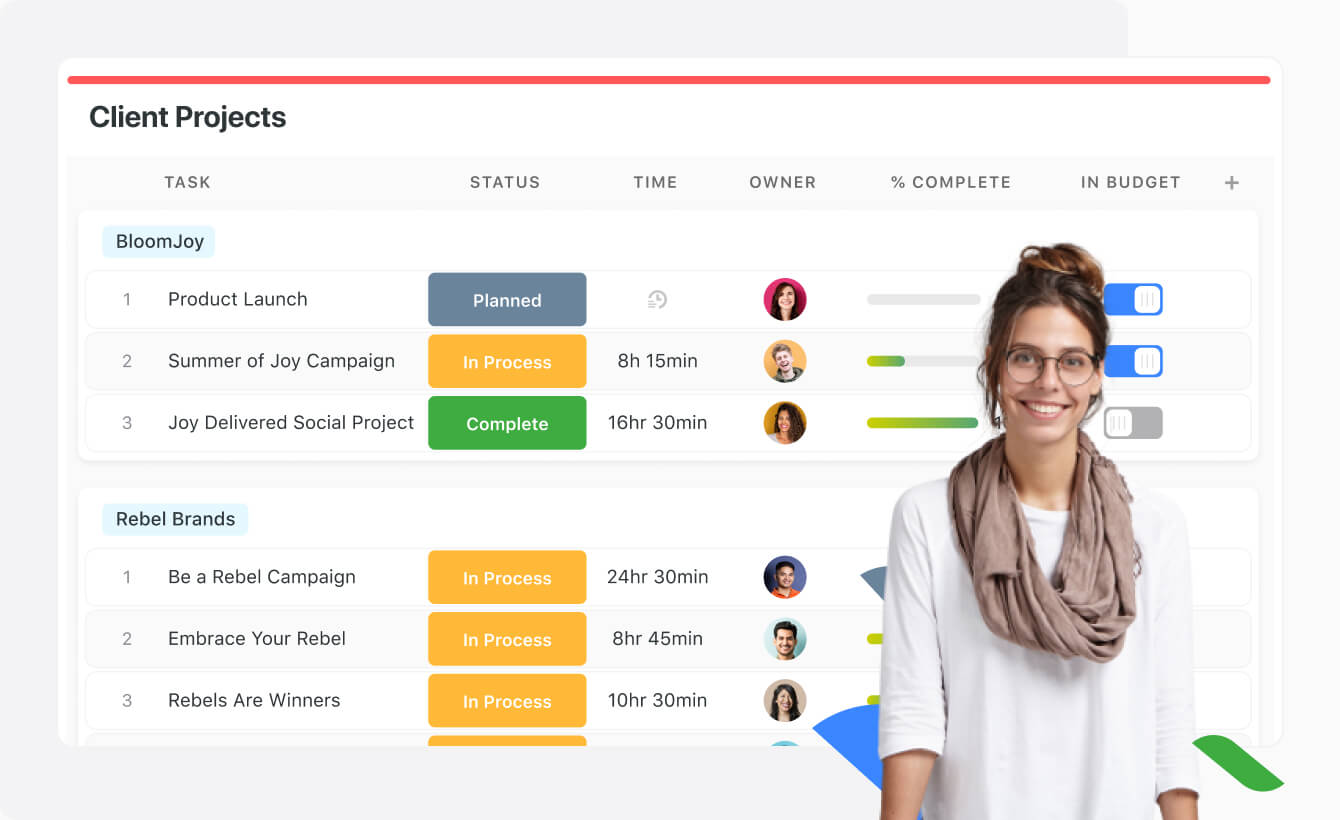    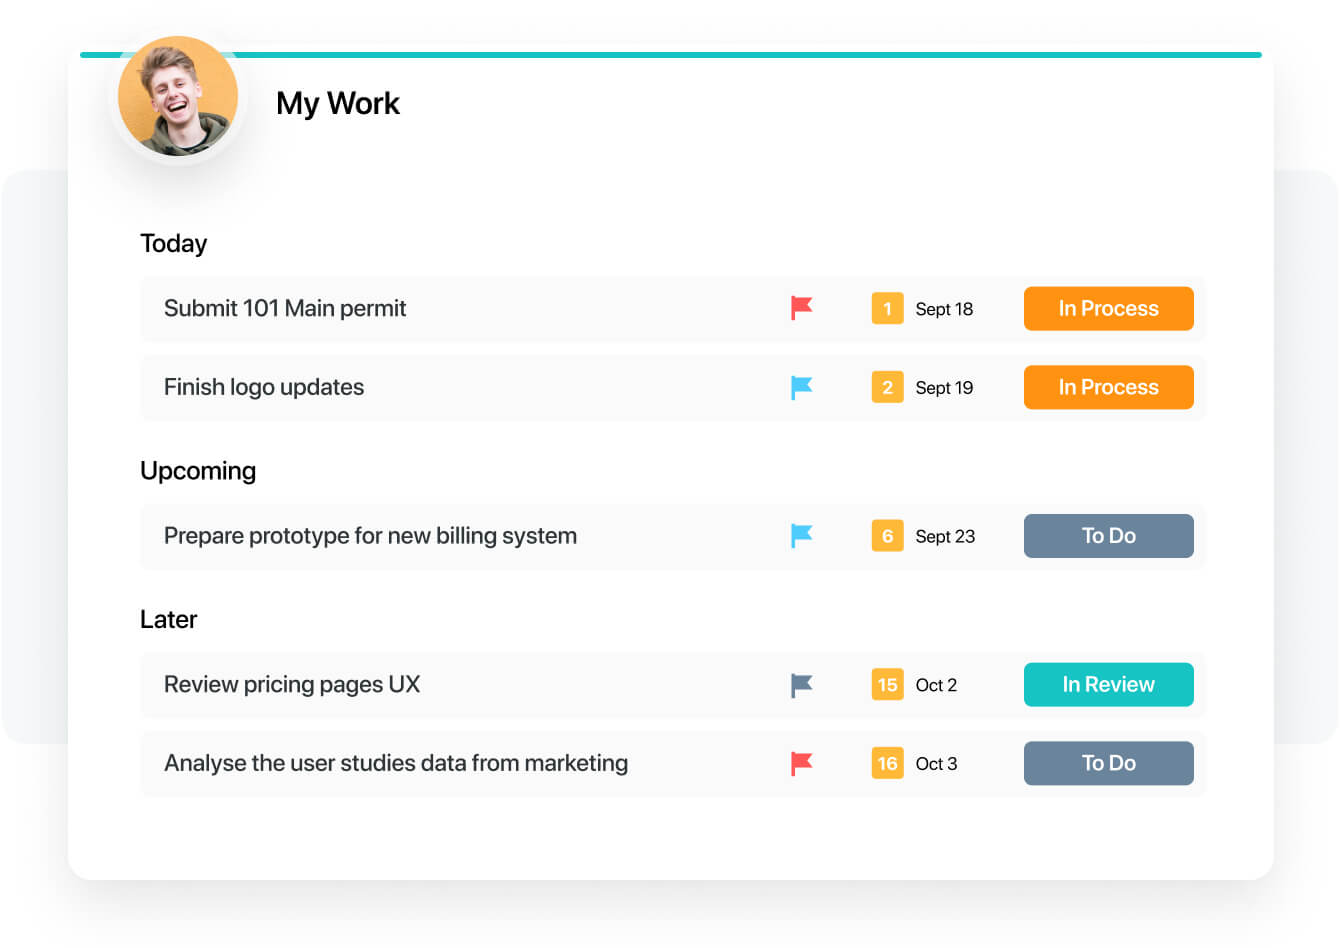  |


