#1 most frequent
United States of America
75.0%12 installations of 16


1 / 3
Screenshot of Project Discussions
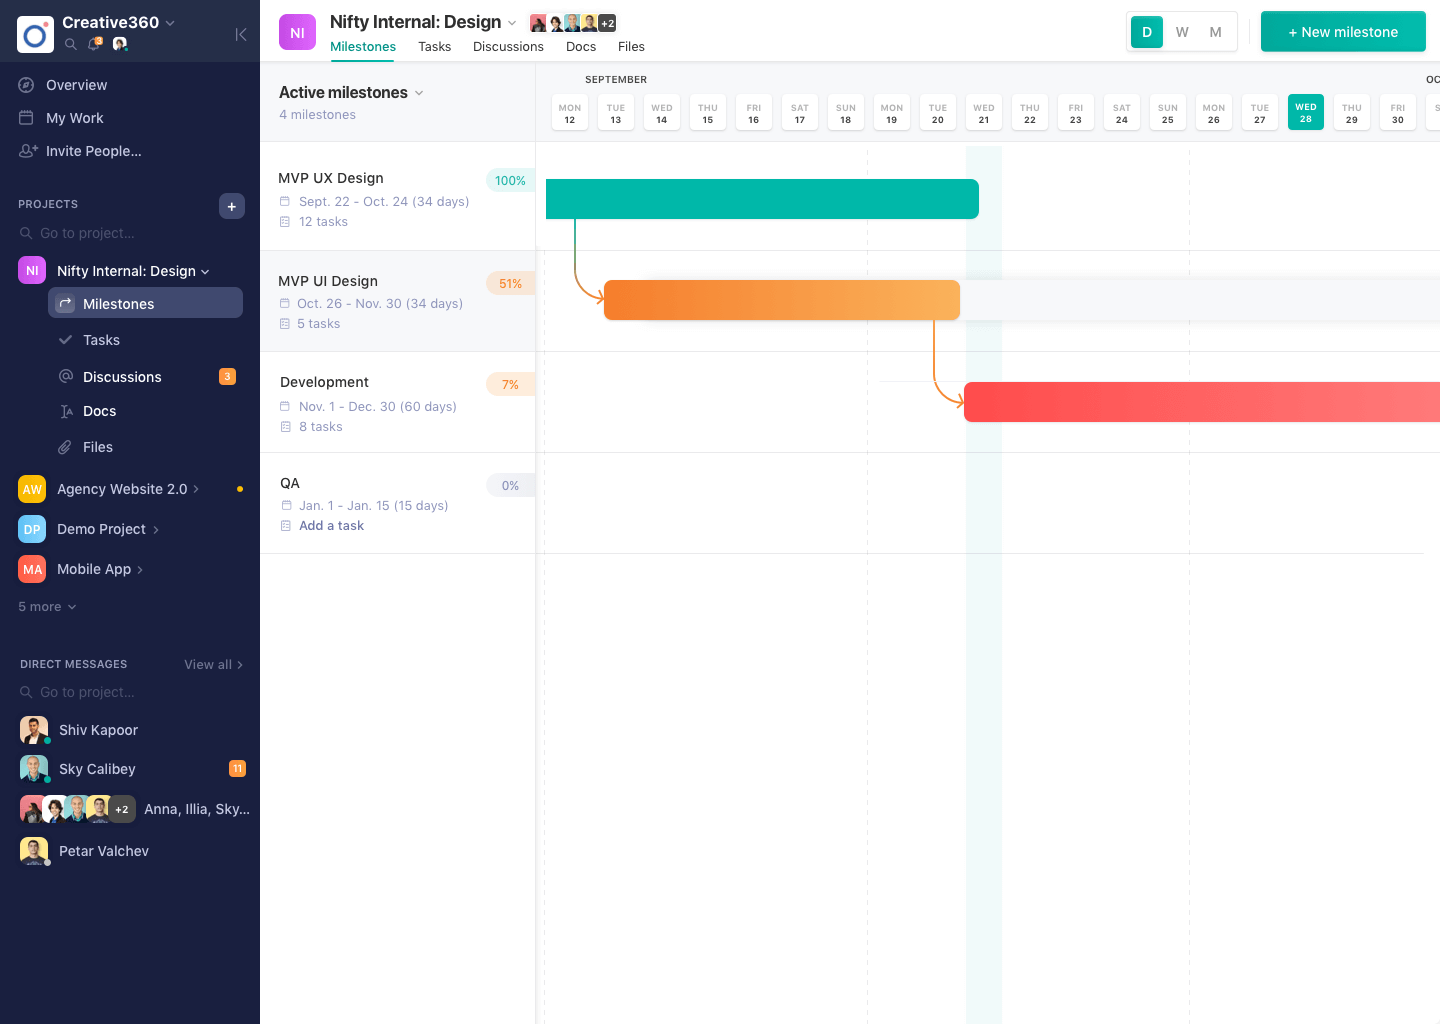
Gantt charts are charts that show tasks or events along the y-axis displayed against time along the x-axis.
Category average: 7.9
Scheduling capabilities allow users to set schedules on tasks, and create timelines and milestones.
Category average: 8.3
Team collaboration capabilities let team members work directly with each other and provide team updates.
Category average: 8.8
This includes the ability to plan, track, collaborate and report on tasks.
Category average: 9
Ability to create, manage and send project fee proposals to customers
Category average: 7.7
Timesheet tracking is the ability to track all billable and non-billable hours for each project.
Category average: 7.9
12 installations of 16
1 installation of 16
1 installation of 16