Amazon CloudWatch is a native AWS monitoring tool for AWS programs. It provides data collection and resource monitoring capabilities.
$0
per canary run
Heap
Score 8.2 out of 10
Mid-Size Companies (51-1,000 employees)
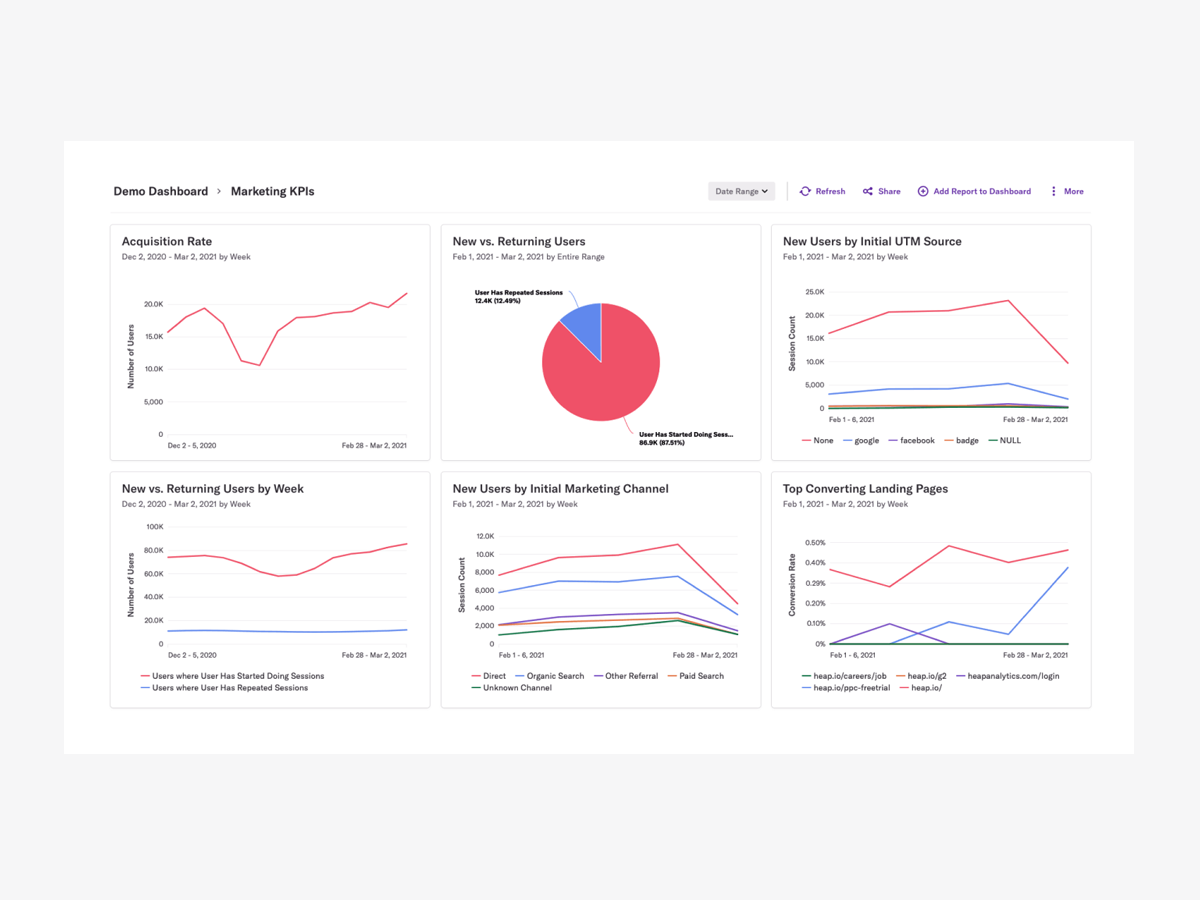
Heap is a web analytics platform captures every user interaction on web iOS with no extra code. The tool allows you to track events and set up funnels to understand user flow and dropoff. It also provides visualization tools to track trends over time.
$0
per month
Pricing
Amazon CloudWatch
Heap
Editions & Modules
Canaries
$0.0012
per canary run
Logs - Analyze (Logs Insights queries)
$0.005
per GB of data scanned
Over 1,000,000 Metrics
$0.02
per month
Contributor Insights - Matched Log Events
$0.02
per month per one million log events that match the rule
Logs - Store (Archival)
$0.03
per GB
Next 750,000 Metrics
$0.05
per month
Next 240,000 Metrics
$0.10
per month
Alarm - Standard Resolution (60 Sec)
$0.10
per month per alarm metric
First 10,000 Metrics
$0.30
per month
Alarm - High Resolution (10 Sec)
$0.30
per month per alarm metric
Alarm - Composite
$0.50
per month per alarm
Logs - Collect (Data Ingestion)
$0.50
per GB
Contributor Insights
$0.50
per month per rule
Events - Custom
$1.00
per million events
Events - Cross-account
$1.00
per million events
CloudWatch RUM
$1
per 100k events
Dashboard
$3.00
per month per dashboard
CloudWatch Evidently - Events
$5
per 1 million events
CloudWatch Evidently - Analysis Units
$7.50
per 1 million analysis units
Free
$0
Up to 10k sessions/month
Growth
Starting at $3,600 annually
Up to 300k sessions/year
Pro
Contact Heap Sales
Custom sessions per month and unlimited projects
Premier
Contact Heap Sales
Custom sessions per month
Offerings
Pricing Offerings
Amazon CloudWatch
Heap
Free Trial
Yes
Yes
Free/Freemium Version
Yes
Yes
Premium Consulting/Integration Services
Yes
Yes
Entry-level Setup Fee
No setup fee
Optional
Additional Details
With Amazon CloudWatch, there is no up-front commitment or minimum fee; you simply pay for what you use. You will be charged at the end of the month for your usage.
Heap pricing is based on session volume. A session is a period of activity from a single user on your app or website. It can include many pageviews or events.
For out business we find that AWS Cloudwatch is good at providing real-time metrics for monitoring and analysing the performance and usage of our platform by customers. It is possible to create custom metrics from log events, such people adding items to a basket, checking out or abandoning their orders.
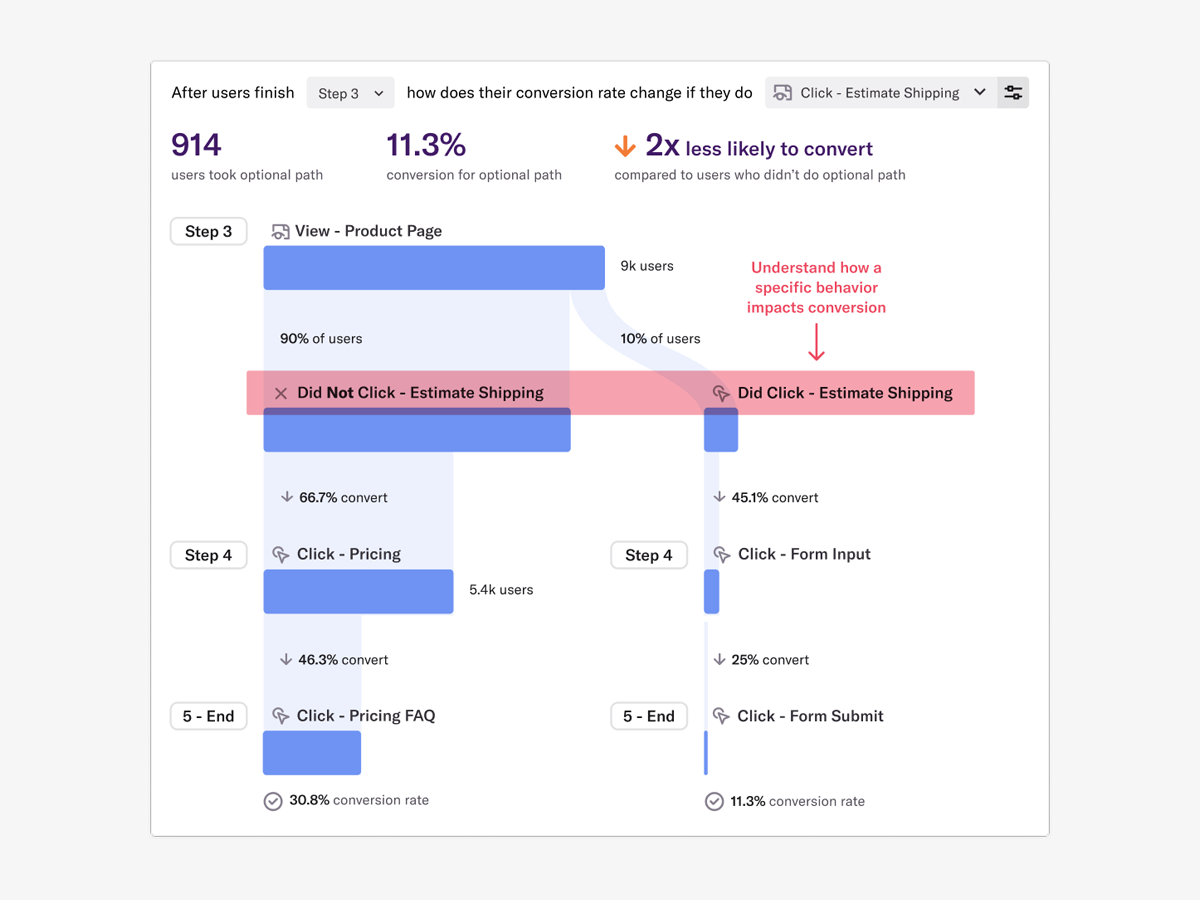
Scenarios when Heap was well suited: It is when a user claims that he encountered a bug without giving us the details of the error message. Scenarios where it is less appropriate: Its when we try to capture user interaction in our mobile app
It provides lot many out of the box dashboard to observe the health and usage of your cloud deployments. Few examples are CPU usage, Disk read/write, Network in/out etc.
It is possible to stream CloudWatch log data to Amazon Elasticsearch to process them almost real time.
If you have setup your code pipeline and wants to see the status, CloudWatch really helps. It can trigger lambda function when certain cloudWatch event happens and lambda can store the data to S3 or Athena which Quicksight can represent.
Memory metrics on EC2 are not available on CloudWatch. Depending on workloads if we need visibility on memory metrics we use Solarwinds Orion with the agent installed. For scalable workloads, this involves customization of images being used.
Visualization out of the box. But this can easily be addressed with other solutions such as Grafana.
By design, this is only used for AWS workloads so depending on your environment cannot be used as an all in one solution for your monitoring.
It's a great platform. I'm glad that one of our product managers introduced it because it has allowed us to create all kinds of new functionality. We're not only able to create a better product experience from our communications because of Heap, but we're also able to generate all kinds of helpful analysis.
It's excellent at collecting logs. It's easy to set up. The viewing & querying part could be much better, though. The query syntax takes some time to get used to, & the examples are not helpful. Also, while being great, Log Insights requires manual picking of log streams to query across every time.
On a scale from 1-10, I find Heap to be incredibly user-friendly and easy to use. I enjoyed the training videos available and was quickly able to pick up how to create events and reports to track user interactions on our product. I would recommend Heap for its usability first and foremost.
I've never run into any issues with Heap's availability, Heap is always there when I need it. I haven't run into any issues like application errors or unplanned outages during my 2+ years of using Heap. Each and every time I log in to Heap I have a completely functional experience
Heap doesn't affect page load times considerably nor has a large impact [on] our overall score, as far as page loading times inside of the tool its pretty reliable to retrieve data as much as "instant" that it can be the delay seems to be on data getting tracked into the servers to be read but it's not significant.
Support is effective, and we were able to get any problems that we couldn't get solved through community discussion forums solved for us by the AWS support team. For example, we were assisted in one instance where we were not sure about the best metrics to use in order to optimize an auto-scaling group on EC2. The support team was able to look at our metrics and give a useful recommendation on which metrics to use.
Heap support has allowed us to troubleshoot and test a lot of different items. Their support team is always helpful and friendly, even when we come to them with the most complicated questions. I think this greatly improves the value proposition of the product because their support team is knowledgable and friendly.
The implementation was smooth and easy. The Heap team helped us with implementation and it went great! Within a few weeks, we were fully up and running and utilizing the platform to its full capability. This is an additional thing that has made this platform so great and we couldn't recommend it enough.
Grafana is definitely a lot better and flexible in comparison with Amazon CloudWatch for visualisation, as it offers much more options and is versatile. VictoriaMetrics and Prometheus are time-series databases which can do almost everything cloudwatch can do in a better and cheaper way. Integrating Grafana with them will make it more capable Elasticsearch for log retention and querying will surpass cloudwatch log monitoring in both performance and speed
Heap offers a ton of functionality on a single platform.It also has an smart data science layer to offers suggestions for next steps in the analysis, allowing us to explore alternative paths we may not think to take. The low-code option for updating data is appealing, and there is a lot of automation with minimal engineering effort.
The most challenging part of using Heap in a growing organization is the naming and structure in which reports and dashboards are organized. I work within the marketing department and our Heap leader internally works within the IT/Product department, which makes it challenging because we often don't speak the same language, so the learning curve has been steep without any specific use-case examples to leverage online.