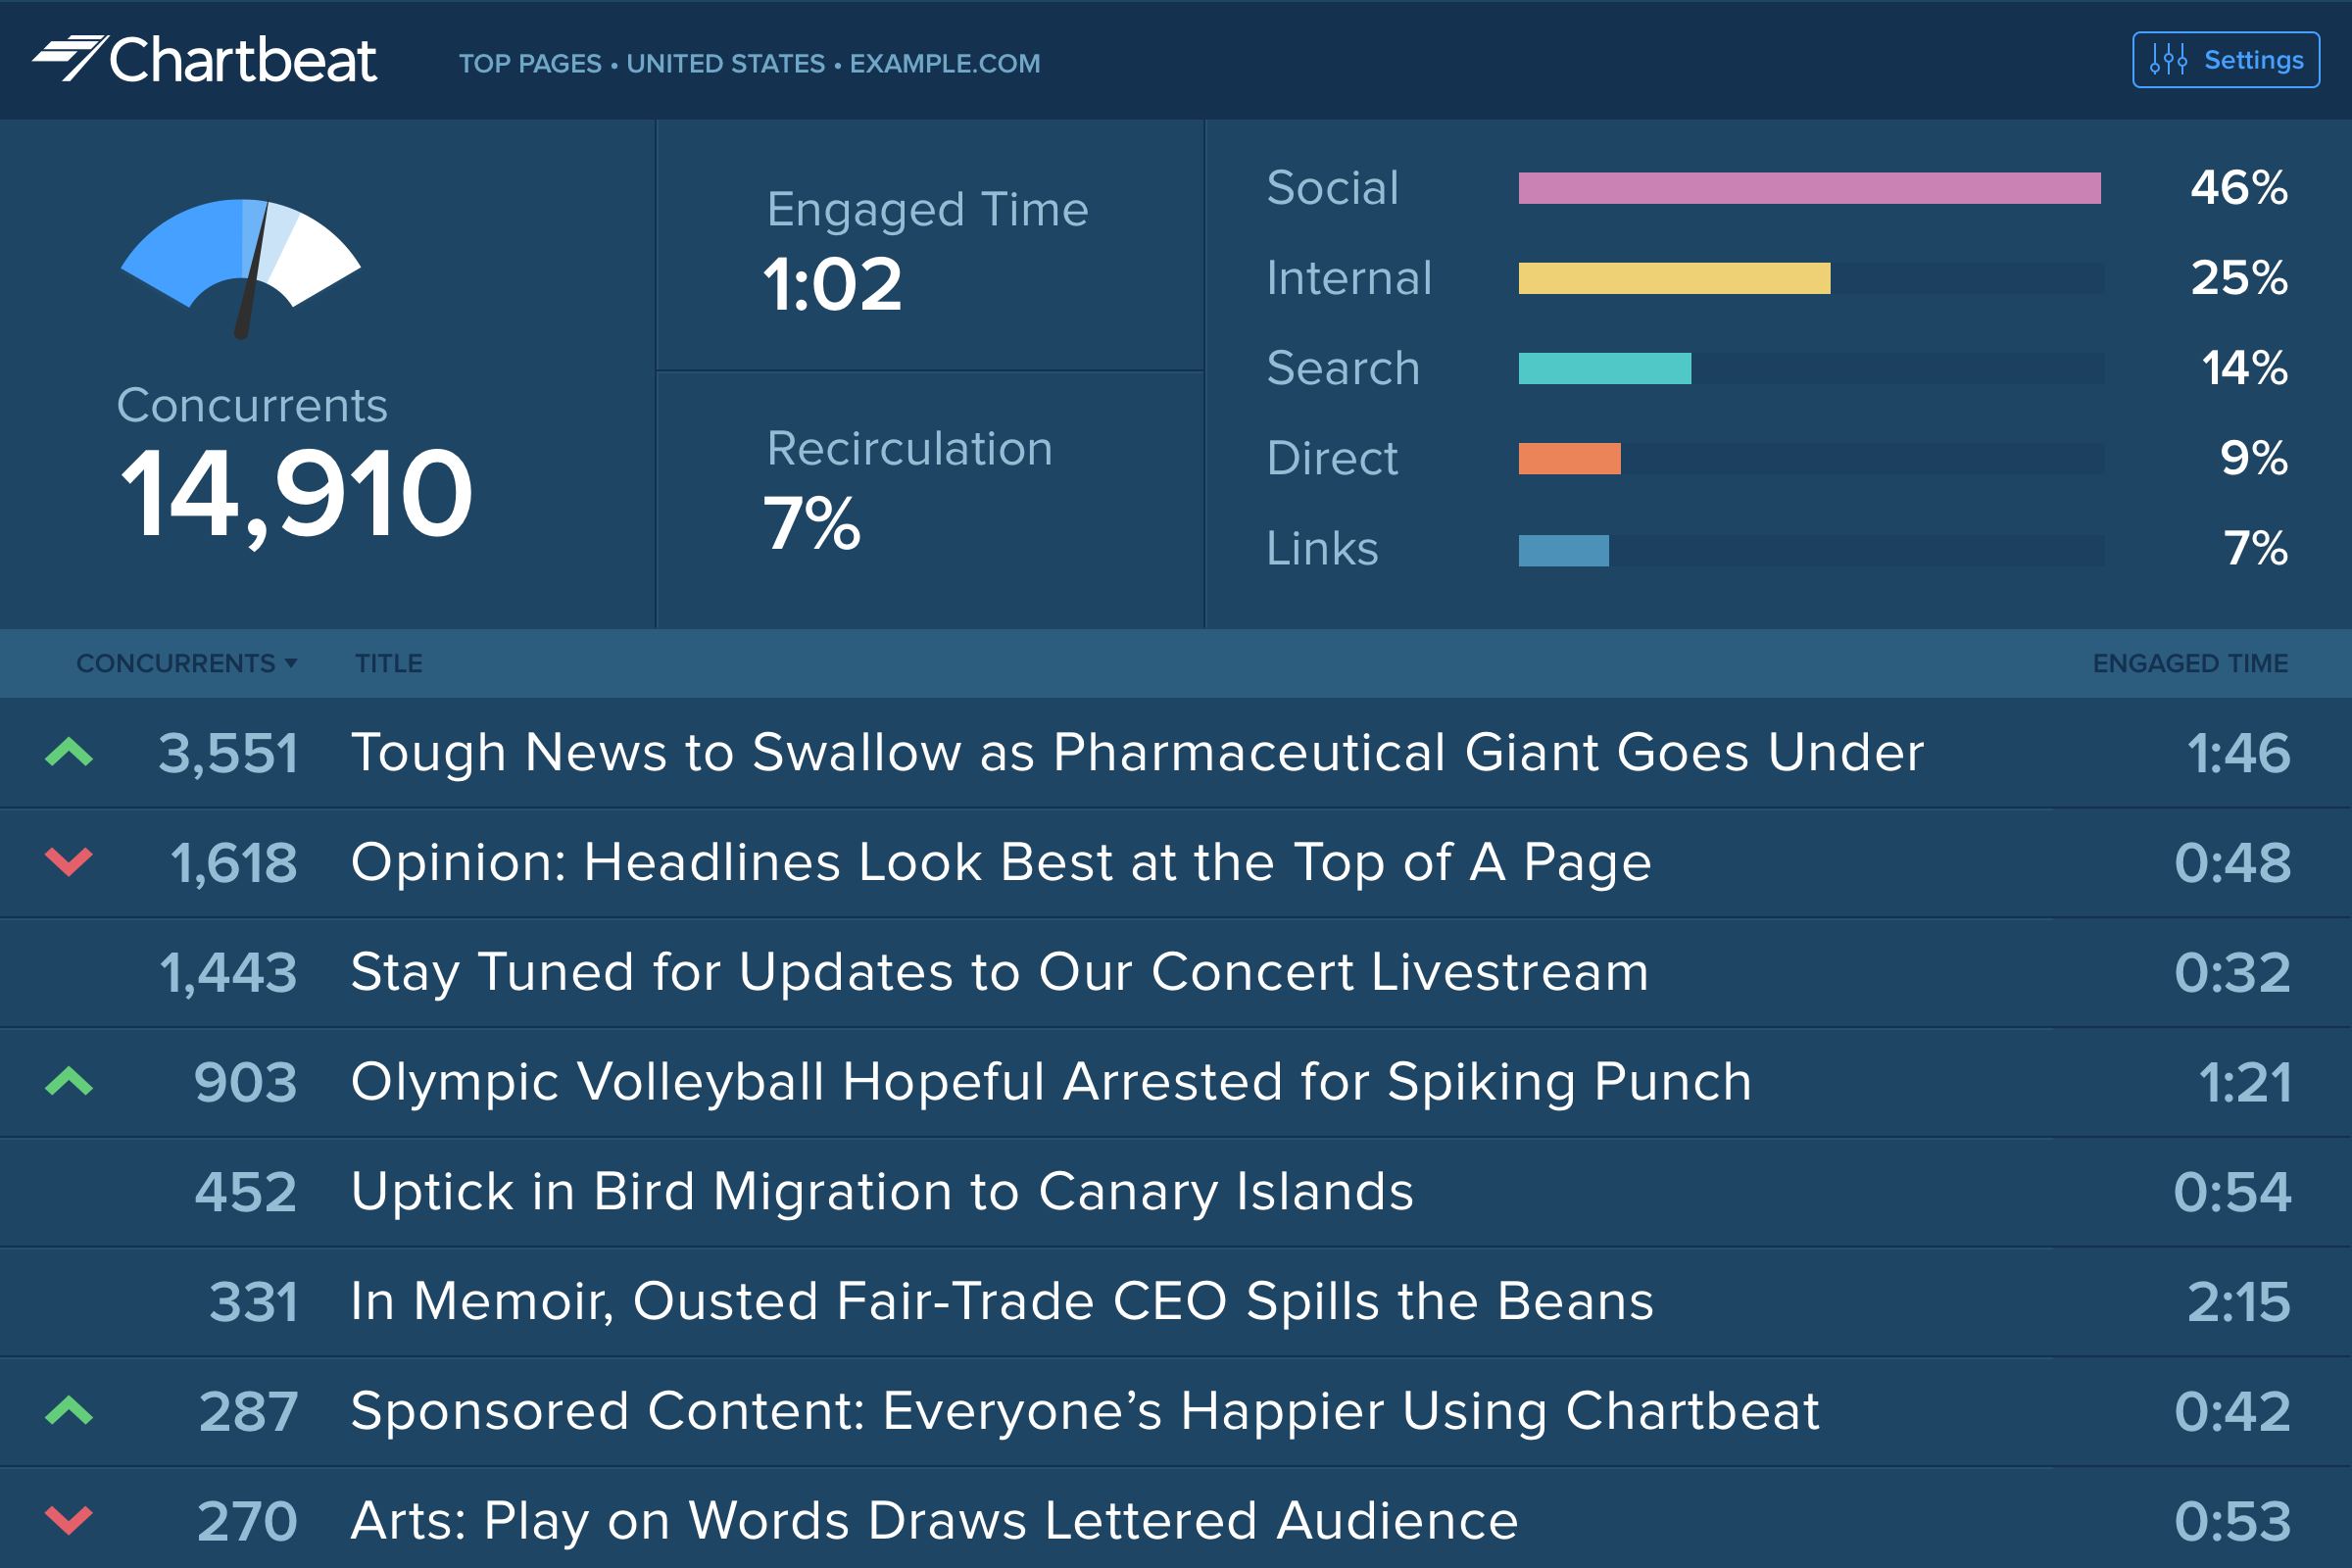
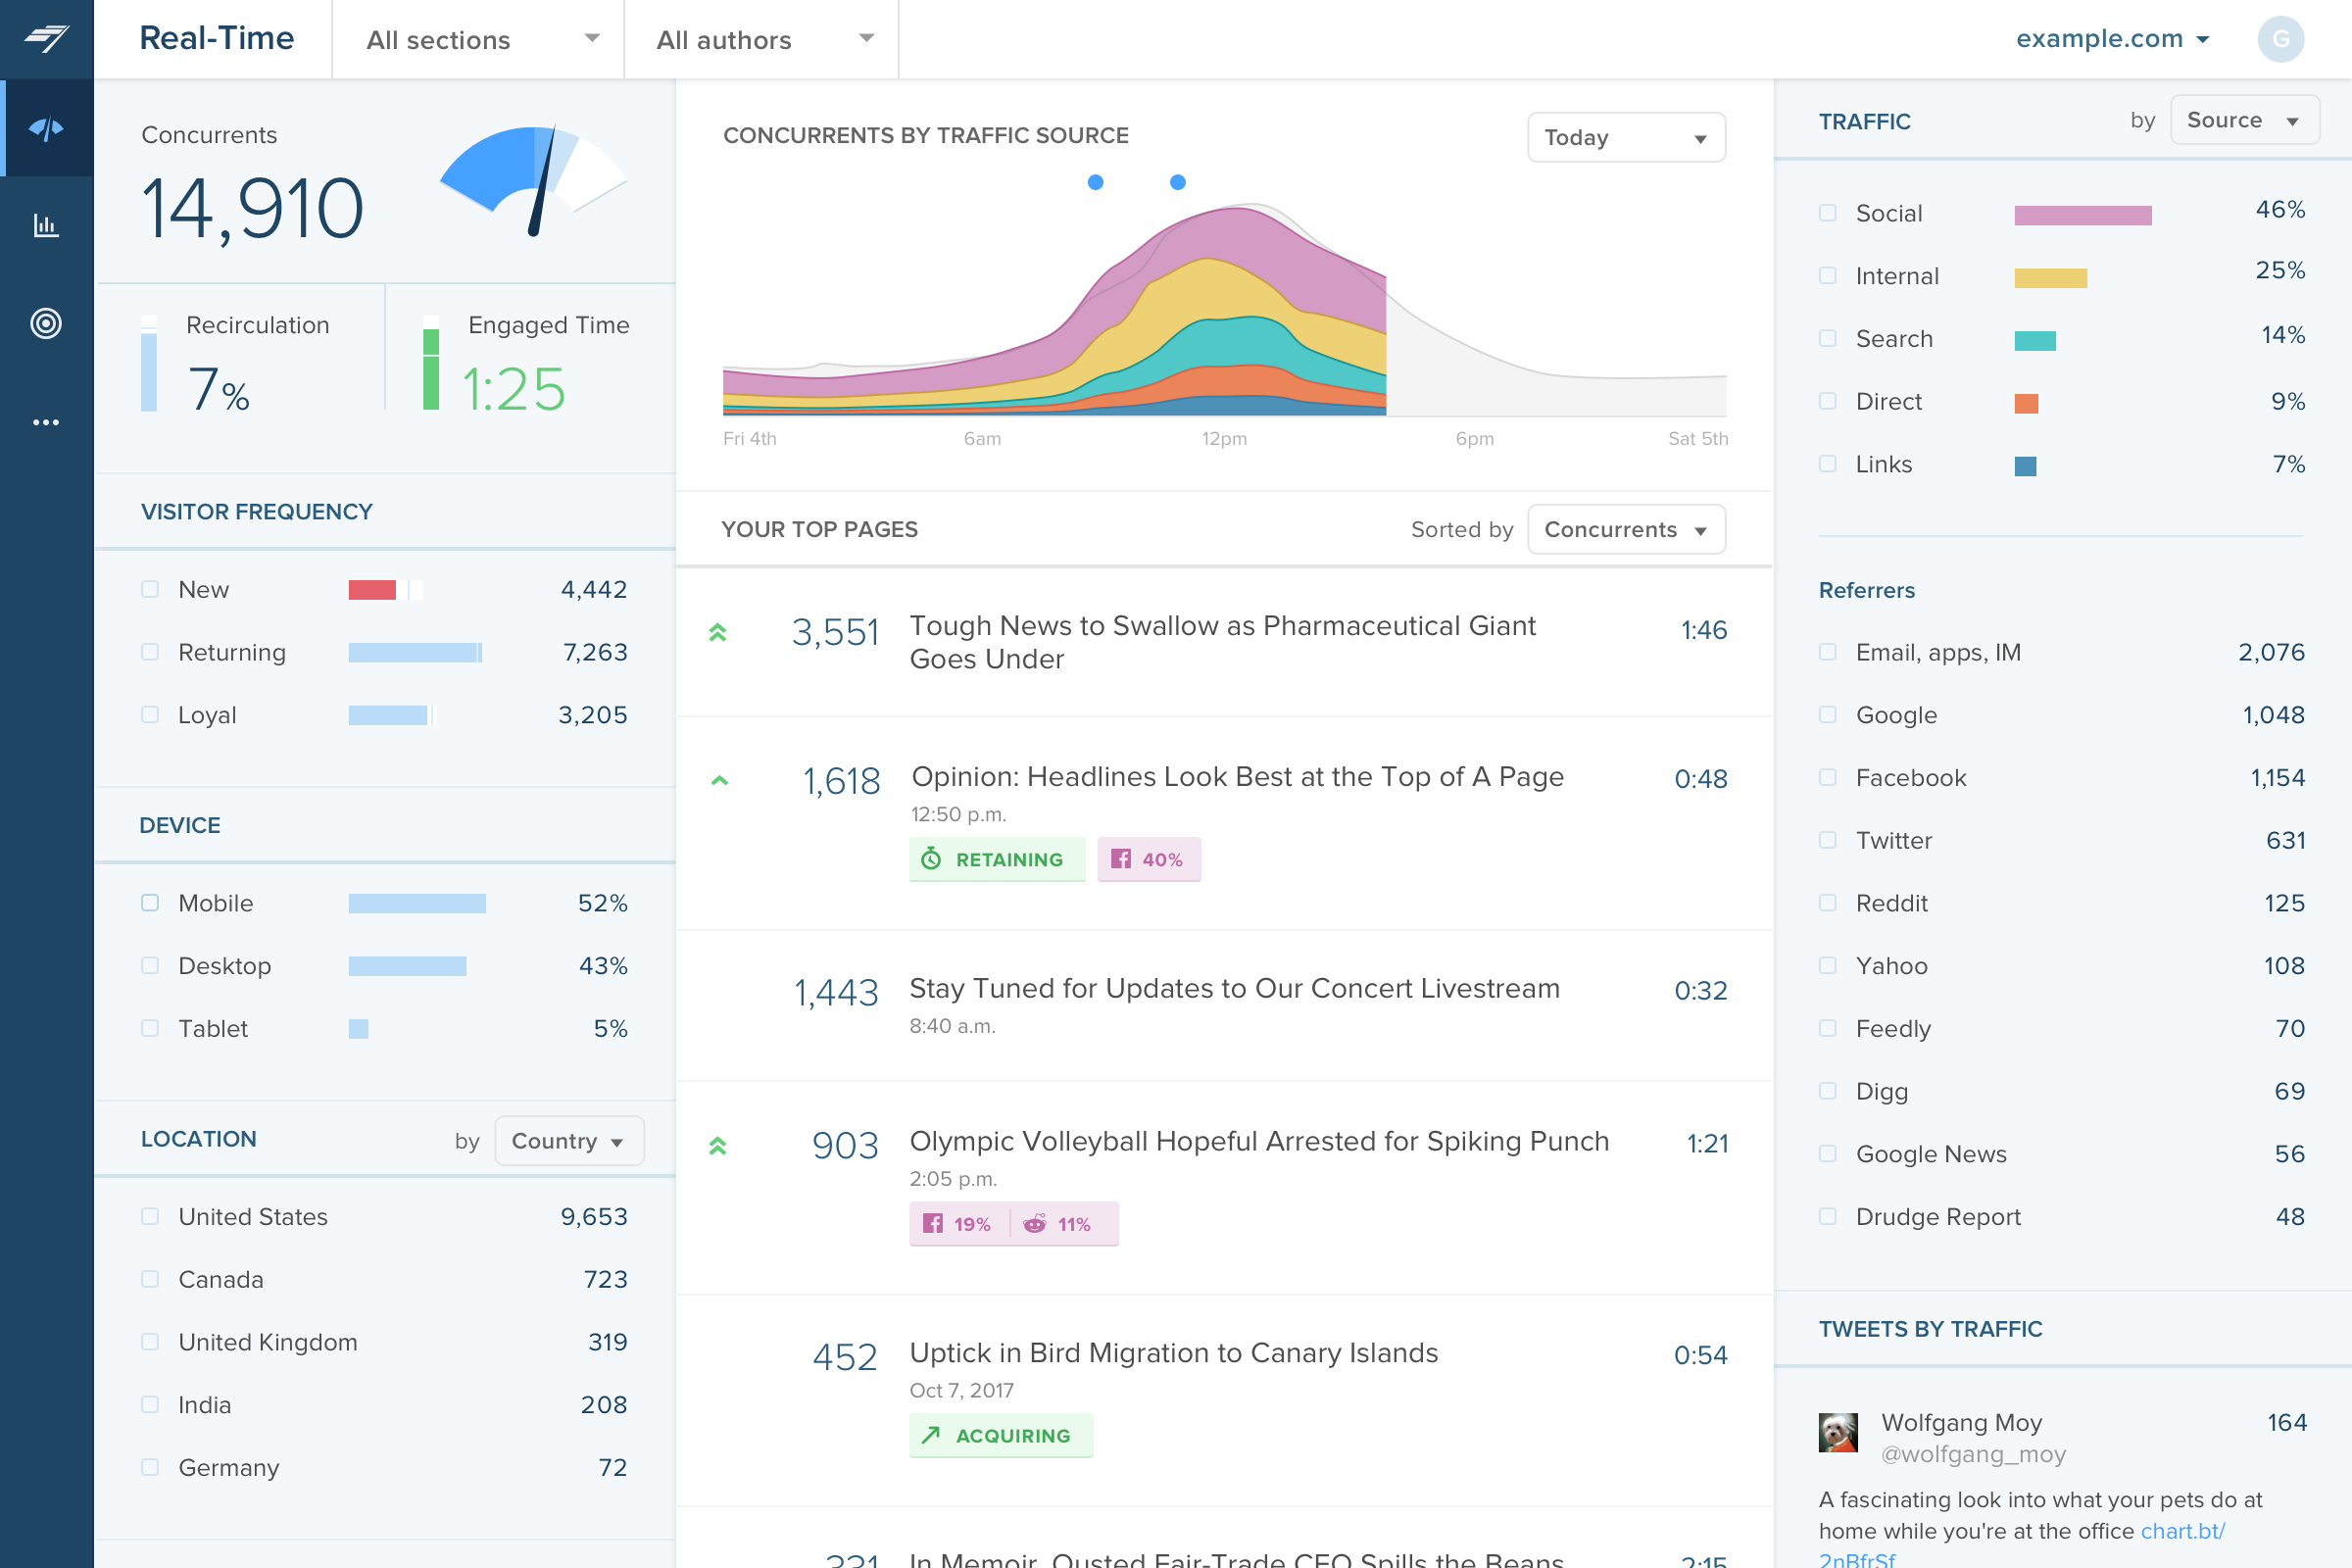
Chartbeat delivers real-time analytics, insights, and transformative tools for content teams around the world, to help improve audience engagement, inform editorial decisions, and increase loyalty.
N/A
Piano Analytics
Score7.2 out of 10
Mid-Size Companies (51-1,000 employees)
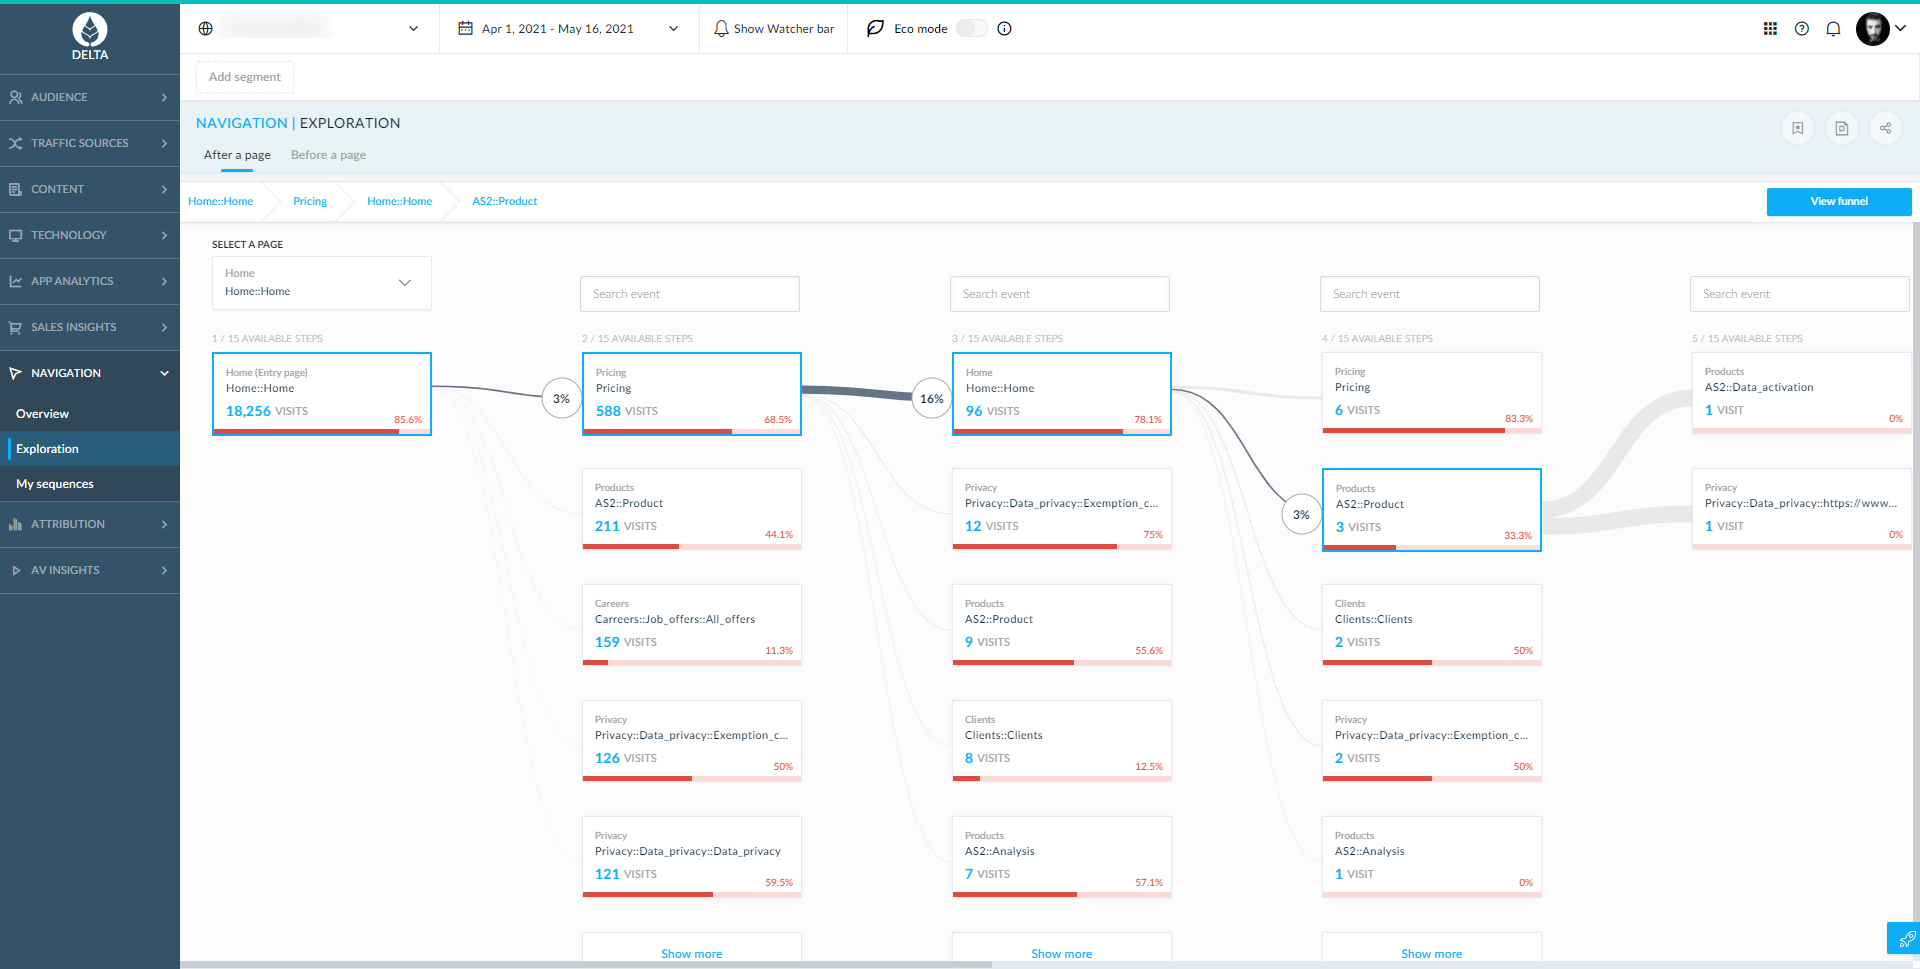
Piano Analytics, formerly AT Internet, provides digital analytics to help customers measure their audience, optimise their digital performance and create value. From data collection to exploration, activation, and the sharing of actionable insights, the Piano Analytics Suite is designed to provide reliable high-quality data to enhance decision-making company-wide. Adapted to e-commerce, media, finance/banking, and corporate websites & mobile apps, the vendor promises an easy-to-use solution…
$430
per server calls consumption
Pricing
Chartbeat
Piano Analytics
Editions & Modules
No answers on this topic
Business
$430
per server calls consumption
Premium
Contact us
per server calls consumption
Offerings
Pricing Offerings
Chartbeat
Piano Analytics
Free Trial
Yes
Yes
Free/Freemium Version
No
No
Premium Consulting/Integration Services
Yes
Yes
Entry-level Setup Fee
No setup fee
$430 per server calls consumption
Additional Details
Chartbeat pricing is based on monthly site page views. Discounts are applied to multi-year contracts. The Basic Plan includes the Real-time Dashboard, Historical Dashboard, Heads Up Display, Reports, Big Board, iOS and Android app, and Real-time API endpoints.
The Plus Plan includes all of the Basic Plan features, plus ONE of the following Premium features: Headline Testing, Advanced Queries, or Multi-Site View.
The Premium Plan includes all of the Basic Plan features, plus ALL Premium features: Headline Testing, Advanced Queries, Multi-Site View, and enterprise-level support and custom trainings.
Google Analytics obviously benefits from more functionality, the ability to track users and also integrate commercial revenue on the 360 GA - which would be a fantastic feature. In the tender process, GA did not have the …
A de minimis incentive was given to thank the reviewer for their time. The incentive was not used to bias or drive a particular response, nor was the incentive contingent on a positive endorsement. TR verified that a representative sample of customers was invited. More Info
Verified User
Chose Piano Analytics
AT Internet is more comprehensive and provides a lot of filters in easy ways, especially for websites that has various subdomains and pages used for different purposes. Also, the trend analysis and the ability to create reports and design them the way we want is very, very …
A de minimis incentive was given to thank the reviewer for their time. The incentive was not used to bias or drive a particular response, nor was the incentive contingent on a positive endorsement. TR verified that a representative sample of customers was invited. More Info
The main point of benefit is the realtime data. This is vital to our team as we are publishing a lot of content per day, so we have a busy homepage to manage and it's important to know which content is performing well. We also like to get an understanding as quickly as possible - which Chartbeat offers - of where traffic is coming from. Often we will see an example where a page is getting high traffic from Google, for example, and we know that might not need to be placed so prominently on the homepage because the traffic is arriving to us externally anyway. Without that depth of understanding what is performing best and why - updated immediately, unlike in Google Analytics now - our homepage would not be as well optimised for users coming to us direct
A de minimis incentive was given to thank the reviewer for their time. The incentive was not used to bias or drive a particular response, nor was the incentive contingent on a positive endorsement. More Info
When it comes to web analytics AT Internet is well suited. We introduced AT Internet in 2017 after an evaluation project with other professional analytics solutions. Starting with our corporate website we quickly rolled it out to our customer experience platform, our webshops, and our corporate intranet based on SharePoint 2013. Especially the use in our intranet brought significant improvements over the standard analytics features SP 2013 is offering. The ATI tag systems with their flexibility allow us to include company-specific properties and thus making it possible for us to analyze our intranet usage on segments such as locations, branches, and so on.
A de minimis incentive was given to thank the reviewer for their time. The incentive was not used to bias or drive a particular response, nor was the incentive contingent on a positive endorsement. TR verified that a representative sample of customers was invited. More Info
A de minimis incentive was given to thank the reviewer for their time. The incentive was not used to bias or drive a particular response, nor was the incentive contingent on a positive endorsement. TR verified that a representative sample of customers was invited. More Info
Source of traffic needs improvement. Search and social make sense, but "internal" and "links" is a grey area. It would be helpful to define those with an organization and provide an information icon so users can easily remember what each of those buckets is tracking.
More ways to customize the real-time board. For example, with video content, that's great that I can see a user has started a video, but what is the completion rate, was that only on O&O or can that track Facebook, too?
Would like to see demo (age) information included as a way to slice the data so I can see what's working with my older and younger demo.
A de minimis incentive was given to thank the reviewer for their time. The incentive was not used to bias or drive a particular response, nor was the incentive contingent on a positive endorsement. TR verified that a representative sample of customers was invited. More Info
Integrations with outside vendors: there are many ways to integrate data from outside vendors, however you can't display this information in every application unless you create a custom field, which can sometimes be limiting.
Access rights: there are two places to assign access rights and each place has slightly different functionality. You can get really granular with what each person has access to, but it is easy to miss a check box and have to go back and correct it.
Visualizations across applications: there are some really cool visualizations in the oldest application they support that includes predictive traffic estimates, automatic multi-period variations, etc., that aren't available yet in the newer applications.
I gave Chartbeat a 5 for a renewal rating, because, while it delivers clear and understandable content, Google Analytics also provides many of the same features for free. For a small to medium website, I believe it would be more cost effective to use Google Analytics. A website with a high amount of traffic, however, could merit spending the money on Chartbeat to maximize their potential.
I gave this rating because I think that AT Internet is a good tool, user-friendly easy for onboarding and simple dashboards, however the majority of people use Google Analytics, especially media agency, it is easier for them to use Google Analytics.
A de minimis incentive was given to thank the reviewer for their time. The incentive was not used to bias or drive a particular response, nor was the incentive contingent on a positive endorsement. TR verified that a representative sample of customers was invited. More Info
I am able to "set it and forget it," keeping it up on my monitor for either constant checking or just keeping an eye on the numbers during the day. I'm also able to keep track of what times are perfect to post a story and which stories rack up the most traffic.
A de minimis incentive was given to thank the reviewer for their time. The incentive was not used to bias or drive a particular response, nor was the incentive contingent on a positive endorsement. More Info
Overall the experience is very good, it's quick, relaiable and does everything I would want. The only problems I have are matching the correct stats to what I want. It can be painful trying to find the right thing and the explanations are not always the clearest. That's the only issue i've found though.
A de minimis incentive was given to thank the reviewer for their time. The incentive was not used to bias or drive a particular response, nor was the incentive contingent on a positive endorsement. More Info
I don't have any exemple in mind where AT Internet interface hasn't been available, i have always been able to use AT Internet when i needed it. The only issues to notice is that it happens sometimes that real time or D-1 datas are partially delayed.
A de minimis incentive was given to thank the reviewer for their time. The incentive was not used to bias or drive a particular response, nor was the incentive contingent on a positive endorsement. TR verified that a representative sample of customers was invited. More Info
A de minimis incentive was given to thank the reviewer for their time. The incentive was not used to bias or drive a particular response, nor was the incentive contingent on a positive endorsement. TR verified that a representative sample of customers was invited. More Info
I have had limited experience of support for Chartbeat but whenever I have needed help it has been there. Recently there was an issue of seeing different forms of data in real time - app and otherwise effectively, and the issue was being clearly dealt with and communicated back to us.
A de minimis incentive was given to thank the reviewer for their time. The incentive was not used to bias or drive a particular response, nor was the incentive contingent on a positive endorsement. More Info
I have not used the Support Team thereby I am unable to review how their Support Teams works. However, in an instance where I had an issue, my concerned department contacted their support team and I was provided with the solution of the problem I was facing within a short span of time.
A de minimis incentive was given to thank the reviewer for their time. The incentive was not used to bias or drive a particular response, nor was the incentive contingent on a positive endorsement. TR verified that a representative sample of customers was invited. More Info
The in-person training unfortunately does not match to our expectations, was too much focus on digital basis and not on AT Internet functionnalties and how to use it. We paid for one day and only 15 minutes at the end was focused on our real needs in terms of media analytics.
A de minimis incentive was given to thank the reviewer for their time. The incentive was not used to bias or drive a particular response, nor was the incentive contingent on a positive endorsement. TR verified that a representative sample of customers was invited. More Info
A de minimis incentive was given to thank the reviewer for their time. The incentive was not used to bias or drive a particular response, nor was the incentive contingent on a positive endorsement. TR verified that a representative sample of customers was invited. More Info
A de minimis incentive was given to thank the reviewer for their time. The incentive was not used to bias or drive a particular response, nor was the incentive contingent on a positive endorsement. TR verified that a representative sample of customers was invited. More Info
Omnilytics is more robust, detailed, and catered for an intermediate media user, while I think Chartbeat is a more user-friendly and beginner-oriented piece of technology. That being said, there is an impressive amount of lift for Chartbeat, and it's evident that simplicity is the key to using a software daily (which is absolutely the point in the content world).
A de minimis incentive was given to thank the reviewer for their time. The incentive was not used to bias or drive a particular response, nor was the incentive contingent on a positive endorsement. More Info
AT Internet shows a deep understanding of our business objectives and provide us with ideas on how to solve them. They grant us enough time to try their tools and to be sure the tools are helpful. The data we've got in the Analyzer was manually checked and it was completely correct. Their roadmap was clean and aligned with our strategy
Regarding AT Internet possibilities, it could be adapted to small or large organizations, easy to set up. We can add sites in makets that we launch e-commerce.
A de minimis incentive was given to thank the reviewer for their time. The incentive was not used to bias or drive a particular response, nor was the incentive contingent on a positive endorsement. TR verified that a representative sample of customers was invited. More Info
A de minimis incentive was given to thank the reviewer for their time. The incentive was not used to bias or drive a particular response, nor was the incentive contingent on a positive endorsement. More Info
Unfortunately, I do not have precise results to give, but the statistics provided by AT Internet make it possible to carry out in-depth analyses and to make good decisions.
You just have to know how to find the information and interpret it.
A de minimis incentive was given to thank the reviewer for their time. The incentive was not used to bias or drive a particular response, nor was the incentive contingent on a positive endorsement. TR verified that a representative sample of customers was invited. More Info