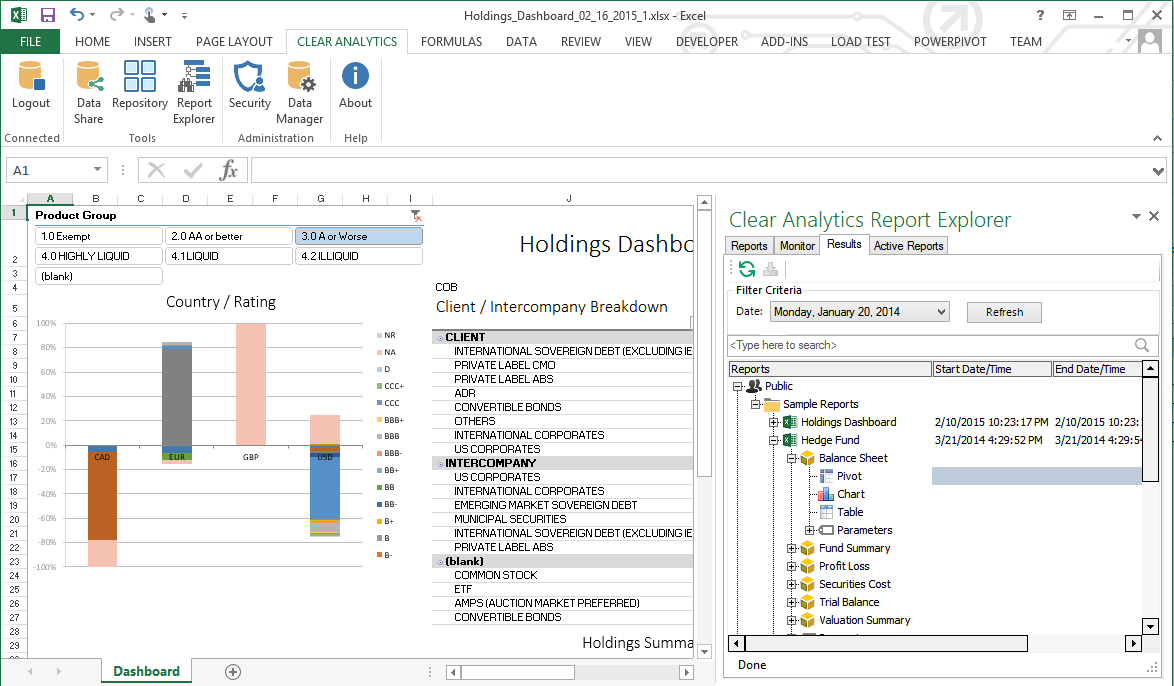
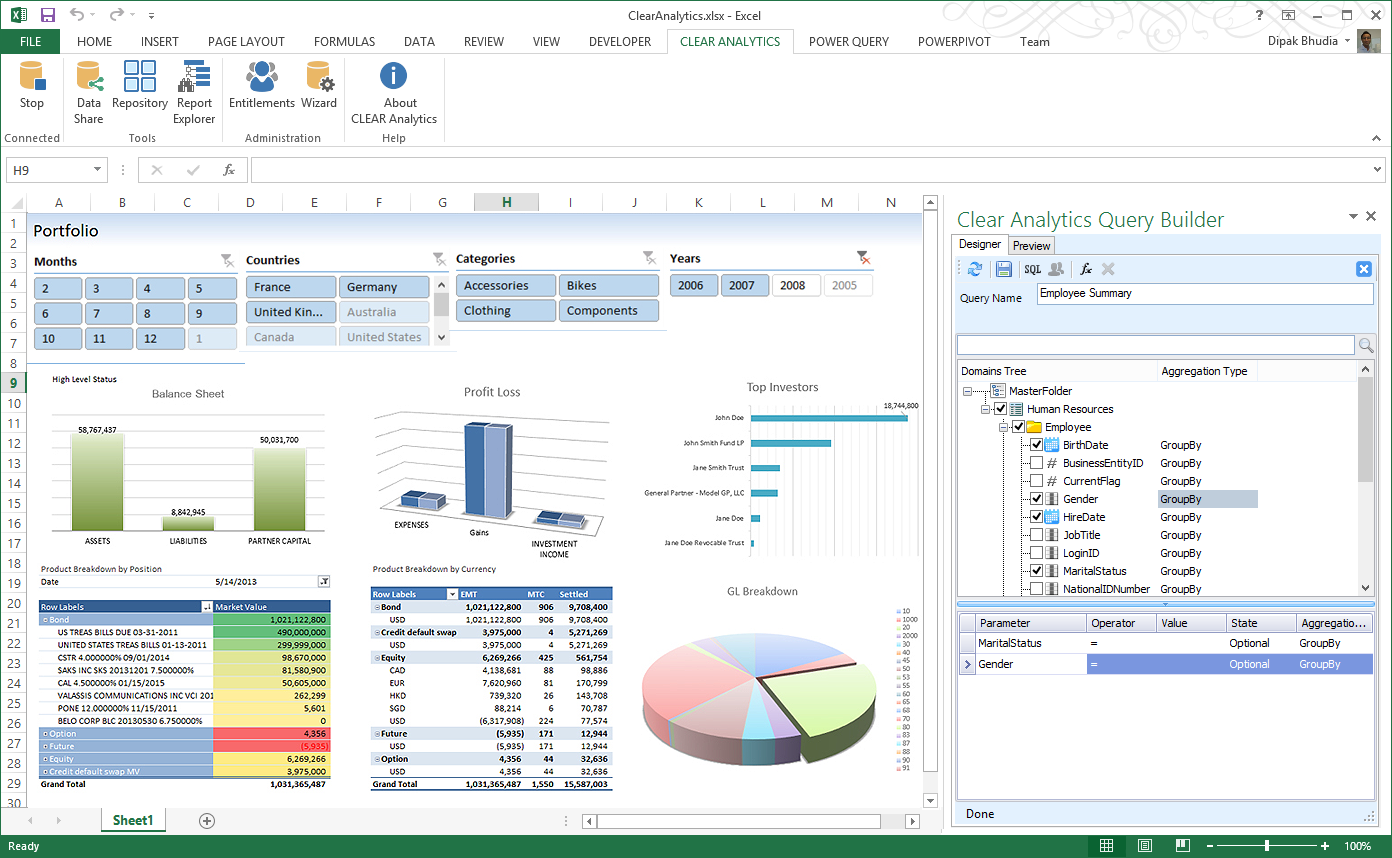
Clear Analytics is a business intelligence solution that enables non technical end users to perform analytics by leveraging existing knowledge of Excel coupled with a built in query builder. Some key features include: Dynamic Data Refresh, Data Share and In-Excel Collaboration.
$29
Per Seat per Month
Microsoft BI (MSBI)
Score 8.7 out of 10
N/A
Microsoft BI is a business intelligence product used for data analysis and generating reports on server-based data. It features unlimited data analysis capacity with its reporting engine, SQL Server Reporting Services alongside ETL, master data management, and data cleansing.
$14
per month per user
Cyfe
Score 4.0 out of 10
N/A
Cyfe is all-in-one dashboard software for analyzing data from online services like Google Analytics, Salesforce, AdSense, MailChimp, Amazon, Facebook, etc, from Traject.
$29
per month
Pricing
Clear Analytics
Microsoft BI (MSBI)
Cyfe, by Traject
Editions & Modules
Personal
$29
Per Seat per Month
Team
$165
upto 10 Seat per Month
Department
$265
upto 25 Seat per month
Organization
$565
Upto 100 per seat per month
Power BI Pro
$14
per month per user
Power BI Premium
$24
per month per user
Starter
$29
per month
Standard
$39
per month
Pro
$65
per month
Premier
$119
per month
Offerings
Pricing Offerings
Clear Analytics
Microsoft BI (MSBI)
Cyfe
Free Trial
Yes
No
Yes
Free/Freemium Version
No
Yes
No
Premium Consulting/Integration Services
Yes
No
No
Entry-level Setup Fee
$800 Initial OnBoarding
No setup fee
No setup fee
Additional Details
Certain Enterprise level features can be made available to Small Business edition at additional cost. Such services include Scheduler and OLAP connectivity.
Custom adapters can also be created to connect to SaaS services.
—
—
More Pricing Information
Community Pulse
Clear Analytics
Microsoft BI (MSBI)
Cyfe, by Traject
Features
Clear Analytics
Microsoft BI (MSBI)
Cyfe, by Traject
BI Standard Reporting
Comparison of BI Standard Reporting features of Product A and Product B
Clear Analytics
9.0
8 Ratings
9% above category average
Microsoft BI (MSBI)
9.5
51 Ratings
15% above category average
Cyfe, by Traject
6.6
28 Ratings
22% below category average
Pixel Perfect reports
9.08 Ratings
9.344 Ratings
6.817 Ratings
Customizable dashboards
9.18 Ratings
9.651 Ratings
4.028 Ratings
Report Formatting Templates
8.78 Ratings
9.649 Ratings
9.120 Ratings
Ad-hoc Reporting
Comparison of Ad-hoc Reporting features of Product A and Product B
Clear Analytics
8.9
8 Ratings
10% above category average
Microsoft BI (MSBI)
9.1
51 Ratings
13% above category average
Cyfe, by Traject
7.2
26 Ratings
11% below category average
Drill-down analysis
9.28 Ratings
9.346 Ratings
8.715 Ratings
Formatting capabilities
8.78 Ratings
8.951 Ratings
8.120 Ratings
Report sharing and collaboration
8.98 Ratings
8.651 Ratings
2.026 Ratings
Integration with R or other statistical packages
00 Ratings
9.540 Ratings
10.09 Ratings
Report Output and Scheduling
Comparison of Report Output and Scheduling features of Product A and Product B
Clear Analytics
9.0
8 Ratings
9% above category average
Microsoft BI (MSBI)
9.3
50 Ratings
12% above category average
Cyfe, by Traject
5.0
23 Ratings
49% below category average
Publish to Web
9.08 Ratings
9.346 Ratings
4.015 Ratings
Publish to PDF
9.17 Ratings
9.346 Ratings
4.021 Ratings
Report Versioning
8.98 Ratings
9.042 Ratings
6.89 Ratings
Report Delivery Scheduling
8.87 Ratings
9.345 Ratings
1.017 Ratings
Delivery to Remote Servers
00 Ratings
9.525 Ratings
9.04 Ratings
Data Discovery and Visualization
Comparison of Data Discovery and Visualization features of Product A and Product B
Clear Analytics has almost all the features which are mostly required by the organizations for their data analytics and transformation activities. Clear Analytics is built on the support of a parallel query engine which makes it handle large volume requests and also provides optimized results. However, every solution has some limitations, Clear Analytics lacks advanced features such as Predictive Analytics which is a very demanding feature in the market as most organizations are adopting AI/ML automation for their businesses. Also, it needs to add a lot of advanced visualizations so that the user has the choice of selection. Overall a good solution to be recommended.
Microsoft BI has a lot of features and is a very powerful tool, especially if you have folks on your team that know how to utilize all of its capabilities. To truly unlock all that it can do, it does require people to have a deep understanding of its capabilities. That's where the software really shines. If you are looking for a simpler, more basic reporting tool, there are other programs available that do not require such a steep learning curve.
Cyfe might be for you if you are looking for a cost-effective way to display all of your marketing metrics in one place. If you are looking for a detailed, fine-tuned, niche, or extremely specific metrics, this might not be the best solution. Cyfe is good for a general health check-up of marketing, but not a finely tuned examination.
I'd love to see additional functionality to customize colors. The light/dark option is very nice, but a little more flexibility in the colors would go a long way, especially if it was possible at the dashboard level rather than just the account level. Along the same lines, being able to customize the charts a little more, for example being able to show an x-axis on single data type graphs, could make them easier to read in some cases.
Being able to choose to report on converted clicks or conversions in AdWords would be helpful.
Needs the ability to show the date range on the shared URL dashboards. Would be even better if the date range was adjustable on that view, too.
Microsoft BI is fundamental to our suite of BI applications. That being said, Northcraft Analytics is focused on delighting our customers, so if the underlying factors of our decision change, we would choose to re-write our BI applications on a different stack. Luckily, mathematics are the fundamental IP of our technology... and is portable across all BI platforms for the foreseeable future.
It has become a part of our internal tools so unless a competitor comes out with similar functionality as a similar price point it is unlikely that we would not renew. One area that would cause us not to renew would be if a competing service came out with more third-party integrations that match our needs. Price at this point is no longer an issue as it would allow us to automate a somewhat manual process that we have now connecting Cyfe widgets to Google Sheets.
I have really enjoyed working with Clear Analytics. This platform has contributed to increased production and reliable data control processes. It has flexible user interface that can be operated by any organization member. Reports are shared on simple and transparent way in the dashboard for easy access. Data analytics from all departments have created manageable working environment that have increased production.
The Microsoft BI tools have great usability for both developers and end users alike. For developers familiar with Visual Studio, there is little learning curve. For those not, the single Visual Studio IDE means not having to learn separate tools for each component. For end-users, the web interface for SSRS is simple to navigate with intuitive controls. For ad-hoc analysis, Excel can connect directly to SSAS and provide a pivot table like experience which is familiar to many users. For database development, there is beginning to be some confusion, as there are now three tool choices (VS, SSMS, Azure Data Studio) for developers. I would like to see Azure Data Studio become the superset of SSMS and eventually supplant it.
I gave it a rating of 7 because it does a good job at what it does, but there are missing that are missing which I would have benefited from. For instance, if I was able to drill down more on the specific metrics I was able to see, that would have been helpful.
SQL Server Reporting Services (SSRS) can drag at times. We created two report servers and placed them under an F5 load balancer. This configuration has worked well. We have seen sluggish performance at times due to the Windows Firewall.
I have had multiple scenarios where I had to reach out to the support team of Clear Analytics, be it access-related, general queries, during initial implementation, etc. My overall experience has always been good. I got the needed support every time without any delay. I can definitely recommend Clear Analytics simply on the basis of its excellent support team.
MSBI natively has a site that allows you to vote on user enhancements and bug fixes. This allows the largest nagging issues to float to the top and the development team can prioritize accordingly. As mentioned earlier, the large community base of MSBI developers assist technical resources in handling technical questions.
Because I had a very minor question and I was able to speak directly to the founder through LinkedIn and through email. I know that as they grow this may not always be an option but the fact that he made himself available to answer my questions said a lot about his passion for the product.
I have used on-line training from Microsoft and from Pragmatic Works. I would recommend Pragmatic Works as the best way to get up to speed quickly, and then use the Microsoft on-line training to deep dive into specific features that you need to get depth with.
We are a consulting firm and as such our best resources are always billing on client projects. Our internal implementation has weaknesses, but that's true for any company like ours. My rating is based on the product's ease of implementation.
Cyfe is a 15 minutes implementation, then some time to get your data sources created. This is an easy one person job that will not result in down time or unnecessary wasted man hours.
There are other great tools that are out there but Clear Analytics is reasonable for our business and provides a lot of features that we specifically needed
We have used the built in ConnectWise Manager reports and custom reports. The reports provide static data. PowerBI shows us live data we can drill down into and easily adjust parameters. It's much more useful than a static PDF report.
The Salesforce dashboard is comparably flexible and intuitive, but designed more to its internal CRM focus. SumAll shares the social media dashboard capabilities, but lacks all others. Its interesting feature is side-by-side graph analysis for cross-channel performance. Cyfe might borrow from SumAll's default weekly email summary of performance from the dashboard, but implementation could be too complex. Nuvi dashboard is exclusively for social media marketing, but lacks Cyfe's flexibility for third party integration and window customization settings.
As a SaaS provider we see being able to provide self-service BI to our client users as a competitive advantage. In fact the MSSQL enabled BI is a contributing factor to many winning RFPs we have done for prospective client organisations.
However MSSQL BI requires extensive knowledge and skills to design and develop data warehouses & data models as a foundation to support business analysts and users to interrogate data effectively and efficiently. Often times we find having strong in-house MSSQL expertise is a bless.