Contentsquare is a digital experience analytics cloud designed to help companies understand hidden customer behaviors, and use those insights to drive more successful experiences. It includes functionality from the former Clicktale heatmap, session recording, and A/B testing tool and now boasts a suite of customer journey analytic capabilities.
N/A
GoSquared
Score 9.0 out of 10
N/A
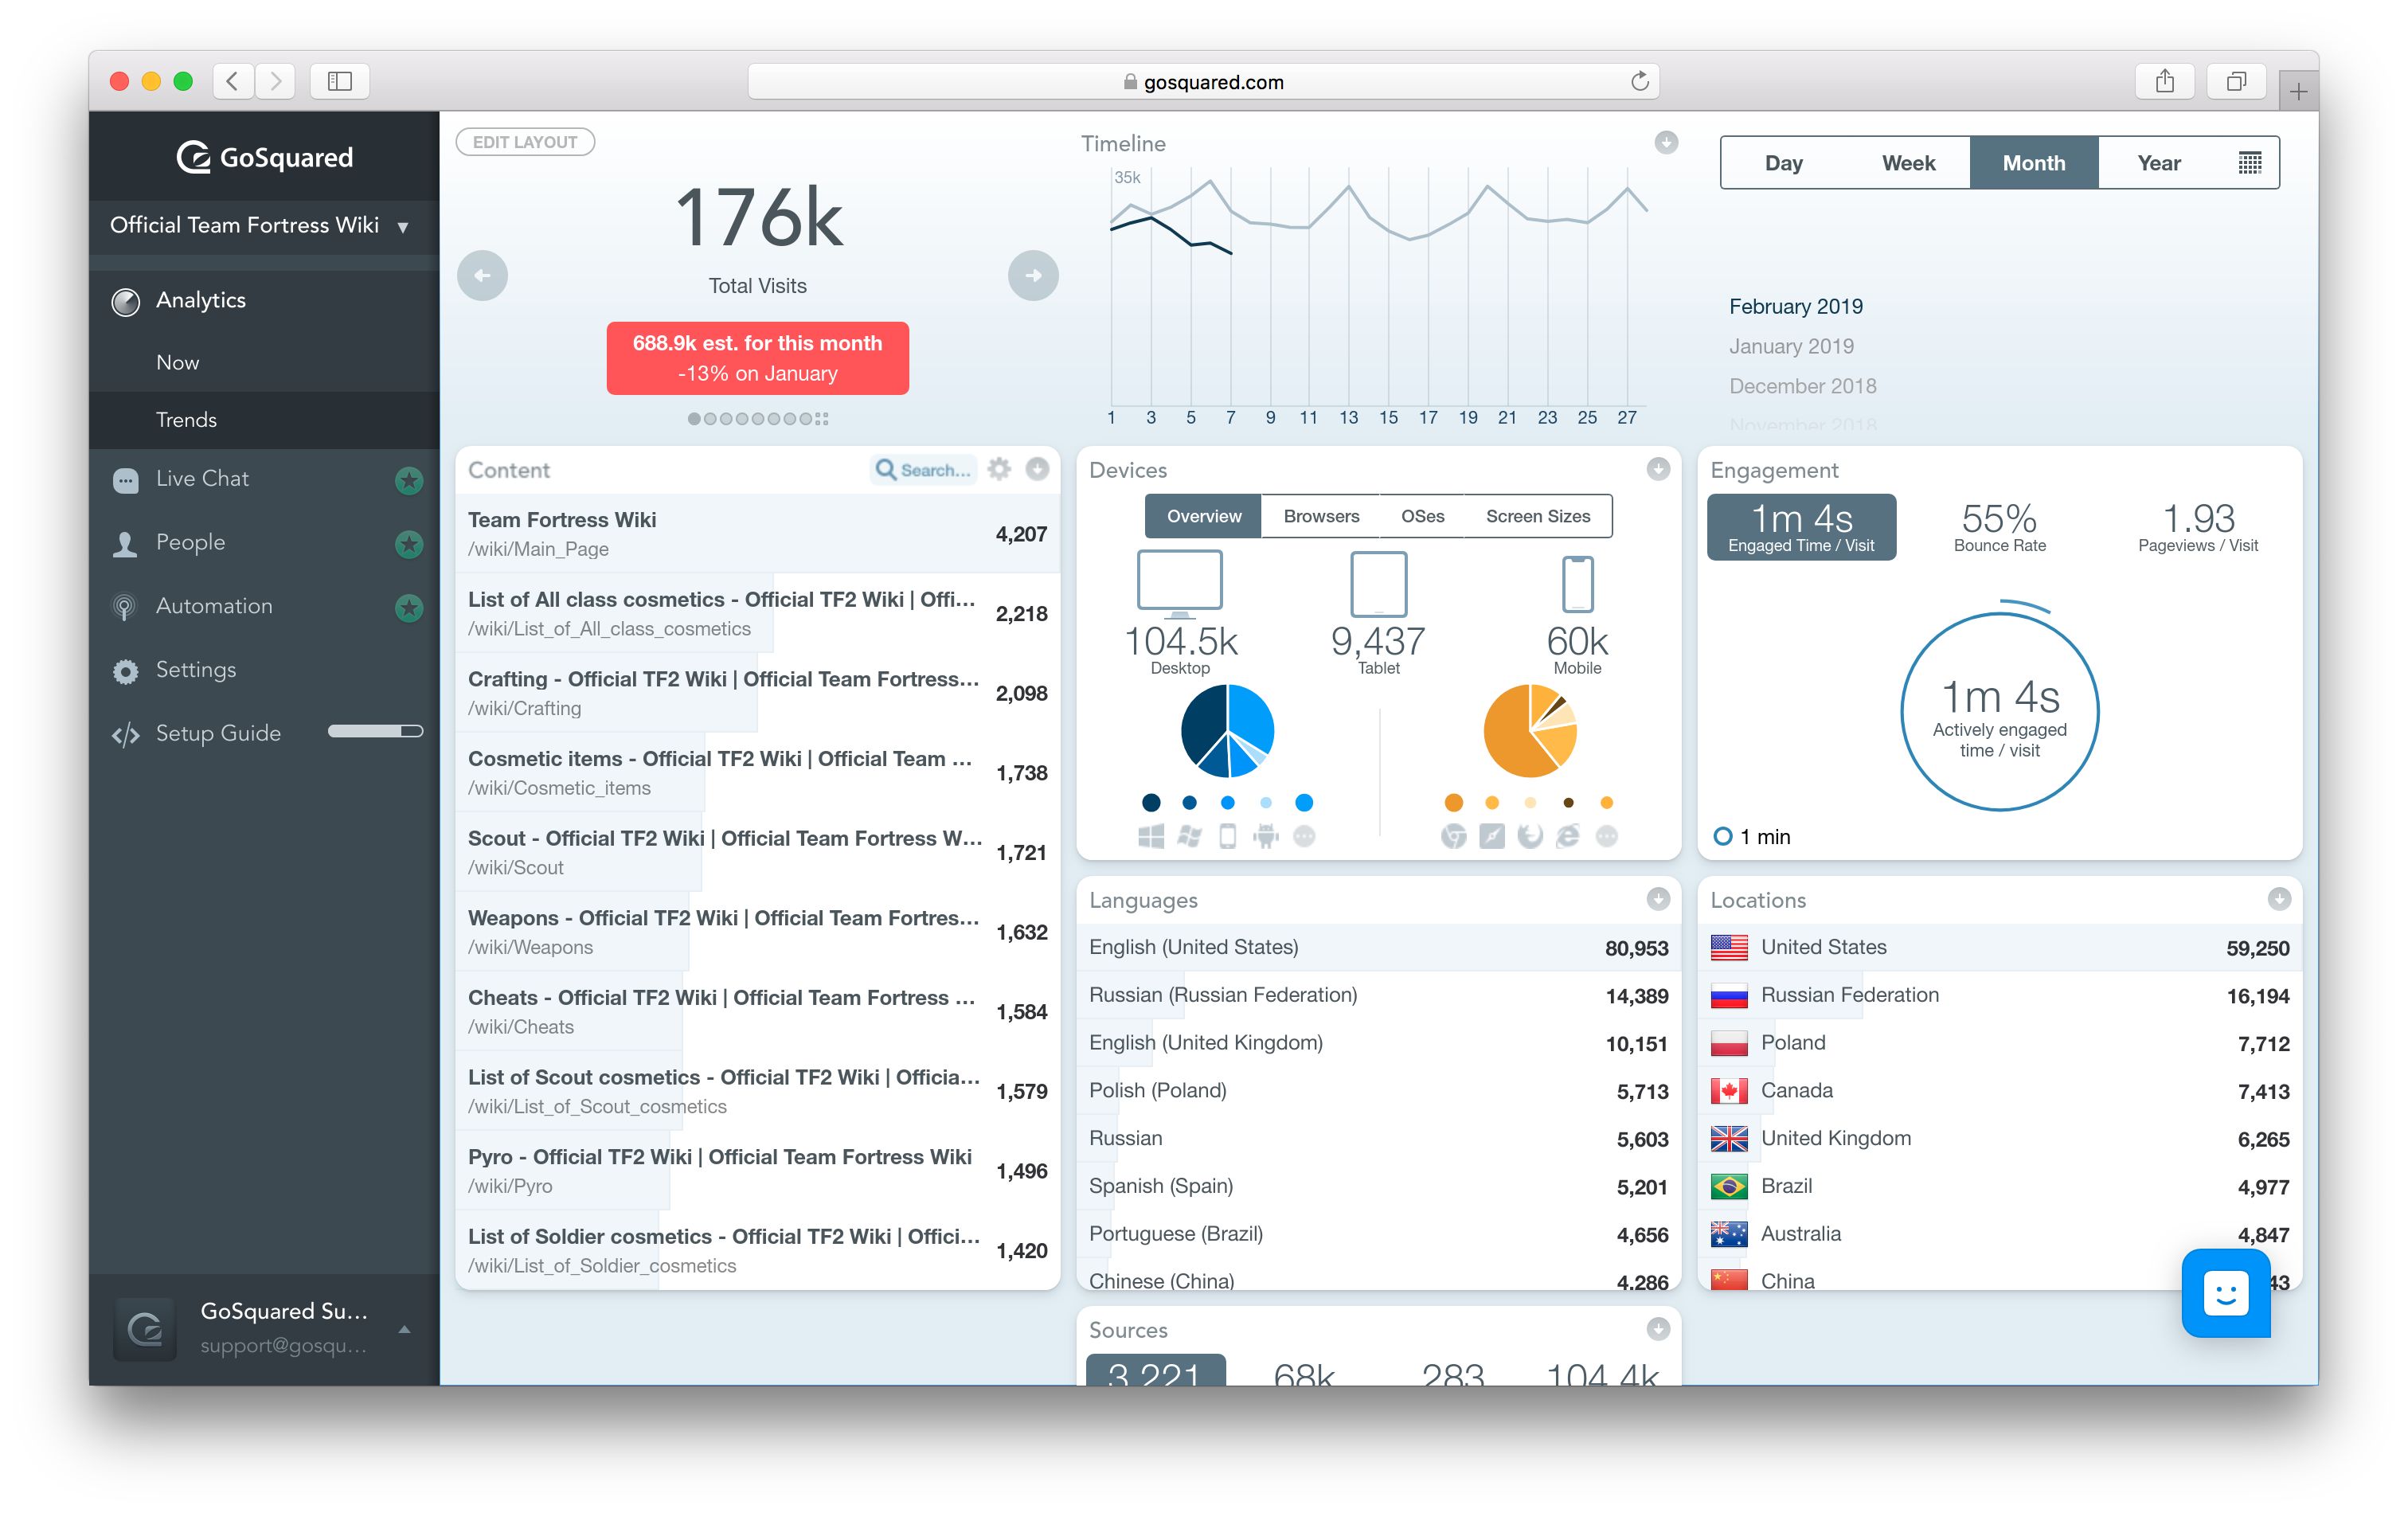
GoSquared provides real-time website analytics to sites of all sizes. The real-time dashboard displays website analytics on an individual visitor basis. The Now App displays concurrent analysis (the visitors who are on your site right now) of your site performance. The Trends App displays historical, trends and comparison analysis on real-time data. You don't have to wait 4 - 24 hours in order to compare todays current performance against last years. The Ecommerce App displays the same freshness…
$0
Per Month [Unlimited Users]
Pricing
Contentsquare
GoSquared
Editions & Modules
No answers on this topic
GoSquared Free - Access to the Now and Trends realtime web analytics dashboard.
$0
Per Month [Unlimited Users]
GoSquared Analytics - Everything included in free plus premium analytics features.
$29
Per Month [Unlimited Users]
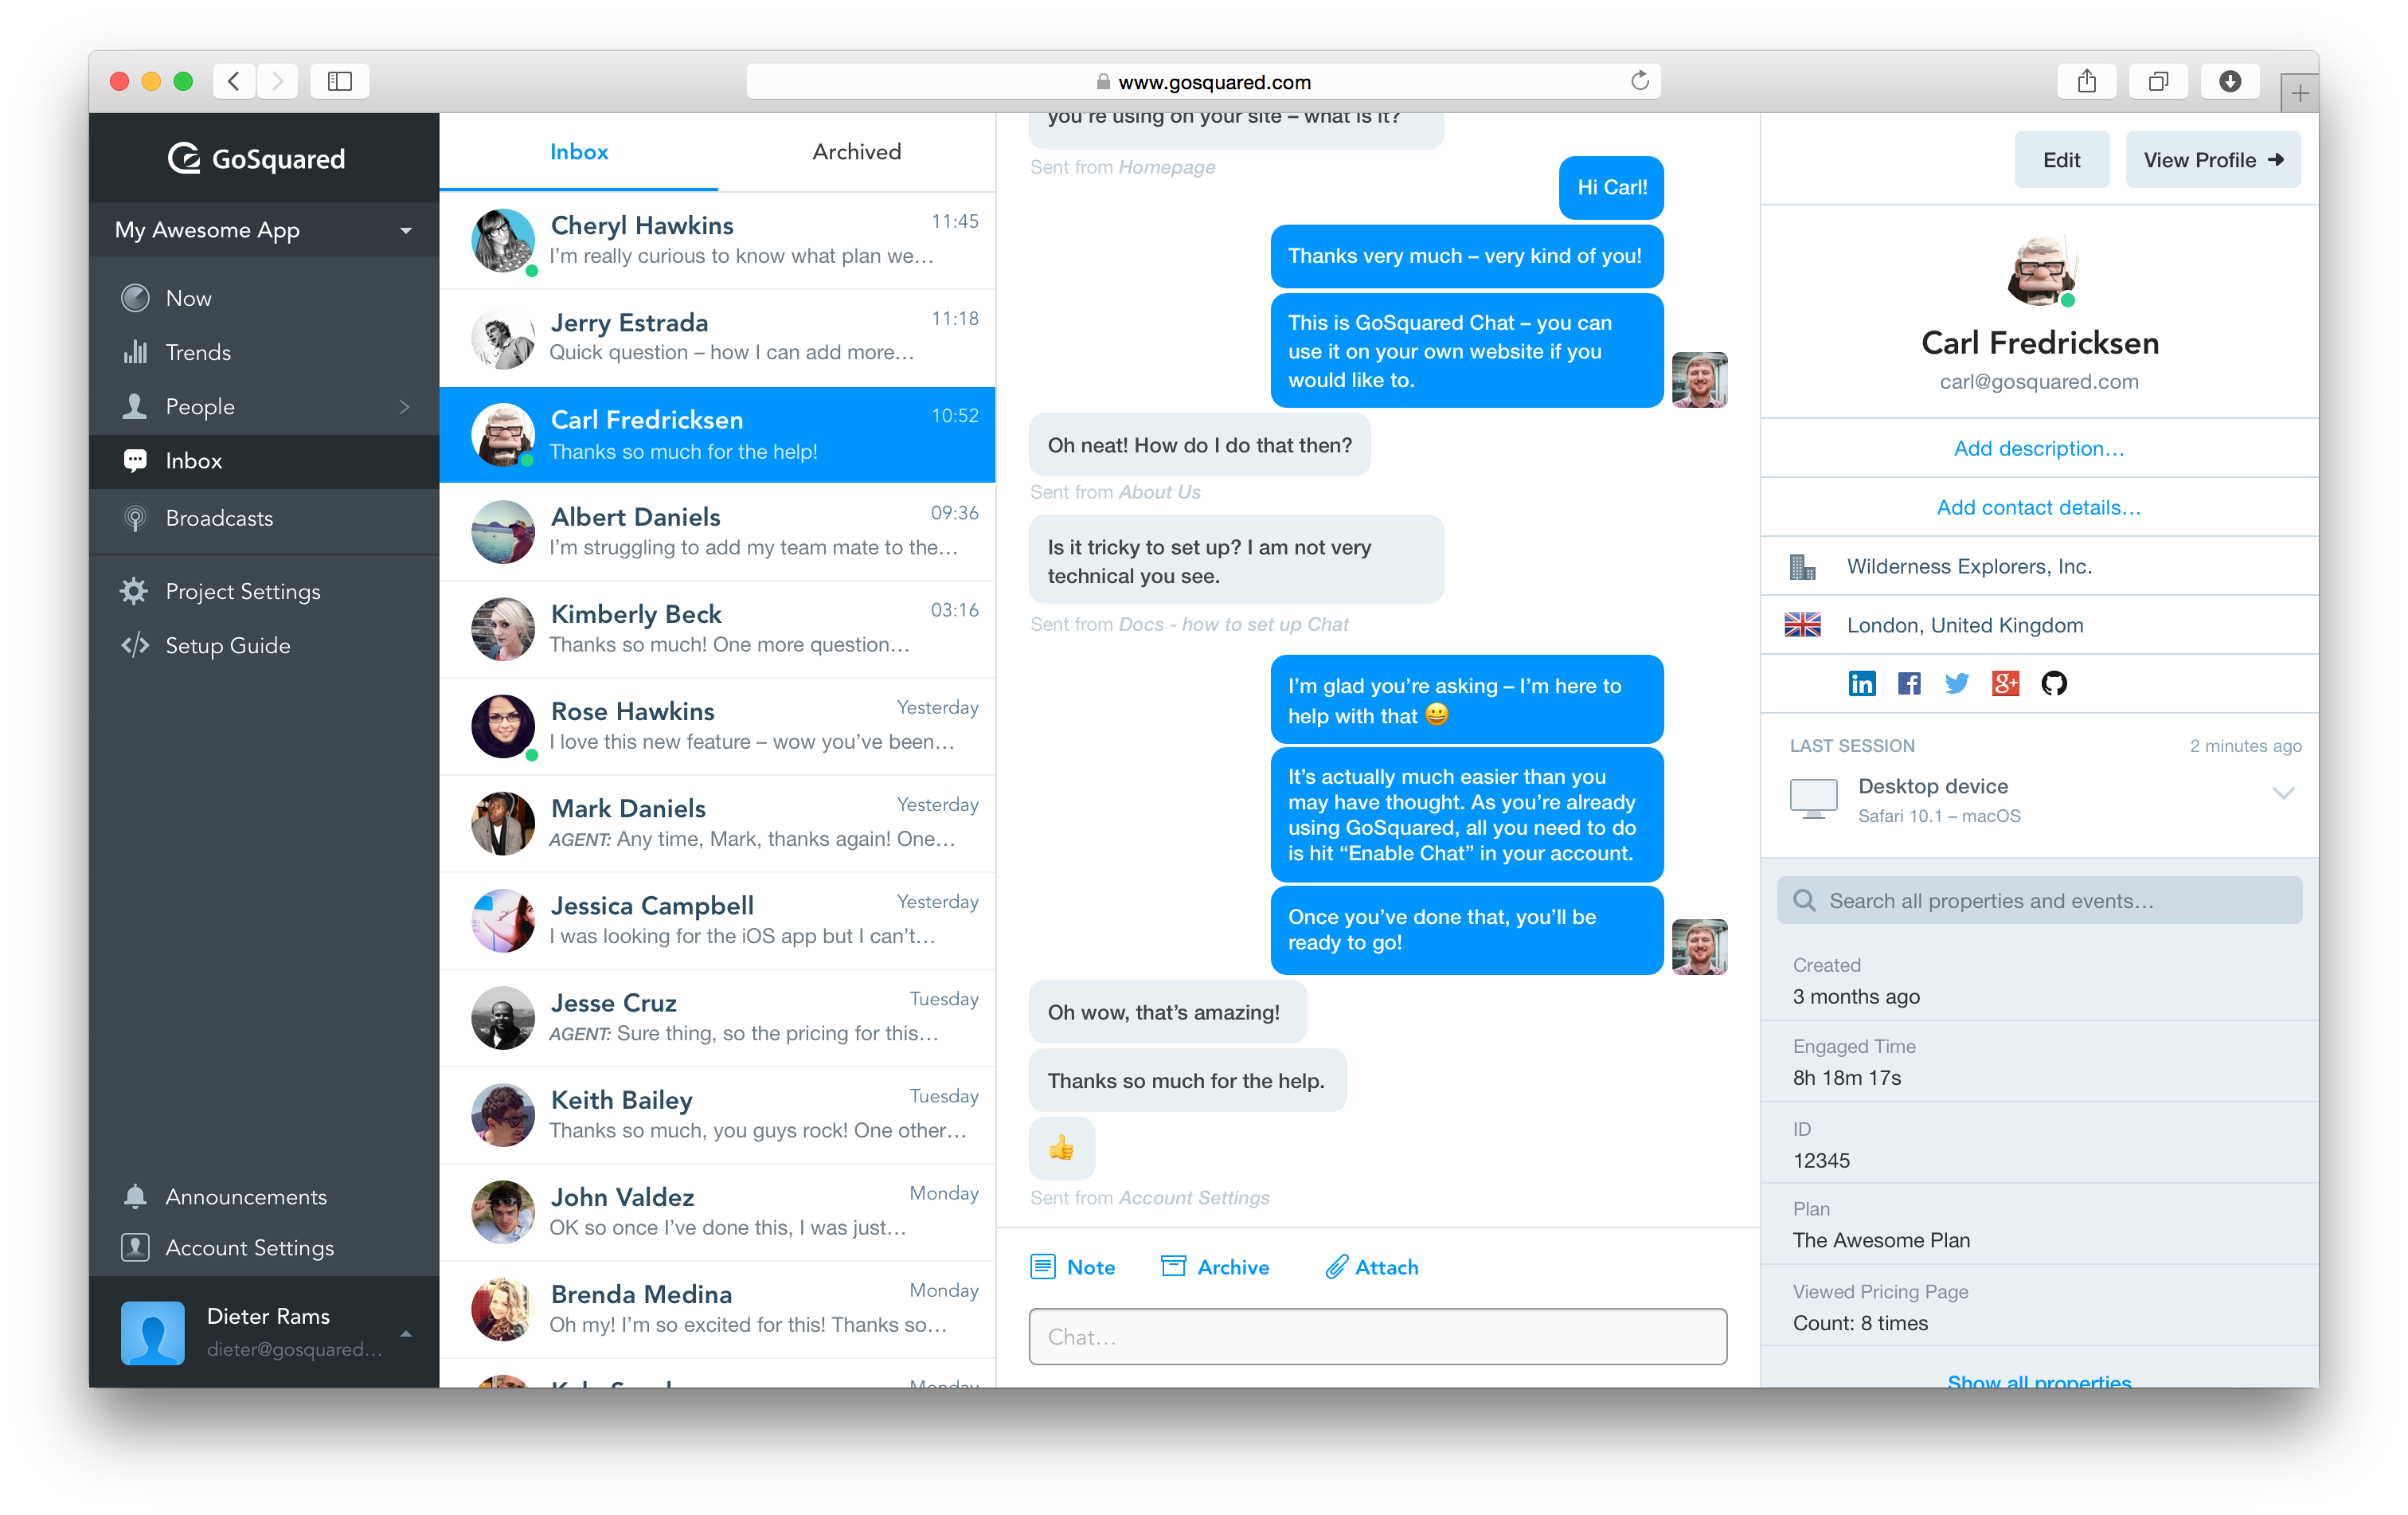
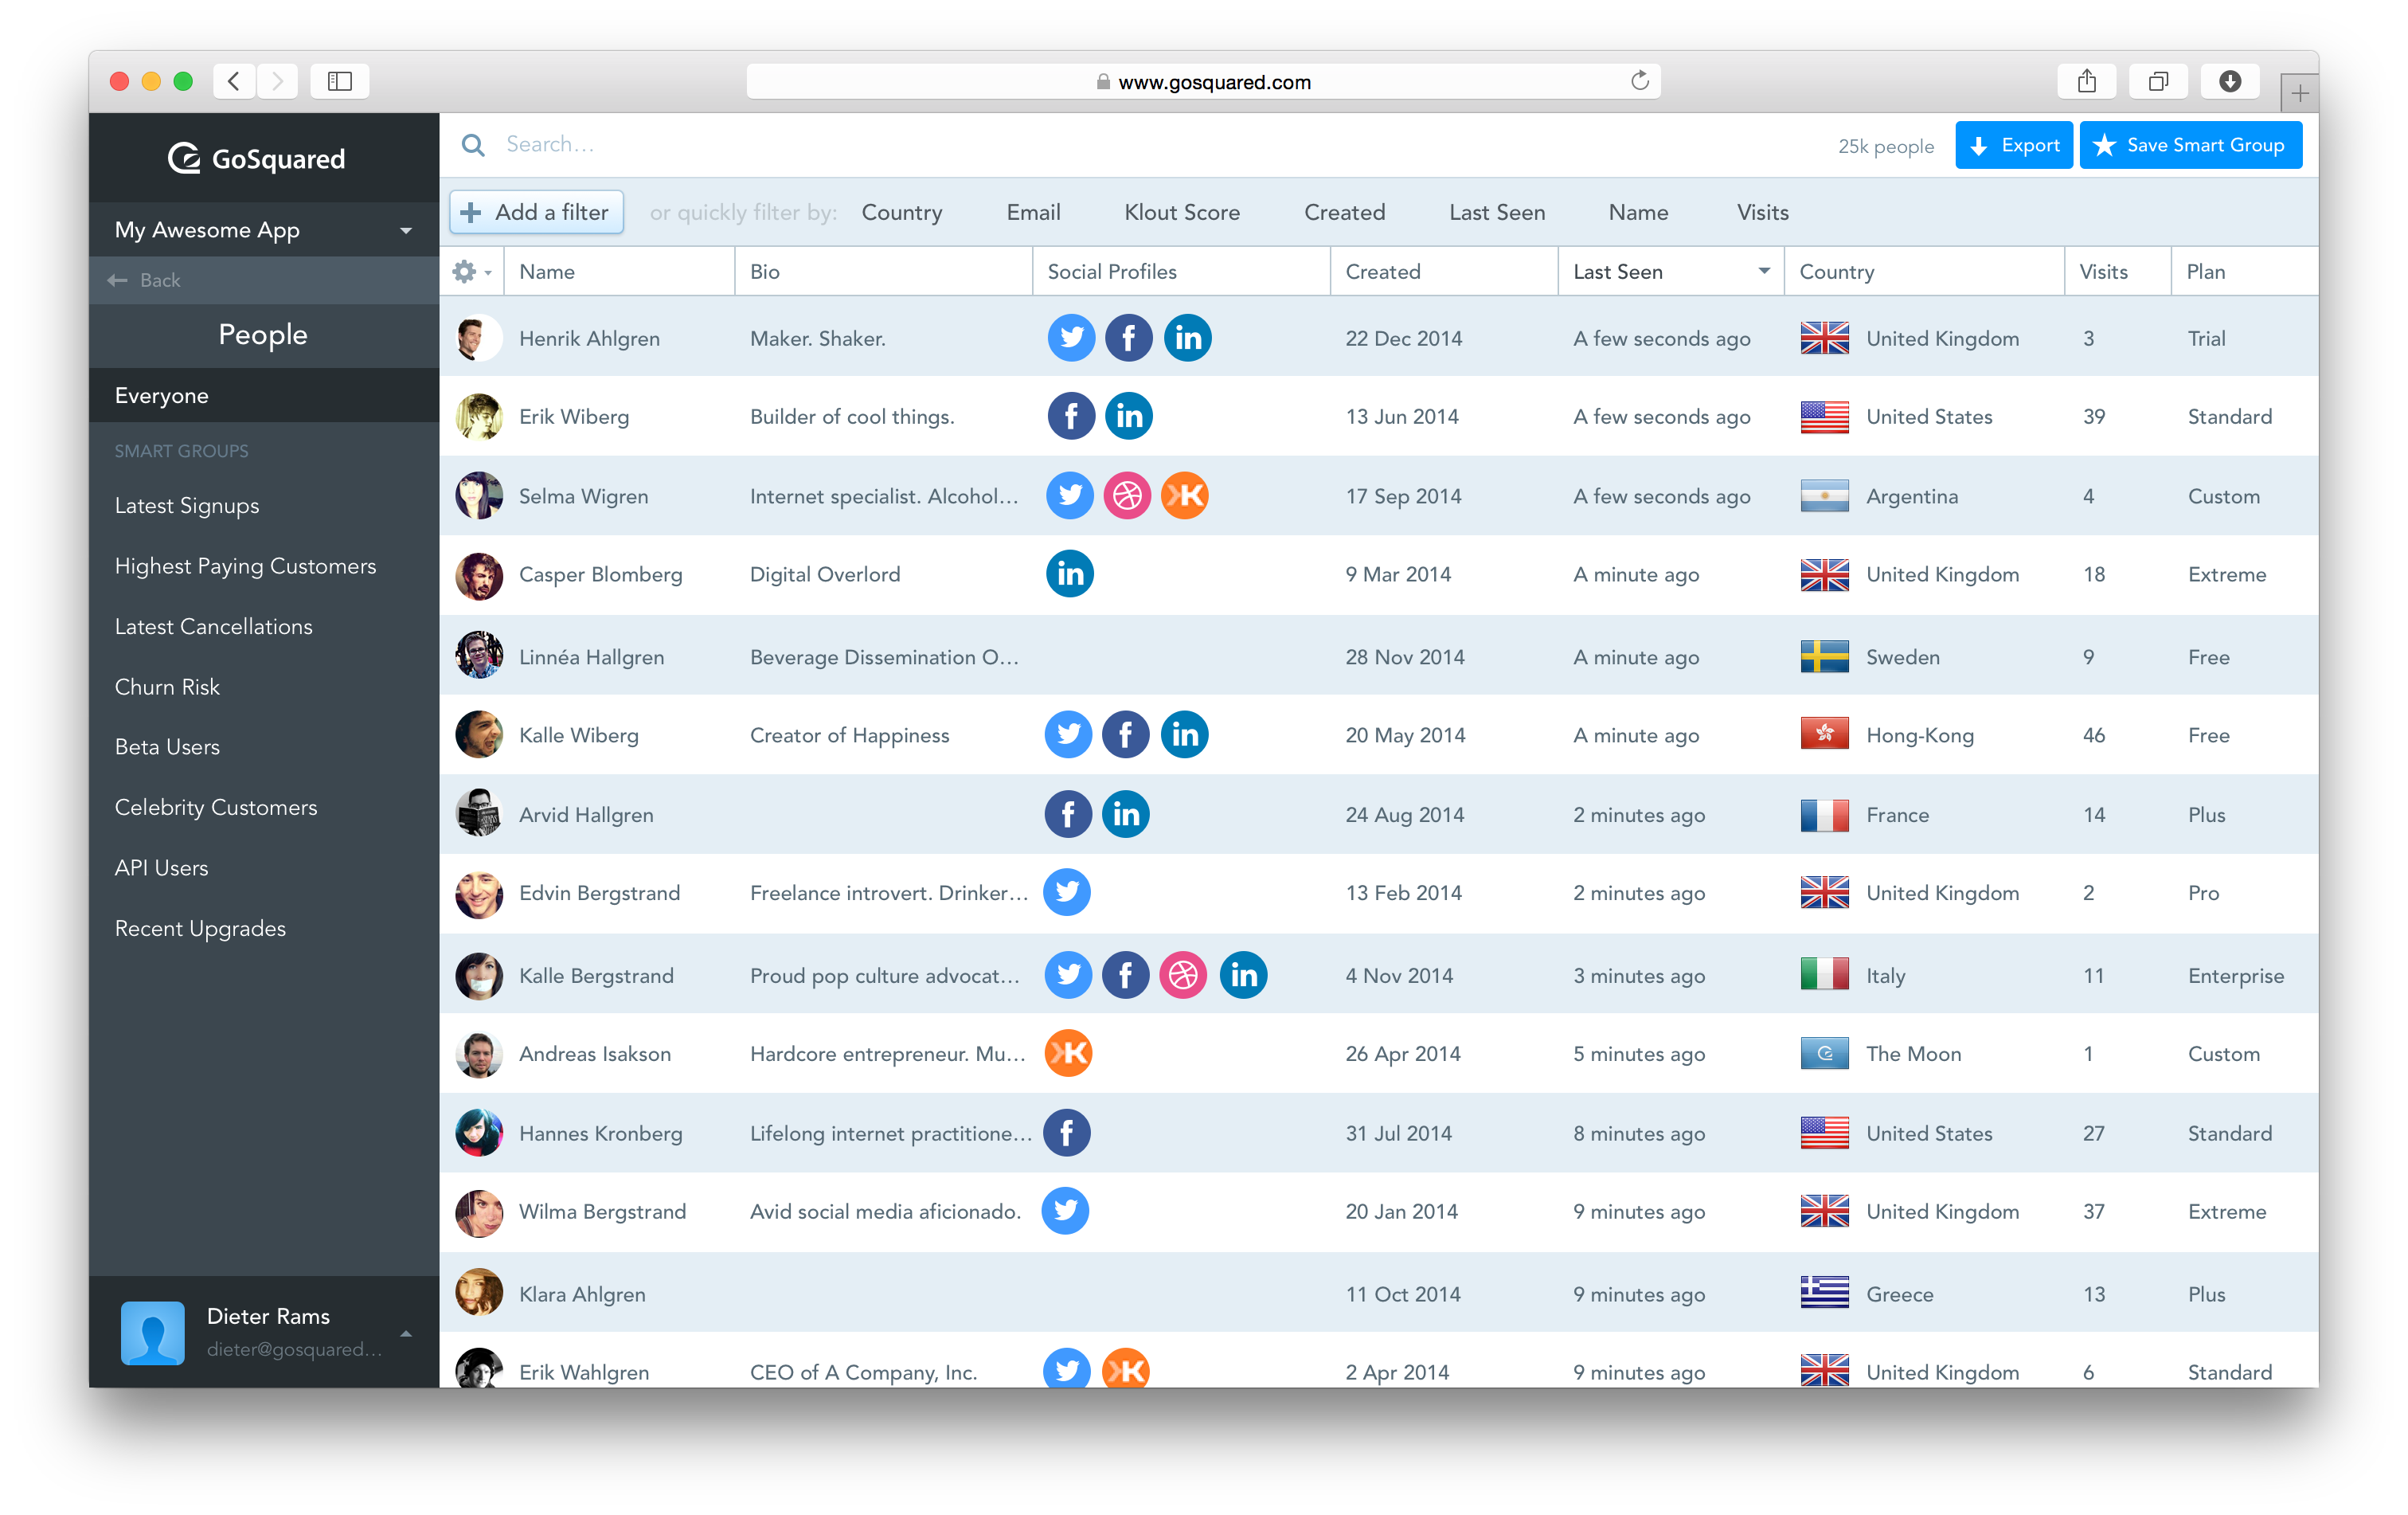
GoSquared Suite - The most popular GoSquared plan, full access to our real time analytics dashboards, intelligent live chat and customer data hub.
$79
Month [Unlimited Users]
Offerings
Pricing Offerings
Contentsquare
GoSquared
Free Trial
No
Yes
Free/Freemium Version
Yes
Yes
Premium Consulting/Integration Services
No
Yes
Entry-level Setup Fee
No setup fee
No setup fee
Additional Details
—
GoSquared Free, track up to 1000 pageviews a month. GoSquared Analytics, track up to 100k pageviews a month with pricing starting at £29/month. GoSquared Suite, track up to 100k pageviews a month with pricing starting at £79/month.
More Pricing Information
Community Pulse
Contentsquare
GoSquared
Features
Contentsquare
GoSquared
Mobile Capabilities
Comparison of Mobile Capabilities features of Product A and Product B
Contentsquare
8.0
1 Ratings
5% above category average
GoSquared
-
Ratings
Responsive Design for Web Access
8.01 Ratings
00 Ratings
Mobile Application
8.01 Ratings
00 Ratings
Dashboard / Report / Visualization Interactivity on Mobile
8.01 Ratings
00 Ratings
Results and Analysis
Comparison of Results and Analysis features of Product A and Product B
ContentSquare [(Clicktale)] is best suited to deep dive understanding of how web users truly consume your web pages. For example, when a traditional analytics software informs you on exit rates, ContentSquare [(Clicktale)] helps you to understand if users left without interacting with their last page or if they in fact spent time reading, scrolling, clicking it.
1) Maintaining customer relationships - GS just makes it so easy to respond to our users who use our product more from a tactical point of view 2) Onboarding - I think it's more or less an extension of the first point above but GS does make it easy for us to onboard new clients who are sort of beginners.
Heat Maps - we used and liked CrazyEgg in the past, and it was a cheaper tool that was easy to use. ClickTale gives us additional capabilities with better data about scroll reach, mouse movements, clicks and a summary report that shows what parts of our pages are getting attention. A product manager asked us yesterday for insights on how his product page was performing, and we were easily able to send him the reports in the heat map section.
Visitor recordings - We get good data on our website using analytics tools like GA, HubSpot and ClickTale, but it is very helpful to watch actual visitor recordings for certain visitor segments. If we add a new page or new feature to our website and notice a trend, we can easily drill down and watch visitors and see how they are interacting with the page.
Conversion funnels - We do a lot of our analysis in Google Analytics and you can set up conversion funnels in GA if you know how to do it. The problem is you can't segment the data and the aggregated data is not as helpful. ClickTale makes it very simple to do conversion funnels, and you can segment them with just a few clicks.
It's a bit difficult to navigate form heatmaps of one page on my sites to those of another.
It would be useful to have data on what percentage of clicks for each link are bounces. If this is available already, it is not very easy to find.
I have slight doubts about the accuracy of ClickTale's data based on some industry related articles I've read (i.e. http://redant.com.au/tool-reviews/clicktale-review-technology/). For the most part I feel like the data I'm getting is accurate, because it roughly corresponds to what I'm able to see on Google Analytics. It would be nice to see ClickTale address some of these issues.
At my former company I was able to upgrade our initial subscription level from bronze to gold without any problems after the first year. Unfortunately, the company I am presently with doesn't have a Clicktale subscription. I would have absolutely no hesitation in strongly recommending Clicktale to my current company if I ever get even a remote chance to do so. Clicktale is used in some of the statistics I use on my resume in an effort to quantify my results as a certified usability analyst. Clicktale has made a significant difference in my value to any team I work with.
Not only does the GoSquared application work well, the GoSquared team is constantly making improvements. When I first started using GoSquared, they only offered daily reporting -- now they offer the weekly and monthly feature per popular request. I like that they are always updating the look and feel of the website and emails they send to maintain a modern look. GoSquared is easy to implement and easy to use!
ClickTale is now a step ahead of the competition since it delivers insights based on pre-defined business KPIs and customer journeys that we have set up. We can also segment our traffic and easily sift through the many recordings finding the ones that match our lookup criteria. This paired with a good and reliable PII masking helps us with insight collection and drive business decisions which other solutions don't have. The new non-Flash interface is clean and simple to use and has all the functionalities centralized.
Google Analytics is massively bloated and can be difficult to configure, navigate and understand. While GoSquared doesn't provide the feature set that Google Analytics does it focuses on providing the best experience for the features it does offer. If you just want to know who is visiting your website and when then GoSquared is a simple way of tracing this information.
Rarely was actionable insight taken from the ClickTale tool that resulted in a better user experience on our website. We made small changes on different aspects of our webpages that typically did not show an improvement over the previous versions.
The dedicated time and resources in the ClickTale tool did not justify the investment. The heat maps can be helpful but they are based on mouse clicks (Google Analytics can help with that). Watching recordings can get time consuming and don't always provide enough data for an actionable takeaway.
If you take the approach of identifying a potential problem on your website first, then using the ClickTale tool to dig deeper in the issue, you might find the tool helpful. However, make sure you gather enough data on the potential issue before making changes to your site (and monitor the changes afterward).
GoSquared helps us to react quickly to high volumes of traffic, and allows us to identify very quickly how engaging our content is
Using browser specs helps us to ensure our websites are compatible with as many of our customers as possible, rather than relying on generic global stats