Chose Mode Analytics
Grist vs. Mode Analytics vs. Tableau Desktop
Grist vs. Mode Analytics vs. Tableau Desktop
| Product | Rating | Most Used By | Product Summary | Starting Price |
|---|---|---|---|---|
 Grist | N/A | Grist combines the capabilities of spreadsheets, databases and app builders. Using a familiar spreadsheet interface, information can be organized as a relational database, and dashboards built using drag-and-drop. Solving spreadsheet problems Ensures data is well-structured and stored in one place with no duplication, no spreadsheet-wrangling, no merging documents. Collaboration on sensitive data Data is protected… | $8 per month per user | |
 Mode | N/A | Mode, or Mode Analytics, from ThoughtSpot since the June 2023 acquisition, is a business intelligence platform that unifies company analytics by bringing data teams and business teams together, so analysts can provide rapid answers to strategic, ad hoc questions. And, business stakeholder can access relevant data to answer their own questions which can often detract more impactful work. | N/A | |
 Tableau Desktop | N/A | Tableau Desktop is a data visualization product from Tableau. It connects to a variety of data sources for combining disparate data sources without coding. It provides tools for discovering patterns and insights, data calculations, forecasts, and statistical summaries and visual storytelling. | $1,380 per year (purchased via a Creator license) |
| Grist | Mode Analytics | Tableau Desktop | ||||||||||||||||||||||
|---|---|---|---|---|---|---|---|---|---|---|---|---|---|---|---|---|---|---|---|---|---|---|---|---|
| Editions & Modules |
| No answers on this topic |
| |||||||||||||||||||||
| Offerings |
| |||||||||||||||||||||||
| Entry-level Setup Fee | No setup fee | No setup fee | No setup fee | |||||||||||||||||||||
| Additional Details | — | — | All pricing plans are billed annually. A Creator license includes Tableau Desktop, Tableau Prep Builder, and Tableau Pulse. Discounts sometimes available for volume. | |||||||||||||||||||||
| More Pricing Information | ||||||||||||||||||||||||
| Grist | Mode Analytics | Tableau Desktop | |
|---|---|---|---|
| Considered Multiple Products | Grist No answer on this topic | Mode  Jacob Rossi Help Systems Analyst Chose Mode Analytics In my opinion Mode Analytics has an edge on much of the competition due to the intuitive and powerful custom dashboard creation interface. I can create dashboards for stakeholders that are self explanatory and easy to make conclusions from. In other respects, it's very much at … |  Tableau Desktop No answer on this topic |
| Grist | Mode Analytics | Tableau Desktop | |||||||||||||||||||||||||||
|---|---|---|---|---|---|---|---|---|---|---|---|---|---|---|---|---|---|---|---|---|---|---|---|---|---|---|---|---|---|
| BI Standard Reporting |
| ||||||||||||||||||||||||||||
| Ad-hoc Reporting |
| ||||||||||||||||||||||||||||
| Report Output and Scheduling |
| ||||||||||||||||||||||||||||
| Data Discovery and Visualization |
| ||||||||||||||||||||||||||||
| Access Control and Security |
| ||||||||||||||||||||||||||||
| Application Program Interfaces (APIs) / Embedding |
| ||||||||||||||||||||||||||||
| Mobile Capabilities |
|
| Grist | Mode Analytics | Tableau Desktop | |
|---|---|---|---|
| Small Businesses |  Stackby Score 8.9 out of 10 |  Yellowfin Score 8.7 out of 10 | Yellowfin Score 8.7 out of 10 |
| Medium-sized Companies |  Microsoft Excel Score 8.9 out of 10 |  Reveal Score 10.0 out of 10 | Reveal Score 10.0 out of 10 |
| Enterprises | Microsoft Excel Score 8.9 out of 10 |  Kyvos Semantic Layer Score 9.5 out of 10 | Kyvos Semantic Layer Score 9.5 out of 10 |
| All Alternatives | View all alternatives | View all alternatives | View all alternatives |
| Grist | Mode Analytics | Tableau Desktop | |
|---|---|---|---|
| Likelihood to Recommend | 9.9 (2 ratings) | 8.1 (9 ratings) | 8.8 (203 ratings) |
| Likelihood to Renew | - (0 ratings) | - (0 ratings) | 7.5 (41 ratings) |
| Usability | - (0 ratings) | 8.1 (4 ratings) | 8.3 (73 ratings) |
| Availability | - (0 ratings) | - (0 ratings) | 10.0 (11 ratings) |
| Performance | - (0 ratings) | - (0 ratings) | 8.0 (10 ratings) |
| Support Rating | - (0 ratings) | 7.4 (5 ratings) | 1.0 (57 ratings) |
| In-Person Training | - (0 ratings) | - (0 ratings) | 9.4 (4 ratings) |
| Online Training | - (0 ratings) | - (0 ratings) | 8.0 (5 ratings) |
| Implementation Rating | - (0 ratings) | - (0 ratings) | 8.0 (34 ratings) |
| Configurability | - (0 ratings) | - (0 ratings) | 7.0 (3 ratings) |
| Ease of integration | - (0 ratings) | - (0 ratings) | 10.0 (1 ratings) |
| Product Scalability | - (0 ratings) | - (0 ratings) | 9.0 (4 ratings) |
| Vendor post-sale | - (0 ratings) | - (0 ratings) | 10.0 (1 ratings) |
| Vendor pre-sale | - (0 ratings) | - (0 ratings) | 10.0 (1 ratings) |
| Grist | Mode Analytics | Tableau Desktop | |
|---|---|---|---|
| Likelihood to Recommend | Grist Labs
| ThoughtSpot
| Tableau
 Karol Kozłowski Project manager |
| Pros | Grist Labs
| ThoughtSpot
 Kofi Obo Wood Head of Operations | Tableau
 Afia Tamanna Information Technology Business Consultant |
| Cons | Grist Labs
| ThoughtSpot
Jacob Rossi Help Systems Analyst | Tableau
|
| Likelihood to Renew | Grist Labs No answers on this topic | ThoughtSpot No answers on this topic | Tableau
|
| Usability | Grist Labs No answers on this topic | ThoughtSpot
| Tableau
 Al Mubassir Muin Software Engineer |
| Reliability and Availability | Grist Labs No answers on this topic | ThoughtSpot No answers on this topic | Tableau
 Brad Llewellyn Associate Data Analytics Consultant |
| Performance | Grist Labs No answers on this topic | ThoughtSpot No answers on this topic | Tableau
|
| Support Rating | Grist Labs No answers on this topic | ThoughtSpot
| Tableau
|
| In-Person Training | Grist Labs No answers on this topic | ThoughtSpot No answers on this topic | Tableau
 Jon Boeckenstedt Associate Vice President |
| Online Training | Grist Labs No answers on this topic | ThoughtSpot No answers on this topic | Tableau
|
| Implementation Rating | Grist Labs No answers on this topic | ThoughtSpot No answers on this topic | Tableau
 David Fickes Decision Sciences - Modeling, Simulation & Analysis |
| Alternatives Considered | Grist Labs
| ThoughtSpot
| Tableau
|
| Scalability | Grist Labs No answers on this topic | ThoughtSpot No answers on this topic | Tableau
|
| Return on Investment | Grist Labs
| ThoughtSpot
| Tableau
|
| ScreenShots | Grist Screenshots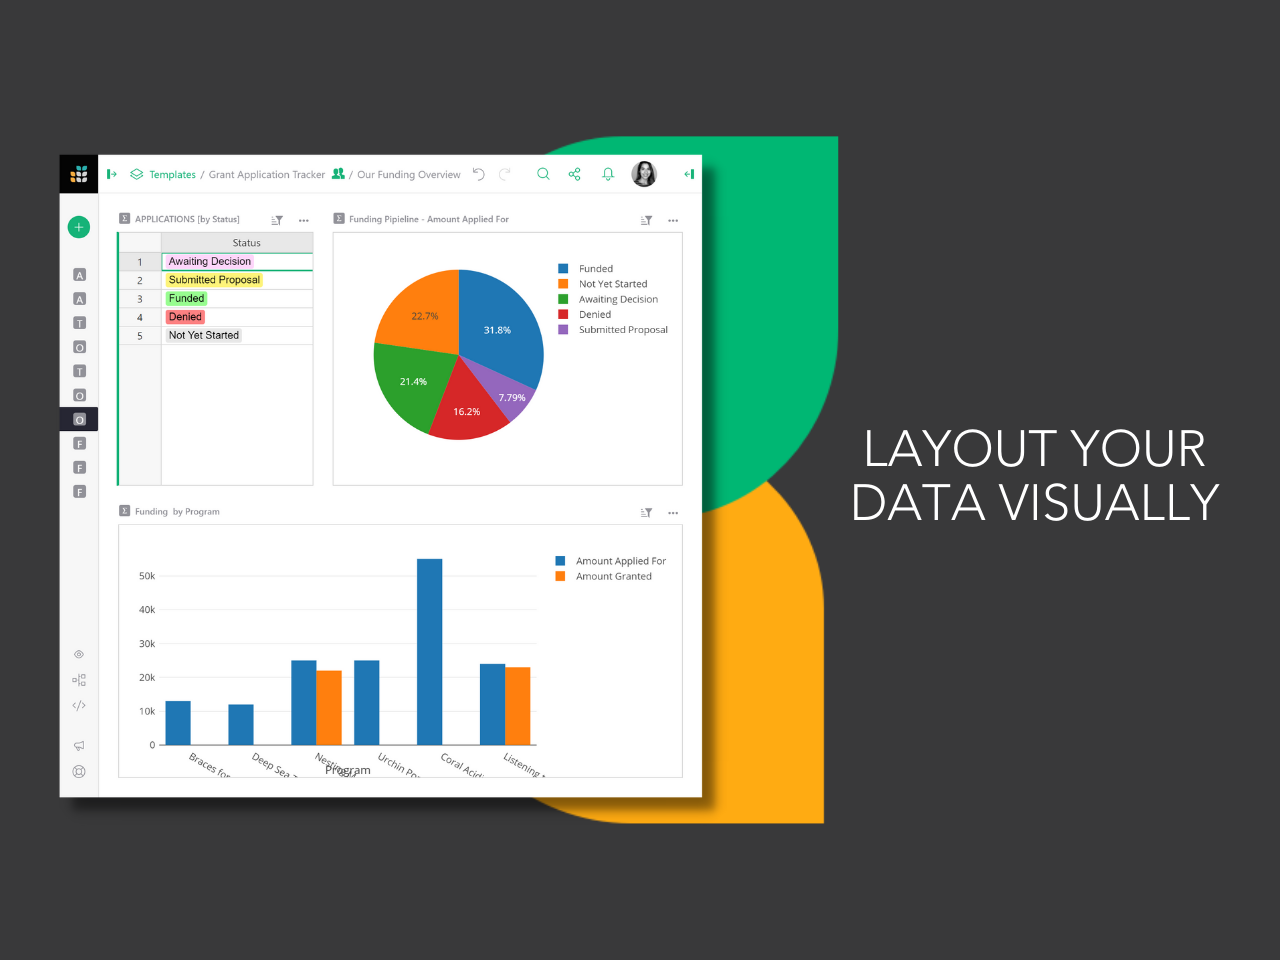  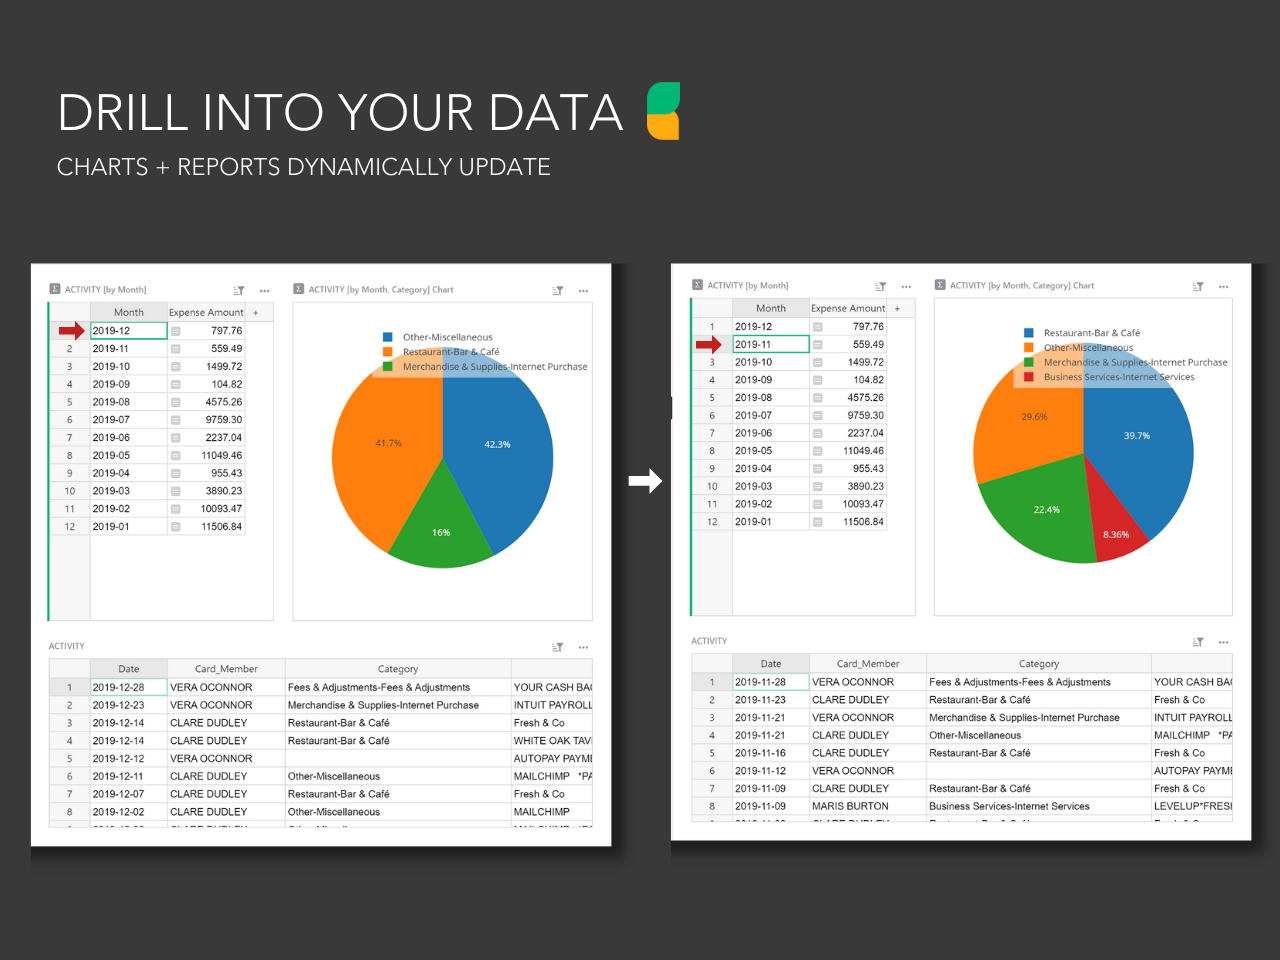  |