Chose IDERA SQL Diagnostic Manager
IDERA SQL Diagnostic Manager for SQL Server is an excellent tool, however I think Solarwinds Database Perfromance Analyzer is a slightly stronger more well rounded product
| Product | Rating | Most Used By | Product Summary | Starting Price |
|---|---|---|---|---|
 IDERA SQL Diagnostic Manager | N/A | SQL Diagnostic Manager for Microsoft SQL Server helps database administrators to find and fix Microsoft SQL Server performance problems in physical, virtual, and cloud environments. Unlike its competition, it provides effective scalability, advanced SQL query analysis and optimization, prescriptive analysis with corrective SQL scripts, powerful automated alert responses, broad PowerShell integration, complete customization, and extensive support for current and legacy Microsoft SQL Server and… | $1,996 per instance with first year maintenance included | |
 LogicMonitor | Mid-Size Companies (51-1,000 employees) | LogicMonitor’s SaaS-based platform, LM Envision, enables observability across on-prem and multi-cloud environments. It provides IT and business teams operational visibility and predictability across their technologies and applications. | N/A |
| IDERA SQL Diagnostic Manager | LogicMonitor | |||||||||||||||
|---|---|---|---|---|---|---|---|---|---|---|---|---|---|---|---|---|
| Editions & Modules |
|
| ||||||||||||||
| Offerings |
| |||||||||||||||
| Entry-level Setup Fee | No setup fee | No setup fee | ||||||||||||||
| Additional Details | — | Our platform is broken down into Pro and Enterprise Pricing. Pro includes monitoring for all of your cloud, hybrid, and on-premises infrastructure. Our Enterprise package includes all of this, plus our AIOps and Machine Learning functionality that provides dynamic thresholds, root cause analysis, anomaly detection and more! LogicMonitor only charges by the device. What is considered a device? A device is anything with an IP address that you want to monitor, including a physical device or a cloud resource. This means multiple data sources under the same IP address can be monitored for the same price. Unlike some monitoring platforms. we don’t charge per node, interface, or metric. | ||||||||||||||
| More Pricing Information | ||||||||||||||||
| IDERA SQL Diagnostic Manager | LogicMonitor | |
|---|---|---|
| Considered Both Products |  IDERA SQL Diagnostic Manager  José Javier Dominguez Reina Jefe de Proyecto Chose IDERA SQL Diagnostic Manager IDERA SQL Diagnostic Manager for SQL, Redgate SQL, and MonitorLogicMonitor are similar products to each other. We decided on IDERA SQL Diagnostic Manager for SQL because our experience with locating heavy queries has been very good and it provides real-time monitoring of all …  Steven Gockley, MBA, MCSA DBA / Sr. Data Analyst Chose IDERA SQL Diagnostic Manager All the toolsets we looked at have the same basic feature sets. We felt like IDERA SQL Diagnostic Manager for SQL Server had more features (SQL Doctor features) and better historical features. More toolsets now have a lot of these features, but for eight years, IDERA SQL …  Gedson Silva Senior Production Engineer Chose IDERA SQL Diagnostic Manager SQL Server Business Intelligence Manager does what SQL Server Management Studio should already do natively. So it actually fills up important gaps Microsoft left in its product.  Samir Patel, PMP SQL Development Team Lead Chose IDERA SQL Diagnostic Manager We compared SQL Server Business Intelligence Manager to our current tool Solarwinds Database Performance Analyzer. Where Solarwinds was deficient, SQL BI manager filled the gap. At the end of the day they were both different tools with different purposes so we concluded it was … |  LogicMonitor  Utkarsh Gaur Therapy Manager Chose LogicMonitor We evaluated Datadog, but it was primarily focused on data-related issues. So we decided to use LogicMonitor because it is excellent and offers so many more things than just data protection. It also keeps our systems safe with an advanced alert system, which is more critical …  Stuart Carrison IT Director Chose LogicMonitor SaaS monitoring makes so much sense. Why run your monitoring inside the same environment you're trying to monitor, and how do you monitor your on prem monitoring if there's an outage affecting your own infrastructure? Whilst LogicMonitor isn't a specific point solution so …  Ali Gaeta Manager of Managed Services Chose LogicMonitor SolarWinds had the big breach just as we left it. We loved how powerful it was, and how customizable - however, it is an ON-Prem tool, and as a growing MSP, that dynamic didn't and couldn't scale. We then moved to Auvik, which had the cleanest GUI and some neat features. That …  Aaron Nielson Security Systems Architect Chose LogicMonitor LogicMonitor is much easier to configure, deploy, and manage than Zabbix. Alert tuning and client configuration is clear and intuitive in LogicMonitor. Zabbix is agent based, very convoluted configuration, and is difficult to adjust tuning to minimize false positives and alert … |
| IDERA SQL Diagnostic Manager | LogicMonitor | ||||||||||||||||||
|---|---|---|---|---|---|---|---|---|---|---|---|---|---|---|---|---|---|---|---|
| SQL Performance Monitoring |
|
| IDERA SQL Diagnostic Manager | LogicMonitor | |
|---|---|---|
| Small Businesses | No answers on this topic |  Amazon CloudWatch Score 7.7 out of 10 |
| Medium-sized Companies |  Redgate Monitor Score 8.0 out of 10 |  ManageEngine Site24x7 Score 10.0 out of 10 |
| Enterprises | Redgate Monitor Score 8.0 out of 10 | ManageEngine Site24x7 Score 10.0 out of 10 |
| All Alternatives | View all alternatives | View all alternatives |
| IDERA SQL Diagnostic Manager | LogicMonitor | |
|---|---|---|
| Likelihood to Recommend | 9.0 (0 ratings) | 9.3 (0 ratings) |
| Likelihood to Renew | - (0 ratings) | 8.0 (0 ratings) |
| Usability | - (0 ratings) | 7.3 (0 ratings) |
| Availability | - (0 ratings) | 9.1 (0 ratings) |
| Performance | - (0 ratings) | 9.1 (0 ratings) |
| Support Rating | - (0 ratings) | 6.0 (0 ratings) |
| In-Person Training | - (0 ratings) | 8.2 (0 ratings) |
| Online Training | - (0 ratings) | 7.3 (0 ratings) |
| Implementation Rating | - (0 ratings) | 9.5 (0 ratings) |
| Configurability | - (0 ratings) | 9.1 (0 ratings) |
| Ease of integration | - (0 ratings) | 7.3 (0 ratings) |
| Product Scalability | - (0 ratings) | 9.1 (0 ratings) |
| Vendor post-sale | - (0 ratings) | 9.1 (0 ratings) |
| Vendor pre-sale | - (0 ratings) | 9.1 (0 ratings) |
| IDERA SQL Diagnostic Manager | LogicMonitor | |
|---|---|---|
| Likelihood to Recommend |
 Greg Goss SQL Database and Business Intelligence Manager |
|
| Pros |
Greg Goss SQL Database and Business Intelligence Manager |
|
| Cons |
Steven Gockley, MBA, MCSA DBA / Sr. Data Analyst |
|
| Likelihood to Renew | No answers on this topic |
|
| Usability | No answers on this topic |
 Martin Sims Infrastructure Engineer |
| Support Rating | No answers on this topic |
 Jeremy Hutton Senior Network Engineer |
| In-Person Training | No answers on this topic |
 Idan Lerer Senior Director, US Operations |
| Online Training | No answers on this topic |
Idan Lerer Senior Director, US Operations |
| Implementation Rating | No answers on this topic |
|
| Alternatives Considered |
|
|
| Return on Investment |
José Javier Dominguez Reina Jefe de Proyecto |
|
| ScreenShots | IDERA SQL Diagnostic Manager Screenshots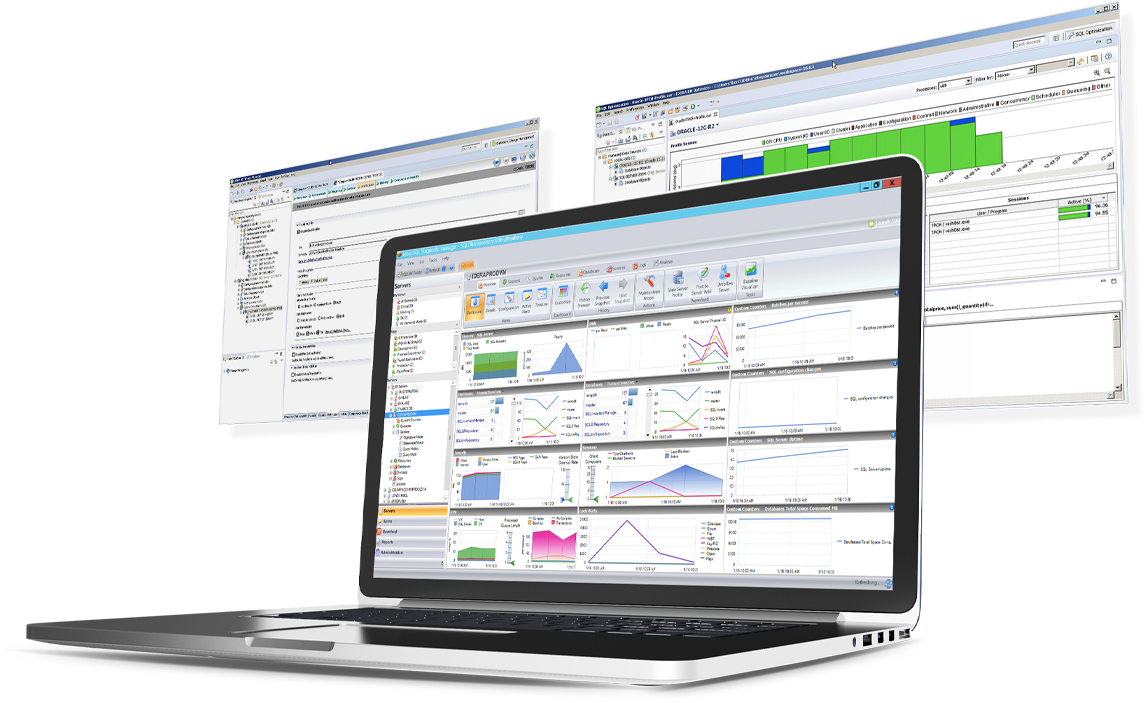 | LogicMonitor Screenshots      |