Kissmetrics is a customer engagement automation platform. This solution includes behavioral analytics, segmentation, and email campaign automation.
$150
per month
SAS Visual Analytics
Score7.8 out of 10
Enterprise companies (1,001+ employees)
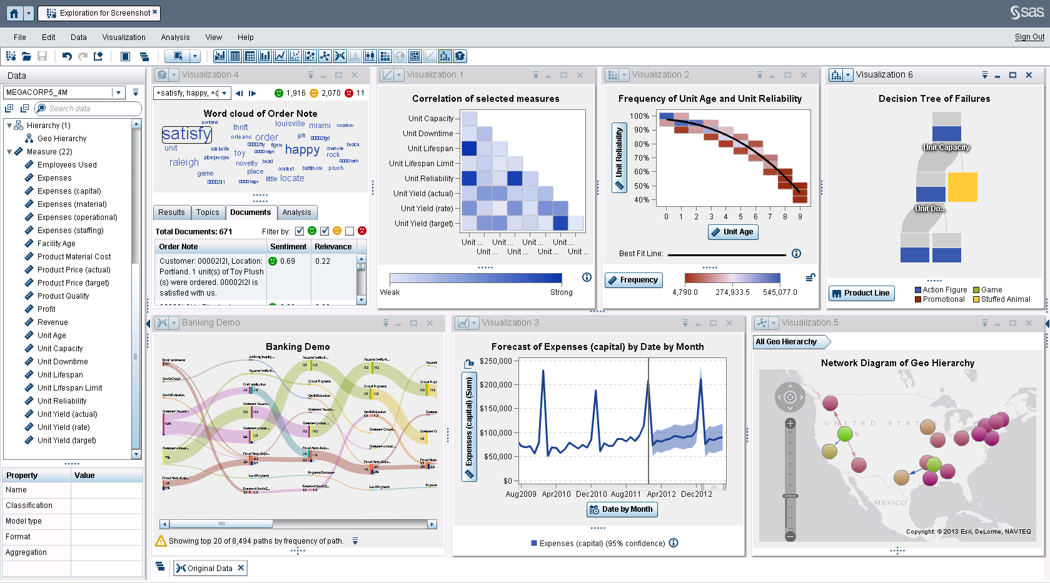
SAS Visual Analytics provides a complete platform for analytics visualization, enabling users to identify patterns and relationships in data that weren't initially evident. Interactive, self-service BI and reporting capabilities are combined with out-of-the-box advanced analytics so everyone can discover insights from any size and type of data, including text.
N/A
Pricing
Kissmetrics
SAS Visual Analytics
Editions & Modules
Growth
$500
Monthly Tracked People
Power
$850
Monthly Tracked People
Enterprise
Custom
Monthly Tracked People
SAS Visual Analytics for SAS Cloud
$0
Annual By Users: 5, 10, 20
Offerings
Pricing Offerings
Kissmetrics
SAS Visual Analytics
Free Trial
Yes
Yes
Free/Freemium Version
No
No
Premium Consulting/Integration Services
No
Yes
Entry-level Setup Fee
$1,500 per installation
No setup fee
Additional Details
What are Monthly Tracked People?
Monthly Tracked People are unique visitors that engage in an Event on your website or with your product, that gets tracked by you in Kissmetrics.
Monthly Tracked People can be anonymous or identified.
SAS Visual Statistics and SAS Office Analytics are also available as add-ons.
More Pricing Information
Features
Kissmetrics
SAS Visual Analytics
BI Standard Reporting
Comparison of BI Standard Reporting features of Kissmetrics and SAS Visual Analytics
Feature
Kissmetrics
-
Ratings
SAS Visual Analytics
8.3
11 Ratings
2% above category average
Pixel Perfect reports
00 Ratings
8.011 Ratings
Customizable dashboards
00 Ratings
8.011 Ratings
Report Formatting Templates
00 Ratings
9.010 Ratings
Ad-hoc Reporting
Comparison of Ad-hoc Reporting features of Kissmetrics and SAS Visual Analytics
Feature
Kissmetrics
-
Ratings
SAS Visual Analytics
8.8
12 Ratings
9% above category average
Drill-down analysis
00 Ratings
9.012 Ratings
Formatting capabilities
00 Ratings
8.012 Ratings
Integration with R or other statistical packages
00 Ratings
8.010 Ratings
Report sharing and collaboration
00 Ratings
10.011 Ratings
Report Output and Scheduling
Comparison of Report Output and Scheduling features of Kissmetrics and SAS Visual Analytics
Feature
Kissmetrics
-
Ratings
SAS Visual Analytics
9.2
12 Ratings
11% above category average
Publish to Web
00 Ratings
9.011 Ratings
Publish to PDF
00 Ratings
9.012 Ratings
Report Versioning
00 Ratings
9.09 Ratings
Report Delivery Scheduling
00 Ratings
10.011 Ratings
Delivery to Remote Servers
00 Ratings
9.06 Ratings
Data Discovery and Visualization
Comparison of Data Discovery and Visualization features of Kissmetrics and SAS Visual Analytics
[Kissmetrics is well suited for the] abandon cart scenario to re-engage users on the purchase journey. Engaging users to personalized content using the visit metrics derived from the data captured at each digital touch points. [Implementing] website campaign and journey orchestration is easy. You get visitor profile to segment upon using different visit metrics and action.
A de minimis incentive was given to thank the reviewer for their time. The incentive was not used to bias or drive a particular response, nor was the incentive contingent on a positive endorsement. More Info
I was in a meeting with the client and there I have to show them some analytic data to them. But I was confused about how I will manage to show big data to clients with accuracy. But then the SAS Visual Analytics software helps me in presenting accurate data at the moment and it was very presentable and through that, I got the deal for that business.
A de minimis incentive was given to thank the reviewer for their time. The incentive was not used to bias or drive a particular response, nor was the incentive contingent on a positive endorsement. More Info
The more events you track and properties you send along, the more you can see how specific users use your product/service. The user based timeline gives you a perfect start point to get in touch with users, because you can see where they get stuck.
Tracking your traffic sources and how they influence conversions is awesome. You can get a perfect view of how much a traffic source contributes to revenue.
Funnel reports give you more insights into micro and macro conversion steps and give you actionable data to work with.
Provides the flexibility to the end user to slice and dice the data.
Anyone can make predictive models with the help of in-built algorithms without the need to write a single line of code or knowledge of what's under the hood of algorithms.
The feature to simply ask a question related to data and getting a response in form of text, chart or graph is amazing.
A de minimis incentive was given to thank the reviewer for their time. The incentive was not used to bias or drive a particular response, nor was the incentive contingent on a positive endorsement. More Info
Installing.... yes this is also a negative. While you can install and have the program running in minutes, if you use Unbounce, the form tracking process is quite complicated!
Updates... I feel like the product updates have slowed a lot lately. Thankfully, the product functionality is so amazing that it hasn't impeded the use of it. However, it is still disappointing to see less frequent software updates.
Occasionally clunky UI... there are a few reports that are really easy to mess up and leave you scratching your head on why it isn't showing you any data.
A de minimis incentive was given to thank the reviewer for their time. The incentive was not used to bias or drive a particular response, nor was the incentive contingent on a positive endorsement. More Info
SAS is relatively expensive when compared to other BI tools and requires a large amount of upfront fee which becomes an issue for smaller organizations.
UI for the dashboards looks a little date in comparison to competitors like Tableau and Microstrategy.
Integration with other open source software like Python needs to be built in.
A de minimis incentive was given to thank the reviewer for their time. The incentive was not used to bias or drive a particular response, nor was the incentive contingent on a positive endorsement. More Info
Price sensitivity and the different choices that now exist in the Analytics industry. I think it makes sense for us sometime this year to rethink our analytics strategy to see how we may leverage the best of GA (which has included lots of new features and updates the past years_, Kiss and other tools as need be
SAS really is the cutting edge in Business Intelligence. That is all they do! They are constantly coming out with new products, product upgrades, and their tech support is second to none. In addition, their support of Education has made our ability to acquire their product possible.
Right after login, you'll get to a dashboard which shows you a quick view on how your business is doing across the events you are tracking. There is no need to dig deeper than that unless you want to, in which case it's very easy to do so just by clicking on the metric on which you want more information. The interface is very intuitive.
SAS BI is good for creating reports and dashboards and then sharing it with the users. It also has ability to manage access to the reports and dashboards but somehow with most of the world moving to open source languages R, Python and Julia, SAS BI feels to be archaic in terms of feature set and integrations it allow[s]. Also, comparing it with other Business Intelligence tools like Tableau and Microsoft BI, the functionality of SAS BI is very limited and doesn't justify the pricing.
A de minimis incentive was given to thank the reviewer for their time. The incentive was not used to bias or drive a particular response, nor was the incentive contingent on a positive endorsement. More Info
The application was very rarely down; during the period we used the application, I can think of only two or three occasions in which the site was down. Notably, at no time was the the performance of our own site compromised as a result.
Speed improved dramatically as the service matured. Early iterations of the publicly-released application would occasionally provide slow processing of results, but those delays became much rarer occurrences during the last year that we used KISSmetrics. One of the more impressive views (which started out feeling more like a toy) is the live view of visits. Knowing that you could see, in real time, what events a user triggered, was gratifying and instructive.
Our front-line product support person (Mika) is great. She is responsive and great to work with.
However, the data accuracy issue described earlier is the reason for the low score here. This issue was escalated from front-line to support to level 2 technical support and then it disappeared into a black hole. Escalations, in general, do not go well. We get no response for days, or I have to chase things down. This is not acceptable. Marketing metrics are critically important to me and I need answers quickly. I cannot afford to wait around for days / weeks for a response.
Just to be clear, these comments only apply to escalated support issues.
When you call tech support, you are immediately routed to a person who can answer your question. Often they can answer on the spot. However, if they cannot, you are given a track number and then followed up with. There have been times when I have had multiple track numbers open and they will actually TRACK YOU DOWN to ensure that your problem has been resolved. Issues do not fall into black holes with SAS. They are also willing to do a WebEx with you to diagnose the problem by seeing your environment, which is always helpful.
Again, we were fortunate to work with KISSmetrics as they built their application, but Hiten, their CEO and founder, was incredibly helpful to me personally, and to our metrics-driven business as a whole, as we adopted their tool.
I loved this aspect of the product. It wasn't just that the documentation and online tutorials are great - which they are - the on-boarding process though was really stellar. Once you have set everything up, you get a welcome message followed by a step-by-step guide to get you started that is built right into the product interface. For example, the UI asks you to first do X, and then copy this code snippet and send it to your developer who will know what to do with it. When you come back after the first interaction with the product, it continues the process by explaining right in the UI how to track events etc. This kind of step-by-step approach is incredibly efficient. Although there are various forms of supporting documentation (PDFs videos etc) to support every step, you don't really need them. This approach means that you are up and running very quickly with virtually no training time or documentation consultation. Highly efficient process.
In order to build trackability down to revenue, there was quite a lot of work to integrate Kissmetrics with our software and internal process. We had to build the hooks so that Kissmetrics could call back into our software and billing system, etc.. However, we didn't need additional expertise to do this. Once you understand the API, and you own systems, making it work is not too difficult. We did not require an outside consultant or anything like that
Kissmetrics is a next-level step up for people who are used to getting their tracking and reporting from Google Analytics or Shopify's CMS. While HubSpot arguably has a better user interface, Kissmetrics certainly has the power and usability necessary to track important conversion data and help you make better marketing decisions.
A de minimis incentive was given to thank the reviewer for their time. The incentive was not used to bias or drive a particular response, nor was the incentive contingent on a positive endorsement. More Info
I have used Crystal Reports, Jaspersoft and SQL Server Reporting Services (SSRS). I would recommended Business Intelligence over SSRS and Crystal Reports. SSRS is very SQL-centric and Crystal Reports is more of an end-user tool. I would recommend Jaspersoft over Business Intelligence for developing a seamless web-based reporting interface but I highly recommend Business Intelligence for end-user ad-hoc reporting.
A de minimis incentive was given to thank the reviewer for their time. The incentive was not used to bias or drive a particular response, nor was the incentive contingent on a positive endorsement. More Info
Unfortunately for this client (small business) the cost of Kissmetrics was just too prohibitive. But it's obvious that for a larger company that can afford it, the data would be invaluable to gain more insight in how to gain more active users and orders for a funnel.
The data provided really increases an understanding of how best to provide the right experience for the users...happy users equals increase in ROI.
A de minimis incentive was given to thank the reviewer for their time. The incentive was not used to bias or drive a particular response, nor was the incentive contingent on a positive endorsement. More Info
A de minimis incentive was given to thank the reviewer for their time. The incentive was not used to bias or drive a particular response, nor was the incentive contingent on a positive endorsement. More Info