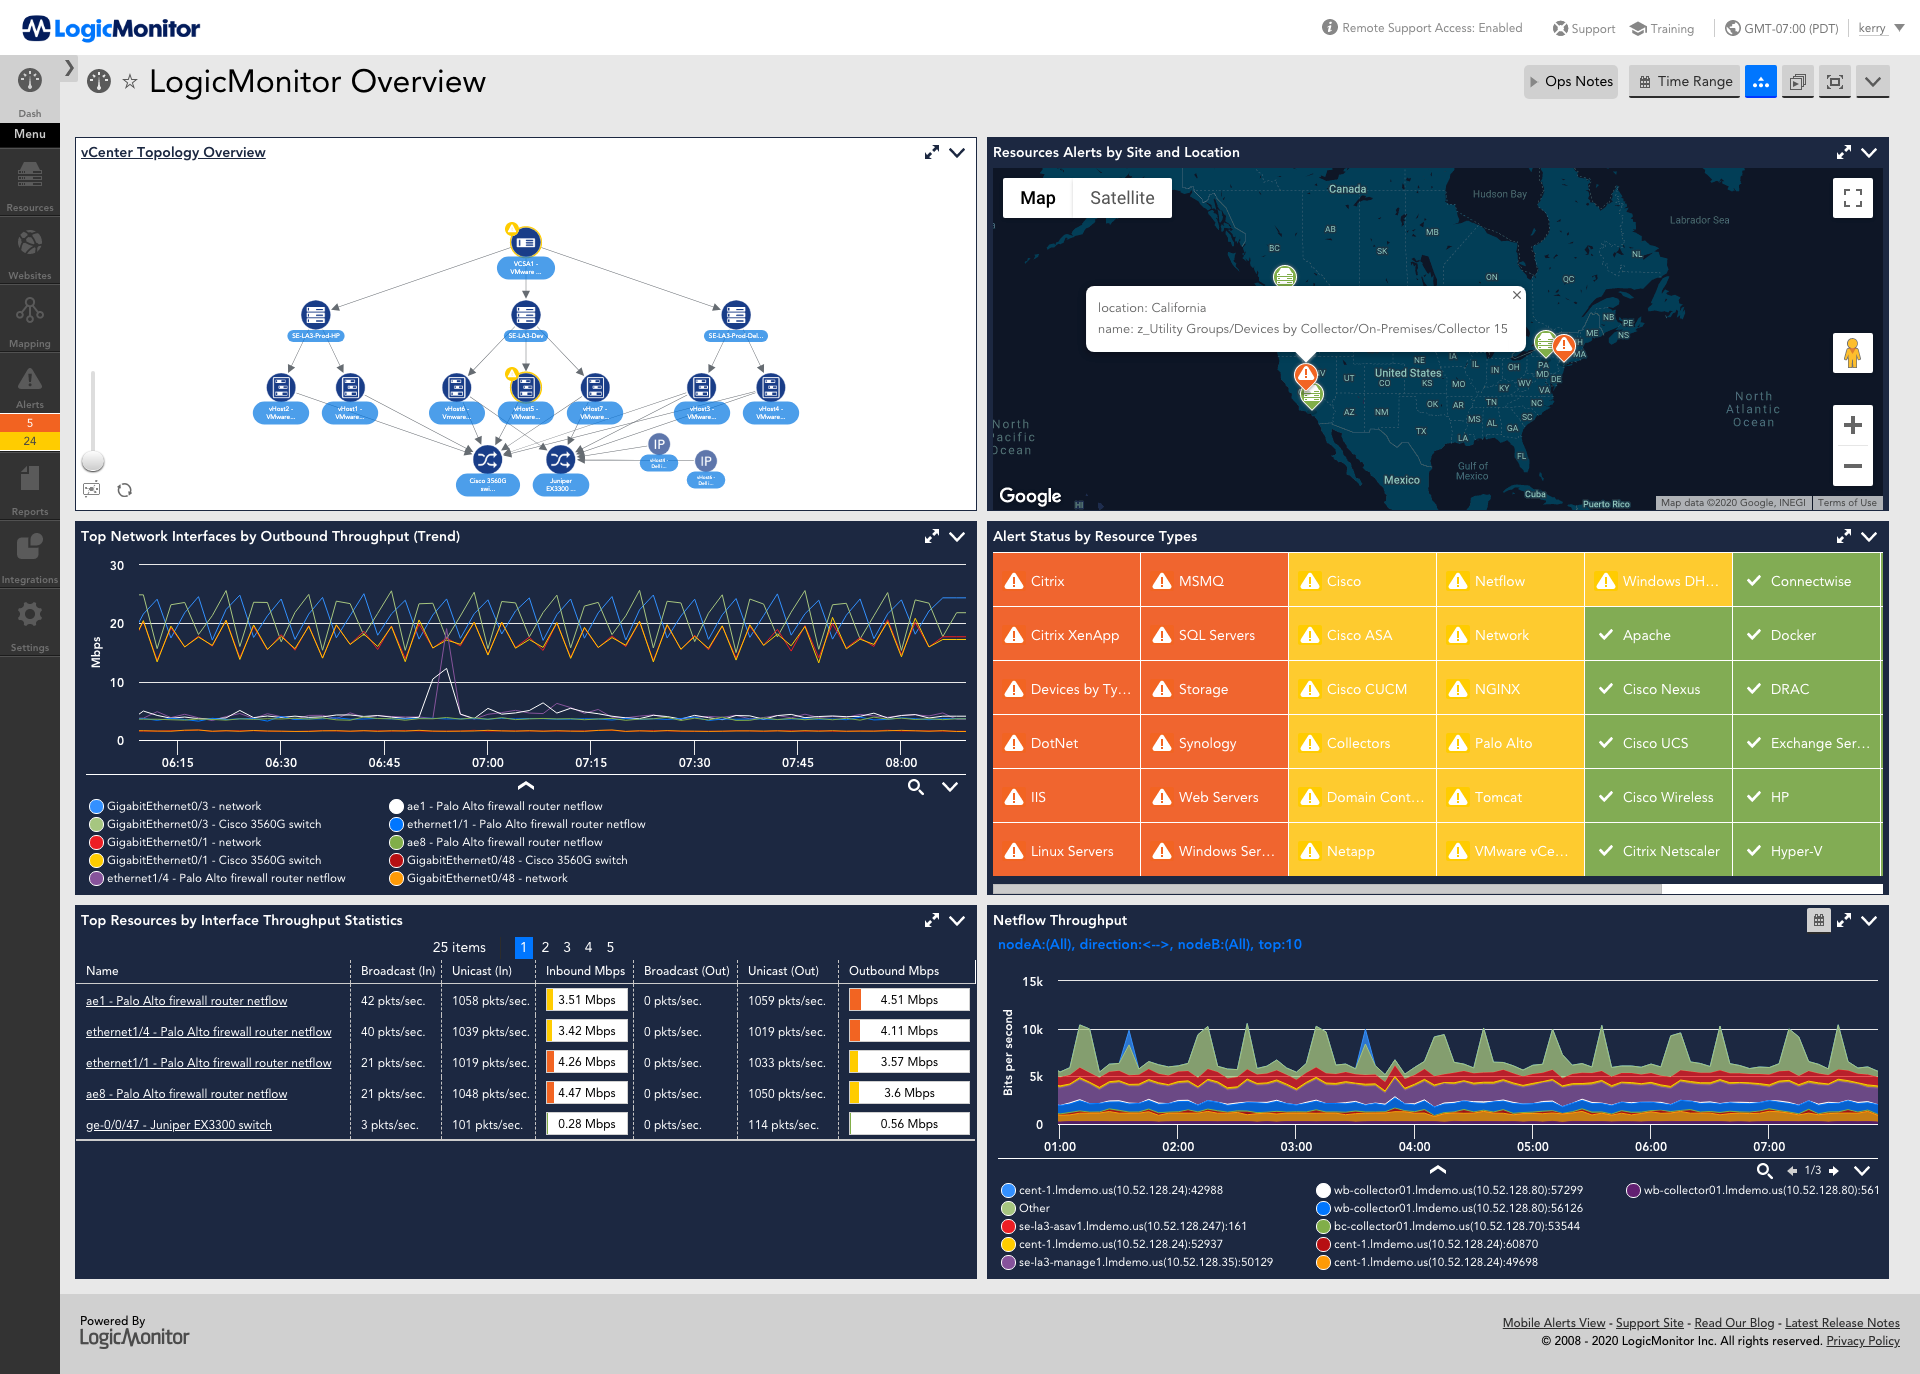
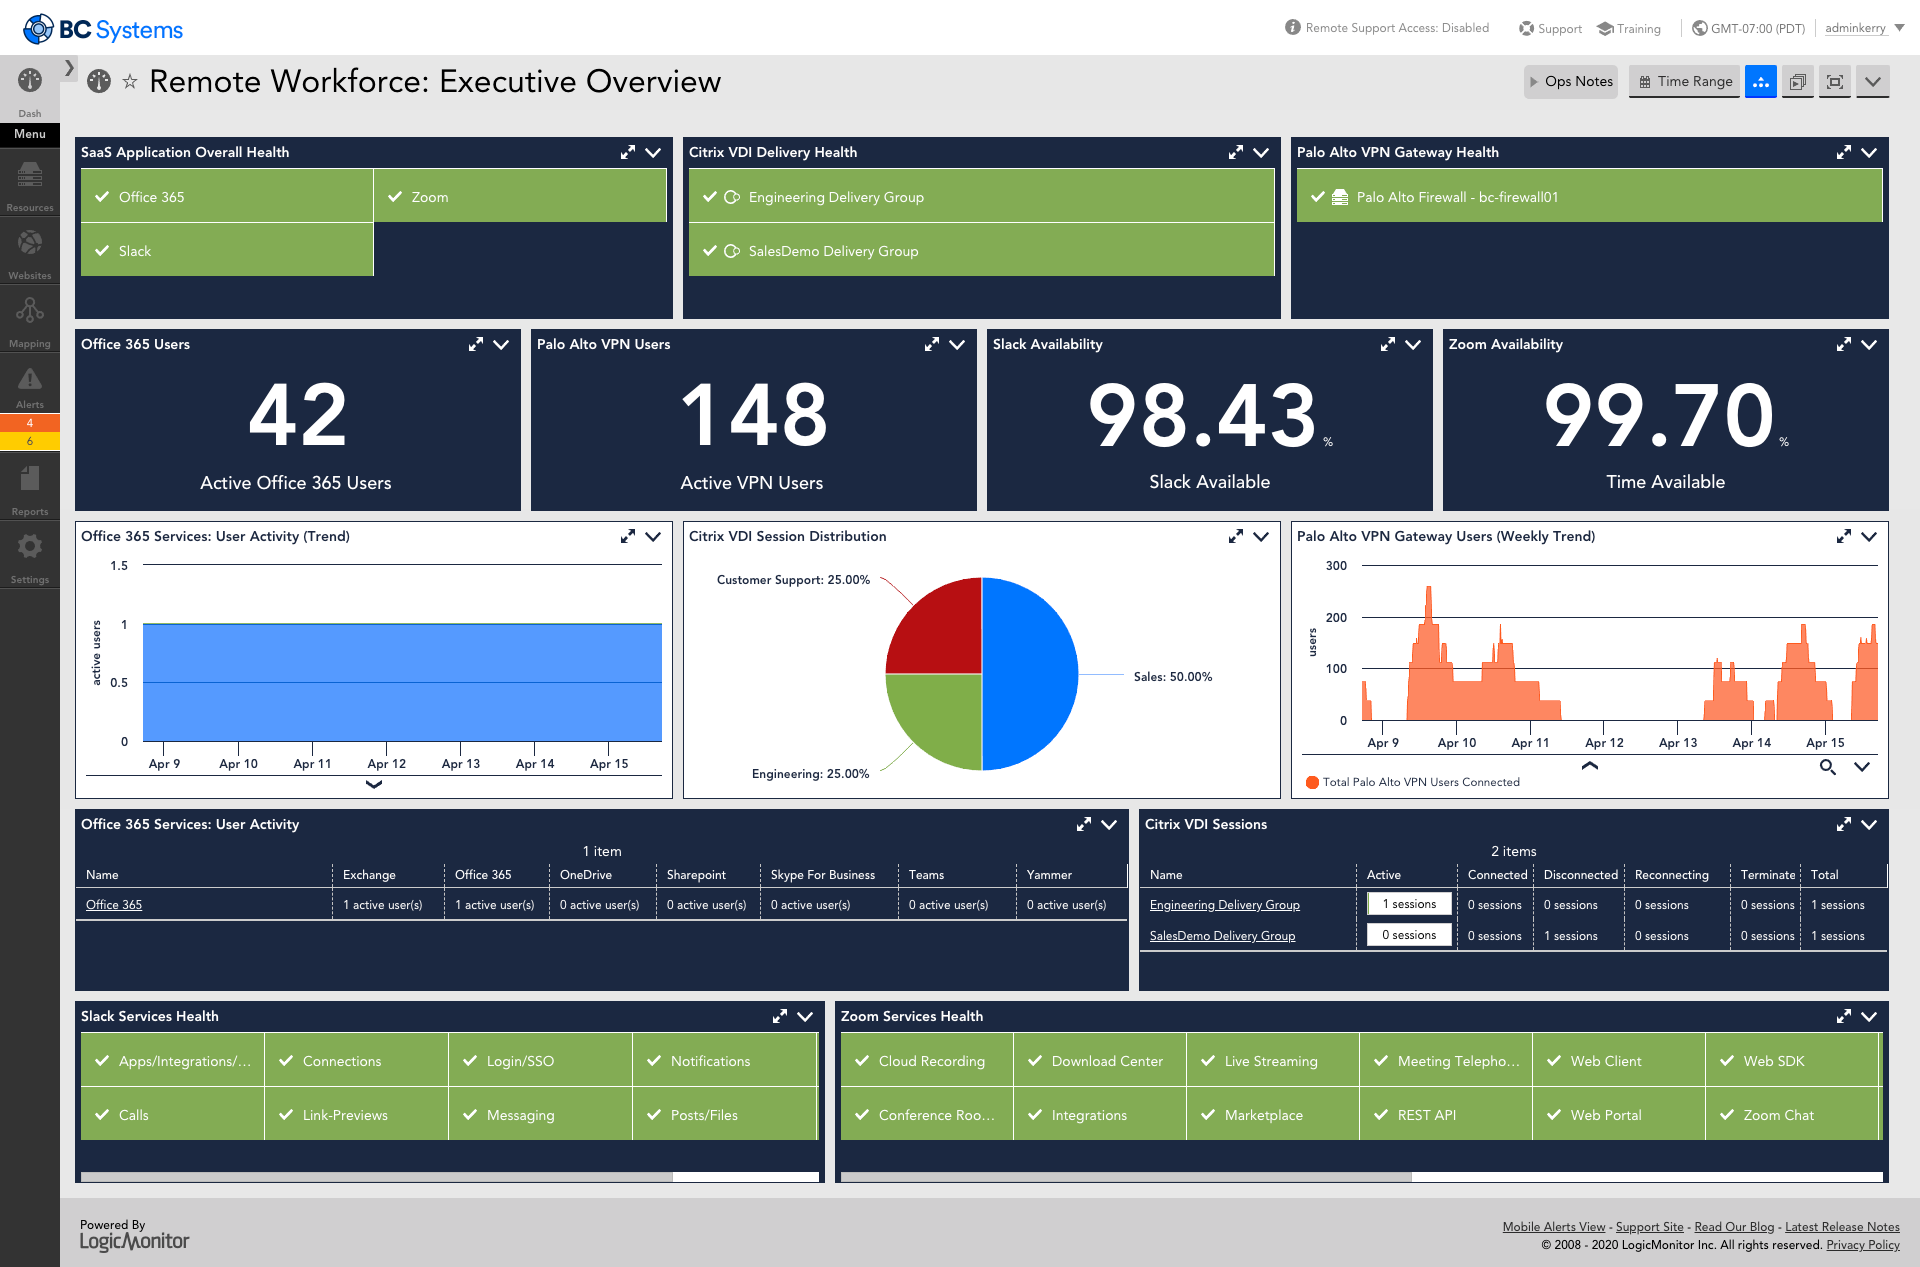
LogicMonitor’s SaaS-based platform, LM Envision, enables observability across on-prem and multi-cloud environments. It provides IT and business teams operational visibility and predictability across their technologies and applications.
N/A
NetApp Digital Advisor
Score9.1 out of 10
N/A
NetApp Digital Advisor powered by Active IQ uses AIOps to automate the proactive care and optimization of NetApp environments. It works in the background to uncover opportunities to protect and support the storage environment, providing analytics-based insights, prescriptive guidance, and automated action to improve system health and create higher system availability.
N/A
Pricing
LogicMonitor
NetApp Digital Advisor
Editions & Modules
Enterprise
Contact sales team
Website Monitoring
Contact sales team
No answers on this topic
Offerings
Pricing Offerings
LogicMonitor
NetApp Digital Advisor
Free Trial
Yes
No
Free/Freemium Version
No
No
Premium Consulting/Integration Services
Yes
No
Entry-level Setup Fee
No setup fee
No setup fee
Additional Details
Our platform is broken down into Pro and Enterprise Pricing. Pro includes monitoring for all of your cloud, hybrid, and on-premises infrastructure. Our Enterprise package includes all of this, plus our AIOps and Machine Learning functionality that provides dynamic thresholds, root cause analysis, anomaly detection and more!
LogicMonitor only charges by the device. What is considered a device? A device is anything with an IP address that you want to monitor, including a physical device or a cloud resource. This means multiple data sources under the same IP address can be monitored for the same price. Unlike some monitoring platforms. we don’t charge per node, interface, or metric.
—
More Pricing Information
Community Pulse
LogicMonitor
NetApp Digital Advisor
Considered Both Products
LogicMonitor
Verified User
Chose LogicMonitor
Prior to LogicMonitor we used a number of vendor tools with email alerting the standard for daily monitoring and alerting. This involved a lot of manual legwork to access environments via various remote access tools and as services scales this became unworkable due to the …
A de minimis incentive was given to thank the reviewer for their time. The incentive was not used to bias or drive a particular response, nor was the incentive contingent on a positive endorsement. More Info
For environments that mostly use VMs and baremetal devices, LogicMonitor is a fantastic choice. It lends itself especially well to situations where you want individual teams to be able to manage the monitoring and observability of their own domains, and if you take the time to customize it to your environment in the frontend, you can get to the point where your LogicMonitor platform administrators are very rarely needed.
A de minimis incentive was given to thank the reviewer for their time. The incentive was not used to bias or drive a particular response, nor was the incentive contingent on a positive endorsement. More Info
If you have a NetApp or multiple NetApps, then you SHOULD use NetApp Active IQ. It is an invaluable tool. It acts like another FTE in our environment by keeping us informed. NetApp Active IQ is an excellent product; there are always areas for improvement based on evolving customer needs. NetApp Active IQ is a compliment to NetApp, pure and simple! Keep it linked at all times and make your account managers a part of your team; the product works so well, give your account managers something to do, have them keep you informed and have them help you update. I have seen a major change in NetApp account teams; they want to support their customers! Good Job NetApp!
A de minimis incentive was given to thank the reviewer for their time. The incentive was not used to bias or drive a particular response, nor was the incentive contingent on a positive endorsement. More Info
A de minimis incentive was given to thank the reviewer for their time. The incentive was not used to bias or drive a particular response, nor was the incentive contingent on a positive endorsement. TR verified that a representative sample of customers was invited. More Info
A de minimis incentive was given to thank the reviewer for their time. The incentive was not used to bias or drive a particular response, nor was the incentive contingent on a positive endorsement. More Info
A de minimis incentive was given to thank the reviewer for their time. The incentive was not used to bias or drive a particular response, nor was the incentive contingent on a positive endorsement. More Info
A de minimis incentive was given to thank the reviewer for their time. The incentive was not used to bias or drive a particular response, nor was the incentive contingent on a positive endorsement. More Info
This product has met virtually all of our needs. It was easy to implement and has been simple to support. Customization has been intuitive with many options available. They keep adding features and expanding available options. The future of LogicMonitor looks even better than it is today which is very promising. The management and support teams at LogicMonitor are always helpful
A de minimis incentive was given to thank the reviewer for their time. The incentive was not used to bias or drive a particular response, nor was the incentive contingent on a positive endorsement. More Info
Set up is super easy. Just stand up a small Linux or Windows server to act as a collector. There are no agents to install on monitored devices and all you need is SNMP or WMI access. When creating dashboards, all you have to do is find the widget on the device you want to show up and choose the menu option to add it.
A de minimis incentive was given to thank the reviewer for their time. The incentive was not used to bias or drive a particular response, nor was the incentive contingent on a positive endorsement. More Info
Despite some interface issues, it mostly accomplishes what we need it to accomplish - give us a heads up on problems in our environment and prepare us for upgrades/patches.
A de minimis incentive was given to thank the reviewer for their time. The incentive was not used to bias or drive a particular response, nor was the incentive contingent on a positive endorsement. More Info
The sales team support we received was top notch. They worked hand in hand to make sure the product met all expectations. So far we have not really had to work with support that much; we have worked with setup team after purchase to deploy product fully. No issues so far and we are four weeks in.
A de minimis incentive was given to thank the reviewer for their time. The incentive was not used to bias or drive a particular response, nor was the incentive contingent on a positive endorsement. More Info
A de minimis incentive was given to thank the reviewer for their time. The incentive was not used to bias or drive a particular response, nor was the incentive contingent on a positive endorsement. More Info
A de minimis incentive was given to thank the reviewer for their time. The incentive was not used to bias or drive a particular response, nor was the incentive contingent on a positive endorsement. More Info
The implementation experience was awesome for me, as the LogicMonitor team was really helpful to us. They installed everything on our primary server and provided clear, intelligible explanations. They even trained our non-tech team on it as well. Therefore, my team and I had a very simple and pleasurable implementation experience.
A de minimis incentive was given to thank the reviewer for their time. The incentive was not used to bias or drive a particular response, nor was the incentive contingent on a positive endorsement. More Info
Our business used the trial period they provided on one of our systems and conducted sessions with all of this software. Our team tested all of these software options before deciding on LogicMonitor, as our business is expanding daily and we needed a system that could accommodate our growing workforce and automatically add systems to our network, which LogicMonitor alone provided.
A de minimis incentive was given to thank the reviewer for their time. The incentive was not used to bias or drive a particular response, nor was the incentive contingent on a positive endorsement. TR verified that a representative sample of customers was invited. More Info
You can see the list of tools above; NetApp Active IQ is a compliment to the tools. Not one monitor will take care of all your needs. I am ok with 3 dashboards for my environment. SolarWinds rotates in NOC mode, NetApp Active IQ is up on its own with all the NetApp's registered, and the Palo Alto Dashboard which monitors for vulnerabilities and risks. The tools work hand in hand in the environment, working both North/South and East/West, letting us know about anomalies, risks, and pending tasks to schedule. I love ALL my tools working together; lets me sleep really well at night!
A de minimis incentive was given to thank the reviewer for their time. The incentive was not used to bias or drive a particular response, nor was the incentive contingent on a positive endorsement. More Info
Pricing seems to be getting more and more aggressive, I worry that it's going to turn into ServiceNow or SAP and everything minor feature will be an extreme cost that prices out us and our customers
A de minimis incentive was given to thank the reviewer for their time. The incentive was not used to bias or drive a particular response, nor was the incentive contingent on a positive endorsement. More Info
Haven't really used it but our initial onboarding PS was disappointing. Felt like we were being told what we needed to cover as opposed to what we wanted to cover. In addition, we were pushed into using the PS in tight time frames and we were not ready to do so.
A de minimis incentive was given to thank the reviewer for their time. The incentive was not used to bias or drive a particular response, nor was the incentive contingent on a positive endorsement. More Info
A de minimis incentive was given to thank the reviewer for their time. The incentive was not used to bias or drive a particular response, nor was the incentive contingent on a positive endorsement. TR verified that a representative sample of customers was invited. More Info
It has caught problems on our clusters before they became true issues. It was immensely helpful to be aware of the problem so we could resolve in advance.
It has provided specific steps to mitigate issues during patching and upgrades that we wouldn't have otherwise known about.
A de minimis incentive was given to thank the reviewer for their time. The incentive was not used to bias or drive a particular response, nor was the incentive contingent on a positive endorsement. More Info