
Galen Mosier
Analyst
Chose Microsoft Power BI
| Product | Rating | Most Used By | Product Summary | Starting Price |
|---|---|---|---|---|
 Microsoft Power BI | N/A | Microsoft Power BI is a visualization and data discovery tool from Microsoft. It allows users to convert data into visuals and graphics, visually explore and analyze data, collaborate on interactive dashboards and reports, and scale across their organization with built-in governance and security. | $168 per year per user | |
 QlikView | N/A | QlikView® is Qlik®’s original BI offering designed primarily for shared business intelligence reports and data visualizations. It offers guided exploration and discovery, collaborative analytics for sharing insight, and agile development and deployment. | N/A | |
 ThoughtSpot | N/A | ThoughtSpot is an Agentic Analytics Platform for enterprises where users ask data questions using natural language and get answers with AI. Code-first for data teams and code-free for business users, ThoughtSpot can handle large, complex cloud data at scale. | $1,500 per year (5 users) |
| Microsoft Power BI | QlikView | ThoughtSpot | ||||||||||||||||||||||
|---|---|---|---|---|---|---|---|---|---|---|---|---|---|---|---|---|---|---|---|---|---|---|---|---|
| Editions & Modules |
|
|
| |||||||||||||||||||||
| Offerings |
| |||||||||||||||||||||||
| Entry-level Setup Fee | No setup fee | Optional | Optional | |||||||||||||||||||||
| Additional Details | Power BI Desktop is the data exploration and report authoring experience for Power BI, and is available as a free download. | On an perpetual license basis, based on server plus number of users. Contact vendor for pricing. | — | |||||||||||||||||||||
| More Pricing Information | ||||||||||||||||||||||||
| Microsoft Power BI | QlikView | ThoughtSpot | |
|---|---|---|---|
| Considered Multiple Products | Microsoft Power BI Galen Mosier Analyst Chose Microsoft Power BI  Rohit Acharya Business Intelligence Manager Chose Microsoft Power BI  Guillermo Villamizar Project Manager Chose Microsoft Power BI Microsoft Power BI was a little more expensive when comparing it to the competition, but it also offers a lot more options and is more flexible as well. Also, the quality and appearance of the reports and charts was more good looking and aesthetically pleasing than the other …  Purav Vaidya Vice President, Mobile technology Chose Microsoft Power BI Microsoft BI tool does a better job than most of the other software. The reason is excellent visualizations and its capability to connect with various other software and data sources. Tableau does a better job when it comes to tutorials and being more user-friendly. Also …  Litzi Saraí Gordils Ortuño Purchasing Coordinator Chose Microsoft Power BI Power BI takes it to another level with the report and dashboard designing for a wide variety of purposes, and always gives you the option to be collaborative within their native sync features, that is also an advantage to set things up, for example, to promote reports into …  Kevin Lee Elder Associate Professor Chose Microsoft Power BI Much easier learning curve and integration with Microsoft Office gives it a leg up. People not knowing they have it, believe it or not, is limiting it's usage. Microsoft really needs to market it!  Quan Khong Practice Lead - Corporate Performance Management Chose Microsoft Power BI Power BI is a lot easier to use. The designs are also much nicer. Costs to implement Power BI (minus the existing data infrastructure) is much lower than other tools commercially available. However, the tool is still relatively new and still lacks many common features that …  Richard Bird IT Software Administrator Chose Microsoft Power BI I thinking Microsoft Power BI is a great start for someone who wants something more powerful and distributable than Excel. During my relatively short evaluation, I did not find Power BI to be up to the task of more powerful tools. However it might compete well if properly … |  QlikView  Nestor Ramirez Strategic Technical Director Chose QlikView Qlik was less intuitive than Paxata, but less expensive than either microstrategy or PowerBI. Qlik has enough breadth to accommodate most use cases without breaking the bank. | ThoughtSpot |
| Microsoft Power BI | QlikView | ThoughtSpot | |||||||||||||||||||||||||||
|---|---|---|---|---|---|---|---|---|---|---|---|---|---|---|---|---|---|---|---|---|---|---|---|---|---|---|---|---|---|
| BI Standard Reporting |
| ||||||||||||||||||||||||||||
| Ad-hoc Reporting |
| ||||||||||||||||||||||||||||
| Report Output and Scheduling |
| ||||||||||||||||||||||||||||
| Data Discovery and Visualization |
| ||||||||||||||||||||||||||||
| Access Control and Security |
| ||||||||||||||||||||||||||||
| Mobile Capabilities |
| ||||||||||||||||||||||||||||
| Application Program Interfaces (APIs) / Embedding |
|
| Microsoft Power BI | QlikView | ThoughtSpot | |
|---|---|---|---|
| Small Businesses |  Yellowfin Score 8.7 out of 10 | Yellowfin Score 8.7 out of 10 | Yellowfin Score 8.7 out of 10 |
| Medium-sized Companies |  Reveal Score 10.0 out of 10 | Reveal Score 10.0 out of 10 | Reveal Score 10.0 out of 10 |
| Enterprises |  Kyvos Semantic Layer Score 9.5 out of 10 | Kyvos Semantic Layer Score 9.5 out of 10 | Kyvos Semantic Layer Score 9.5 out of 10 |
| All Alternatives | View all alternatives | View all alternatives | View all alternatives |
| Microsoft Power BI | QlikView | ThoughtSpot | |
|---|---|---|---|
| Likelihood to Recommend | 8.5 (197 ratings) | 7.7 (88 ratings) | 8.5 (91 ratings) |
| Likelihood to Renew | 9.5 (3 ratings) | 8.8 (29 ratings) | 10.0 (6 ratings) |
| Usability | 8.3 (113 ratings) | 8.0 (15 ratings) | 8.3 (85 ratings) |
| Availability | - (0 ratings) | 9.8 (4 ratings) | 9.0 (3 ratings) |
| Performance | - (0 ratings) | 8.6 (4 ratings) | 8.0 (3 ratings) |
| Support Rating | 10.0 (52 ratings) | 3.3 (15 ratings) | 8.0 (4 ratings) |
| In-Person Training | - (0 ratings) | - (0 ratings) | 5.0 (1 ratings) |
| Online Training | - (0 ratings) | 8.0 (3 ratings) | 4.0 (1 ratings) |
| Implementation Rating | 9.0 (1 ratings) | 7.4 (13 ratings) | 7.0 (2 ratings) |
| Configurability | - (0 ratings) | - (0 ratings) | 8.0 (1 ratings) |
| Ease of integration | - (0 ratings) | - (0 ratings) | 9.0 (1 ratings) |
| Product Scalability | - (0 ratings) | 8.9 (2 ratings) | 8.0 (3 ratings) |
| Vendor post-sale | - (0 ratings) | - (0 ratings) | 8.0 (1 ratings) |
| Vendor pre-sale | - (0 ratings) | - (0 ratings) | 9.0 (1 ratings) |
| Microsoft Power BI | QlikView | ThoughtSpot | |
|---|---|---|---|
| Likelihood to Recommend | Microsoft
| Qlik
| ThoughtSpot
|
| Pros | Microsoft
| Qlik
 Jake Tolbert Director of Development - Data Services | ThoughtSpot
|
| Cons | Microsoft
| Qlik
| ThoughtSpot
|
| Likelihood to Renew | Microsoft
 David Jensen Operations Manager, Customer Success | Qlik
 Debbie Pyykkonen, MBA Director of Business Analytics | ThoughtSpot
|
| Usability | Microsoft
| Qlik
| ThoughtSpot
|
| Reliability and Availability | Microsoft No answers on this topic | Qlik
 Bill Chamberlain Partner | ThoughtSpot
|
| Performance | Microsoft No answers on this topic | Qlik
| ThoughtSpot
|
| Support Rating | Microsoft
| Qlik
| ThoughtSpot
|
| In-Person Training | Microsoft No answers on this topic | Qlik
| ThoughtSpot
|
| Online Training | Microsoft No answers on this topic | Qlik
 Robert Goodman Director, Business Intelligence & Analytics | ThoughtSpot
|
| Implementation Rating | Microsoft
 Anuj Sant Senior buyer | Qlik
 David Worrell CFO (Chief Financial Officer) | ThoughtSpot
 Surya Ravi BI Solutions Engineer |
| Alternatives Considered | Microsoft
| Qlik
| ThoughtSpot
 Torsten Wiegel Augmented Analytics Consultant |
| Scalability | Microsoft No answers on this topic | Qlik No answers on this topic | ThoughtSpot
|
| Return on Investment | Microsoft
| Qlik
 Mark McHenry Marketing | ThoughtSpot
 Chris Mann VP Product Strategy |
| ScreenShots | Microsoft Power BI Screenshots      | QlikView Screenshots   | ThoughtSpot Screenshots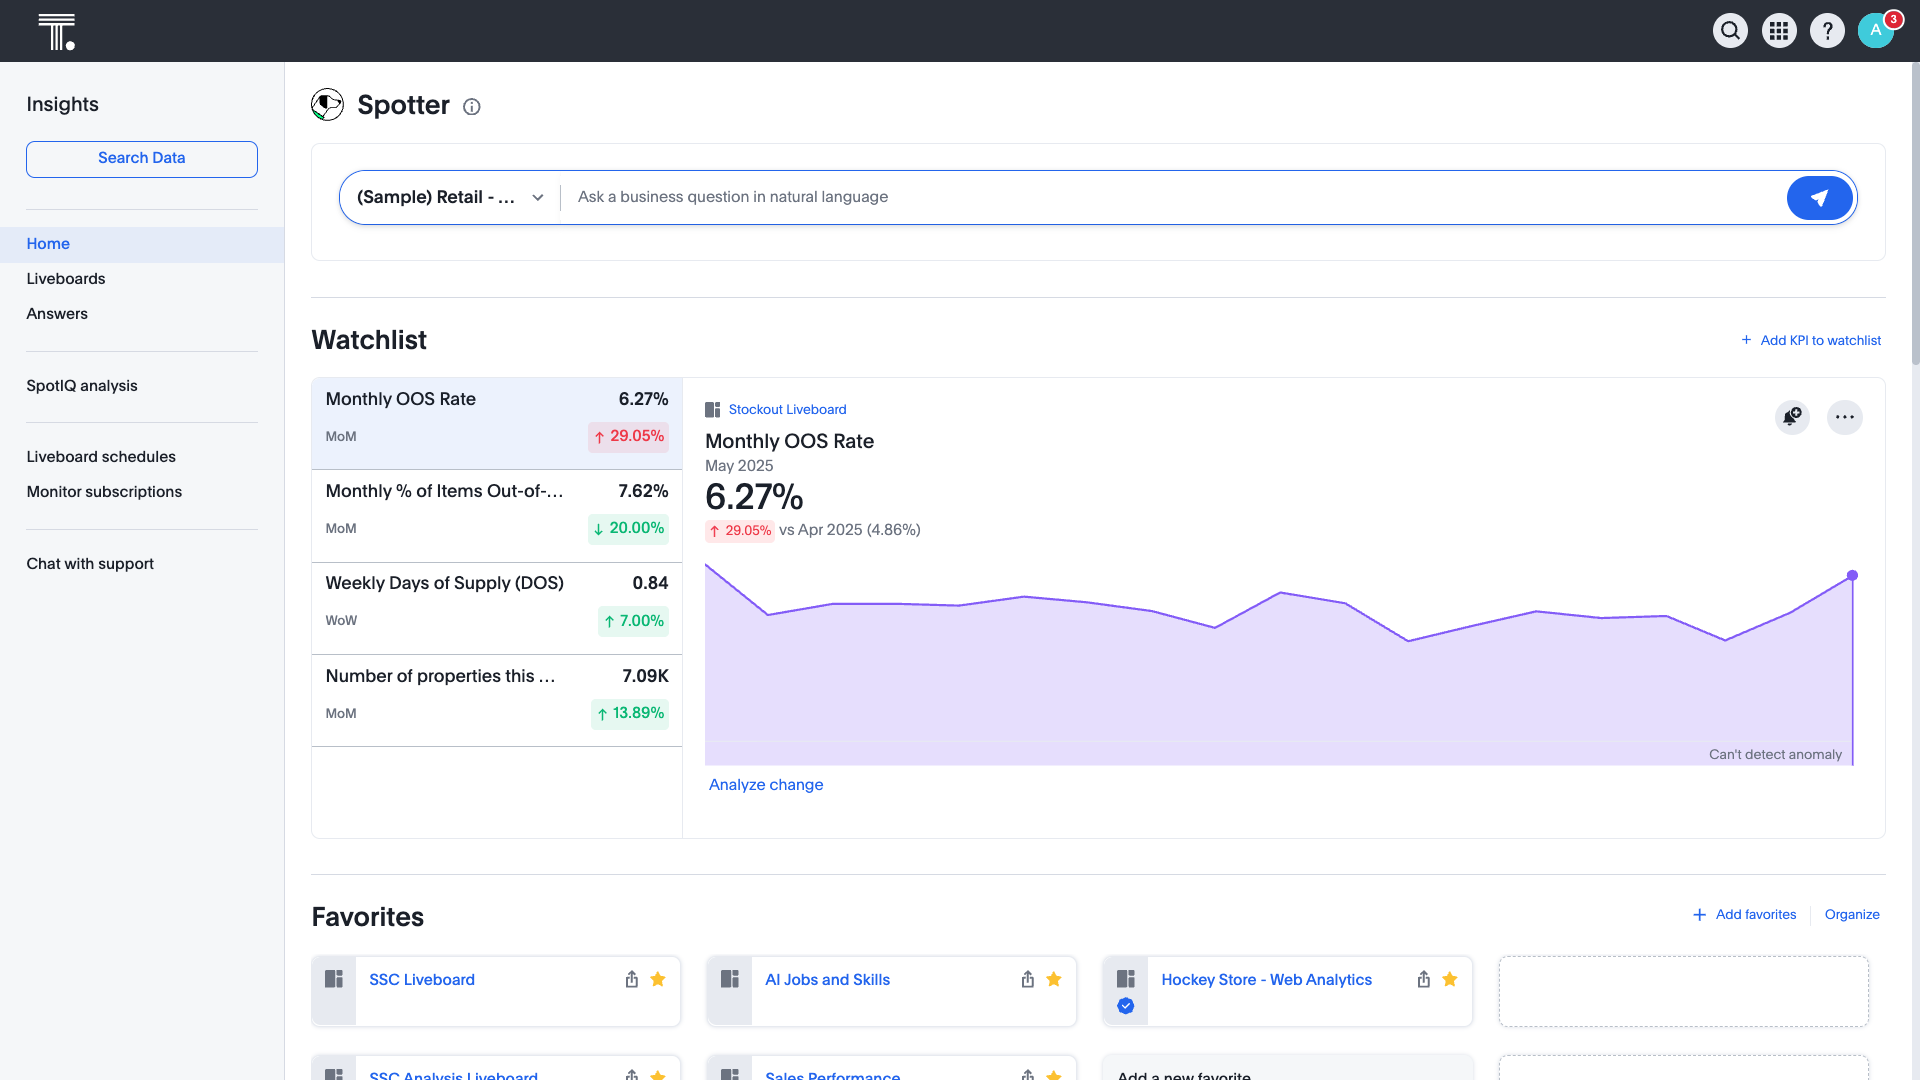  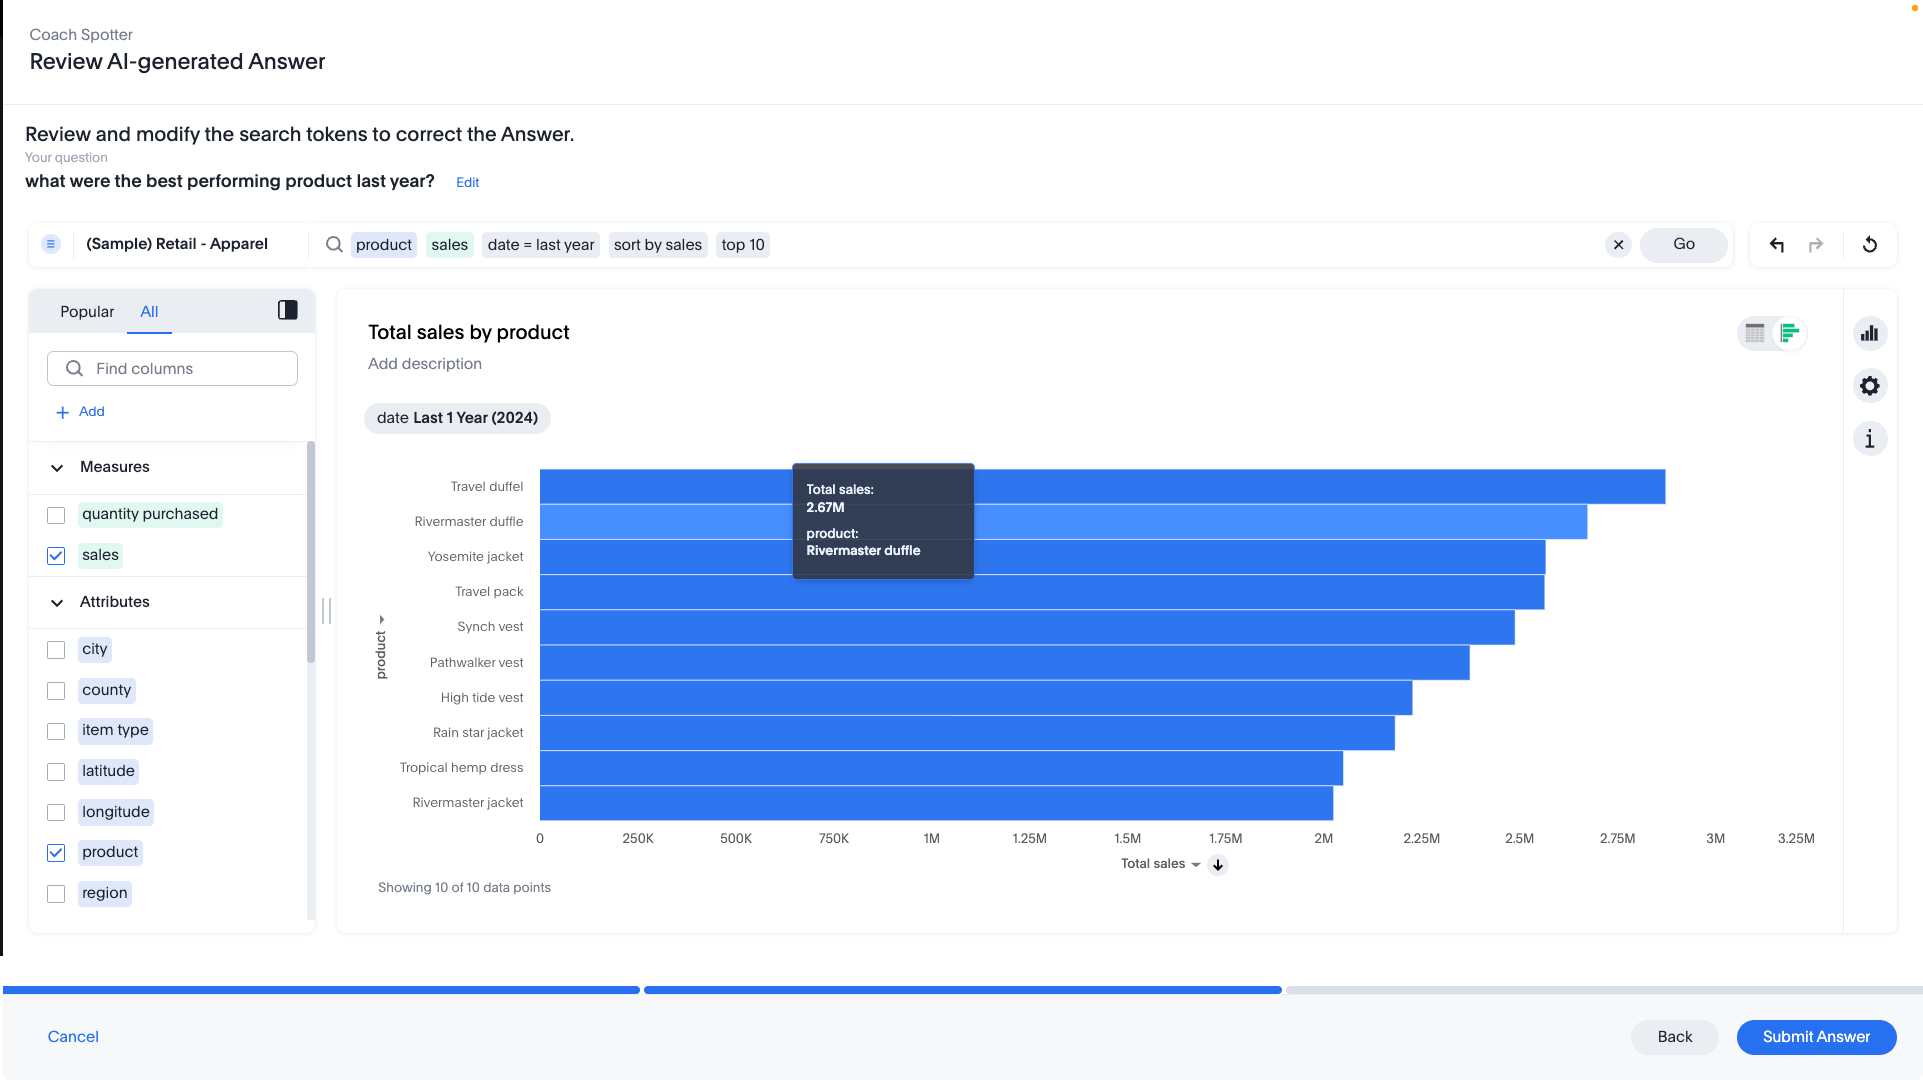 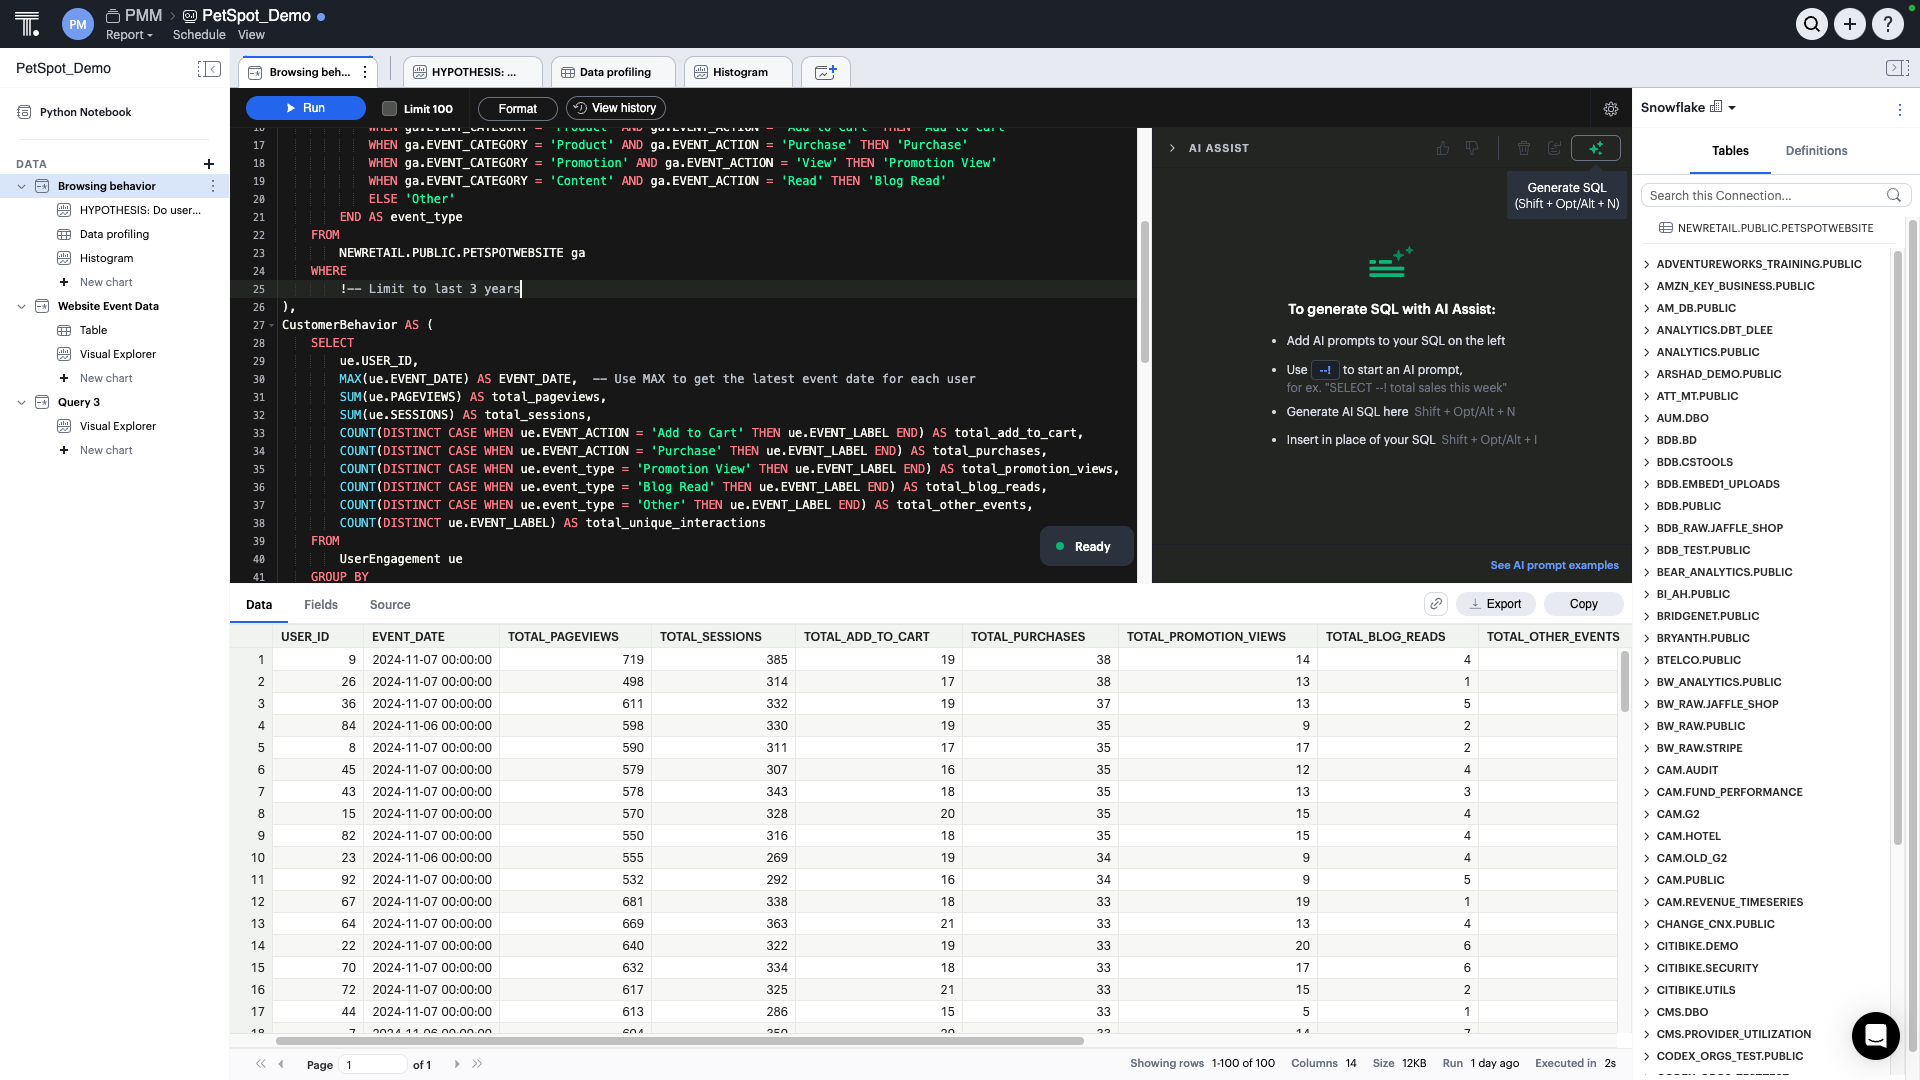  |