New Relic vs. SolarWinds Database Performance Monitor

Overview
ProductRatingMost Used ByProduct SummaryStarting Price
New Relic
Score 8.0 out of 10
N/A
New Relic is a SaaS-based web and mobile application performance management provider for the cloud and the datacenter. They provide code-level diagnostics for dedicated infrastructures, the cloud, or hybrid environments and real time monitoring.
$0
No credit card required; 100 GB free ingest per month, 1 free full user + unlimited basic users, 8 days retention, 100 Synthetics Checks
SolarWinds Database Performance Monitor
Score 8.9 out of 10
N/A
VividCortex, acquired by SolarWinds in December 2019, provides database performance monitoring designed to increase system performance, team efficiency, and infrastructure cost savings. The GDPR- and SOC 2-compliant platform offers visibility into major open-source databases—MySQL, PostgreSQL, Amazon Aurora, MongoDB, and Redis—for the engineering team at scale. Industry leaders like Etsy, GitHub, SendGrid, and Yelp rely on Database Performance Monitor for all-query monitoring and drill…N/A
Pricing
New RelicSolarWinds Database Performance Monitor
Editions & Modules
Free (Forever)
$0
No credit card required; 100 GB free ingest per month, 1 free full user + unlimited basic users, 8 days retention, 100 Synthetics Checks
Telemetry Data Platform
$0.25
per month per extra GB data ingest (after first free 100GB per month)
Incident Intelligence
$0.50
per month per event (after first 1000 free events per month)
Standard
$99
per month per full user (after first free full user - unlimited free basic users)
Pro
Contact sales team
Enterprise
Contact sales team
No answers on this topic
Offerings
Pricing Offerings
New RelicSolarWinds Database Performance Monitor
Free Trial
NoYes
Free/Freemium Version
YesNo
Premium Consulting/Integration Services
NoYes
Entry-level Setup FeeNo setup feeNo setup fee
Additional Details
More Pricing Information
Community Pulse
New RelicSolarWinds Database Performance Monitor
Best Alternatives
New RelicSolarWinds Database Performance Monitor
Small Businesses
InfluxDB
InfluxDB
Score 8.8 out of 10

No answers on this topic

Medium-sized Companies
Sumo Logic
Sumo Logic
Score 9.3 out of 10
LogicMonitor
LogicMonitor
Score 8.9 out of 10
Enterprises
NetBrain Technologies
Score 9.2 out of 10
LogicMonitor
LogicMonitor
Score 8.9 out of 10
All AlternativesView all alternativesView all alternatives
User Ratings
New RelicSolarWinds Database Performance Monitor
Likelihood to Recommend
7.9
(145 ratings)
8.0
(1 ratings)
Likelihood to Renew
8.8
(16 ratings)
-
(0 ratings)
Usability
8.2
(11 ratings)
-
(0 ratings)
Availability
9.1
(2 ratings)
-
(0 ratings)
Performance
9.1
(2 ratings)
-
(0 ratings)
Support Rating
9.0
(7 ratings)
-
(0 ratings)
Implementation Rating
8.0
(9 ratings)
-
(0 ratings)
Configurability
7.3
(3 ratings)
-
(0 ratings)
Ease of integration
9.0
(1 ratings)
-
(0 ratings)
Product Scalability
9.1
(2 ratings)
-
(0 ratings)
Vendor post-sale
8.2
(2 ratings)
-
(0 ratings)
Vendor pre-sale
8.2
(2 ratings)
-
(0 ratings)
User Testimonials
New RelicSolarWinds Database Performance Monitor
Likelihood to Recommend
New Relic
I have used New Relic in different scenarios like monitoring my production infrastructure and applications which helps us to reduce the downtime of my applications and websites and also I have used the synthetic monitoring feature which helps to proactively monitor our websites availability. Along with this I have also used New Relic for cloud resources cost monitoring which helps to reduce my cloud cost. Also I have used mobile application monitoring which helps me to trace the sessions easily and I can easily reduce my RCA through the help of that.
Read full review
SolarWinds
Computing resources consumed by the DB instance, DPA queries & wait time, deadlock conditions, virtual infrastructure resources. The addition of NPM & DPA integration as well as cross-correlation in the identification of issues with the network or server or DB is all stupid-proof. Monitoring is more than just health and resource consumption, it's also performance. DB performance analysis is key to maintaining healthy DB instances.
Read full review
Pros
New Relic
  • New Relic APM allows us to follow up transactions across services and trace performance bottlenecks in real-time, crucial when monitoring the processing of energy loads or predictive maintenance algorithms.
  • It gives us deep visibility into our cloud servers, containers and IOT gateways, so we can catch CPU spikes or memory leaks which can impact the data we ingest from the field devices.
  • We develop custom dashboards for monitoring trends of power consumption, abnormality in sensors and API health. In conjunction with alerting, it makes sure we are fixing issues before customers even see them.
Read full review
SolarWinds
  • Simple to use and very easy to learn.
  • The execution engines run in parallel, can execute any syntax or query.
  • DPN can run all queries for both Oracle and SQL with no additional support.
Read full review
Cons
New Relic
  • Support for SQL like query with more functional features of analysis while viewing distributed tracing.
  • support for very low level specific integration from APIs to classes to functions to piece of code
  • More detailed documentation, as we faced issues while integrating for the first time.
Read full review
SolarWinds
  • The Reporting feature currently doesn't allow customization.
Read full review
Likelihood to Renew
New Relic
The only issue that we have had with New Relic is that the price might be a little expensive for smaller companies. The amount of data you store in New Relic impacts the cost, and can get away from you if you don't work closely with the vendor. Overall though the application is top notch.
Read full review
SolarWinds
No answers on this topic
Usability
New Relic
I have given this much rating as I am used New Relic in different sectors and for different use cases like its K8s monitoring, infra monitoring, full stack monitoring as compare to other tools New Relic gives data in a formatted and connected way, and also it is giving us value for money. It also launches new features day by day which helps users to track the issue very quickly. It also supports OTel integrations which is the latest trend of observability tools. thats why I had given this much rating to New Relic.
Read full review
SolarWinds
No answers on this topic
Reliability and Availability
New Relic
Never observed an outage
Read full review
SolarWinds
No answers on this topic
Performance
New Relic
there are times where browser cache will cause issues that require you to clear your browser before continuing.
Read full review
SolarWinds
No answers on this topic
Support Rating
New Relic
The support team has been really helpful and resolved most of the issues on time. However, for a couple of issues, several follow-ups were needed to elicit a reasonable response. The issue was deeply technical and could have been investigated only by their Architects, and bringing them into the ticket took longer than needed
Read full review
SolarWinds
No answers on this topic
Implementation Rating
New Relic
It's better to start by implementing New Relic in one project and test everything. Try to follow best recommended practices and read all the official documentation. Everything seems well tested. Then, start by installing agents to the rest of your projects and keep a close look to all logs and metrics New Relic gives you.
Read full review
SolarWinds
No answers on this topic
Alternatives Considered
New Relic
New Relic has full stack visibility and gives us all options for observability like one stop shop. It gives you front end, backend as well synthetic monitoring capabilities. Every other feature built into one cost model (usually) which ties to data that you send, it helps you leverage all features without having to pay additional charge for feature
Read full review
SolarWinds
DPM is less expensive and more feature-rich. Also, Oracle tech support is garbage, unless you can afford to spend a day getting assistance.
Read full review
Scalability
New Relic
Agent deployment is easily integrated into our workflow. Adding the agent to new servers is quick and painless
Read full review
SolarWinds
No answers on this topic
Return on Investment
New Relic
  • We were able to quickly identify our most time consuming APIs. In some cases we were able to bring down times for some apis from 4s to 200ms.
  • We were able to identify our slowest database queries and optimize them for quicker response times.
Read full review
SolarWinds
  • What is the cost of a downed DB instance? That's your ROI. DPM lets you see issues before they become critical.
Read full review
ScreenShots

SolarWinds Database Performance Monitor Screenshots
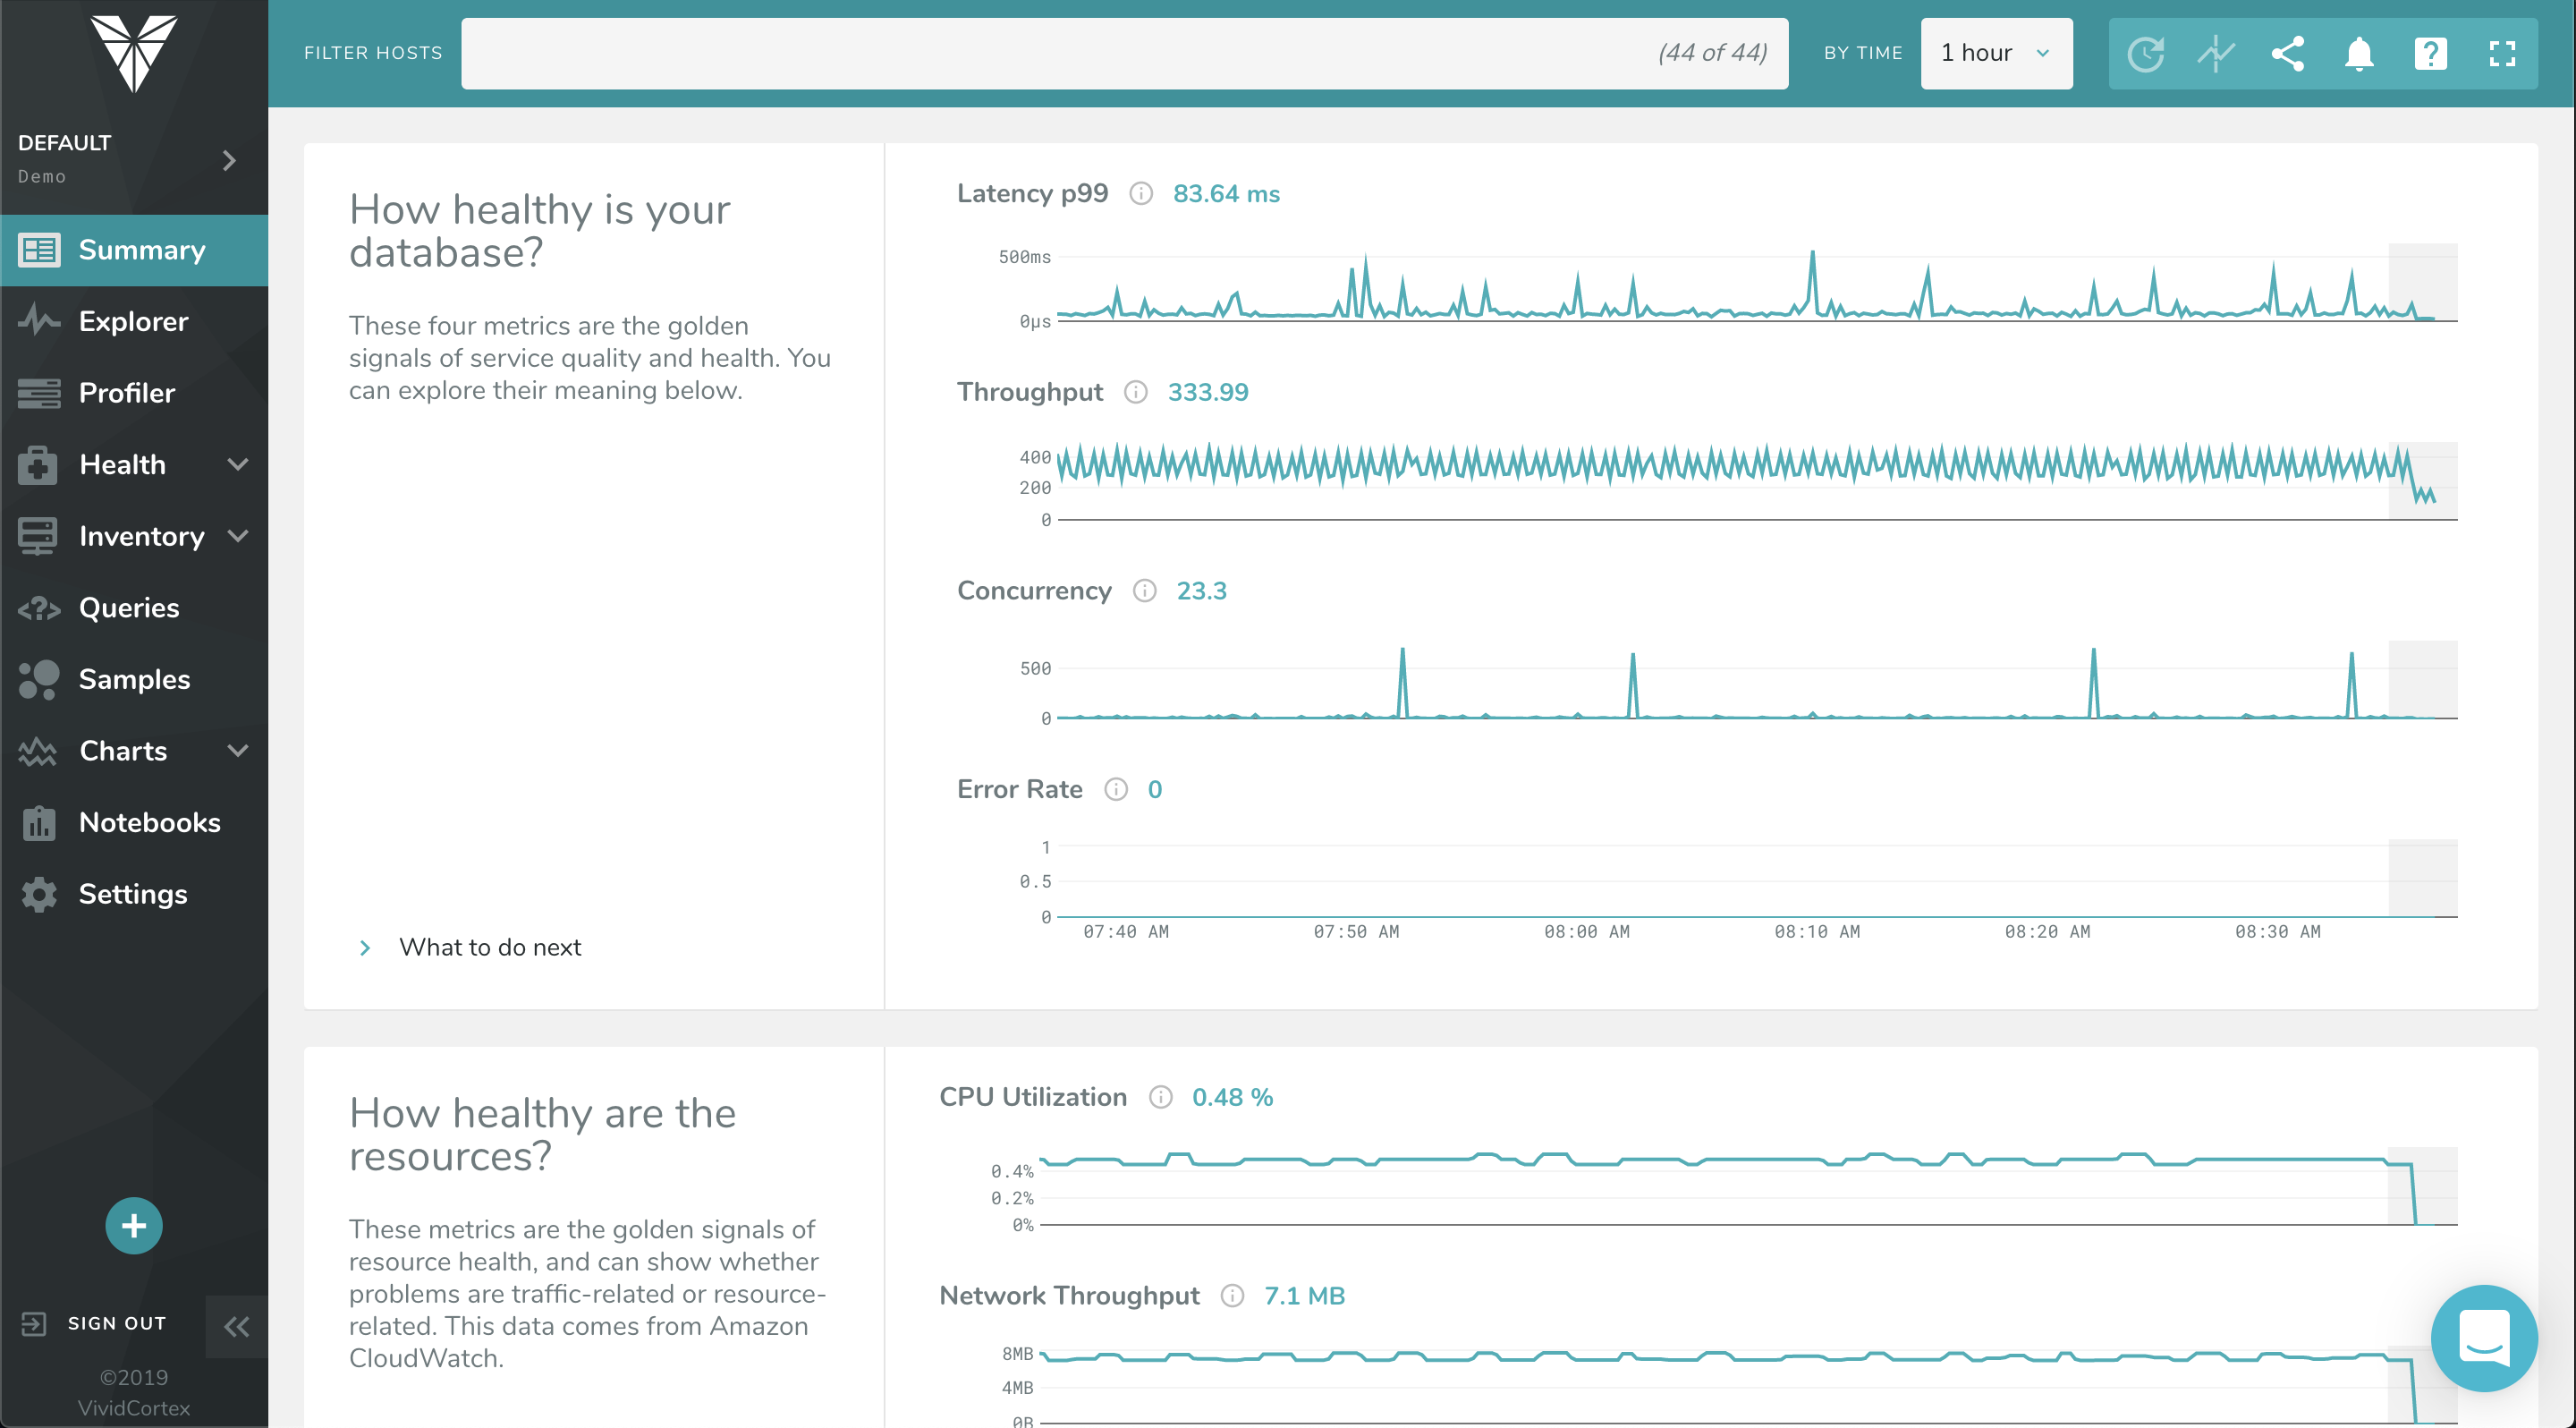
Screenshot of The Profiler Dashboard is a powerful, dynamic dashboard for ranking and filtering activity on your servers: It can instantly show you what needs attention and it provides a unified view of all your database types that VividCortex monitors. It enables you to view and understand your system by profiling it according to its most significant attributes—customized and selected by you.Screenshot of This dashboard displays a list of queries and allows you to filter them with powerful specificity. Filters can be set according to query text, host, and timeframe when the query was first seen / last active.Screenshot of VividCortex captures an enormous amount of data, and the Summary Dashboard helps users make sense of it, reducing their time-to-insight. It features widgets with automatic displays for Top 5 Queries by Total Time, Top 5 Queries by User CPU, Application Overview, Critical Events, and more.Screenshot of VividCortex monitors thousands of metrics in your system, and the Charts and Dashboard’s navigation pane allows you to toggle, customize, and enable various categories of generated charts. You can then easily navigate and examine the charts’ metrics with mouseover and zoom capabilities.