Chose Tableau Cloud
Deployment time is less than Tableau Server. Configuring Tableau Online is managed by the Tableau Team, so there is less risk.
| Product | Rating | Most Used By | Product Summary | Starting Price |
|---|---|---|---|---|
 Spreadsheet Server | N/A | The Spreadsheet Server platform is designed to work as a Microsoft add-in to provide live reporting data and analysis from the user’s ERP solution into Excel. The vendor aims to help users eliminate the hassle of re-keying or downloading any data into spreadsheets make that spreadsheet an integral part of their business environment. | N/A | |
 Tableau Cloud | N/A | Tableau Cloud (formerly Tableau Online) is a self-service analytics platform that is fully hosted in the cloud. Tableau Cloud enables users to publish dashboards and invite colleagues to explore hidden opportunities with interactive visualizations and accurate data, from any browser or mobile device. | $15 per month per user | |
 Tableau Public | N/A | Tableau Public is a free edition of the Desktop product. With this edition, data can only be published to the Tableau public website and does not allow work to be saved or exported locally. | $0 per month |
| Spreadsheet Server | Tableau Cloud | Tableau Public | ||||||||||||||||||||||
|---|---|---|---|---|---|---|---|---|---|---|---|---|---|---|---|---|---|---|---|---|---|---|---|---|
| Editions & Modules | No answers on this topic |
| No answers on this topic | |||||||||||||||||||||
| Offerings |
| |||||||||||||||||||||||
| Entry-level Setup Fee | No setup fee | No setup fee | No setup fee | |||||||||||||||||||||
| Additional Details | Prices can be different for any company interested in Spreadsheet Server depending on size and who should be involved. Feel free to contact us for a free demo to see if it is the right reporting tool for you. | — | — | |||||||||||||||||||||
| More Pricing Information | ||||||||||||||||||||||||
| Spreadsheet Server | Tableau Cloud | Tableau Public | |
|---|---|---|---|
| Considered Multiple Products |  Spreadsheet Server No answer on this topic | Tableau Cloud  Lance Smith Business Intelligence Analyst Chose Tableau Cloud I feel like Tableau is easier to use compared with the SAP Business Objects. Both have a bit of a learning curve but I felt that Tableau Online was still more intuitive and user friendly. Tableau Desktop is a powerhouse. It has a very steep learning curve but once you master … | Tableau Public  Christopher Penn Chief Data Scientist Chose Tableau Public Tableau Public's primary advantage is its lack of cost. That's really what it excels at; otherwise, it's functionally just another Tableau Server. |
| Spreadsheet Server | Tableau Cloud | Tableau Public | |||||||||||||||||||||||||||
|---|---|---|---|---|---|---|---|---|---|---|---|---|---|---|---|---|---|---|---|---|---|---|---|---|---|---|---|---|---|
| Security |
| ||||||||||||||||||||||||||||
| Reporting & Analytics |
| ||||||||||||||||||||||||||||
| Customization |
| ||||||||||||||||||||||||||||
| BI Standard Reporting |
| ||||||||||||||||||||||||||||
| Ad-hoc Reporting |
| ||||||||||||||||||||||||||||
| Report Output and Scheduling |
| ||||||||||||||||||||||||||||
| Data Discovery and Visualization |
| ||||||||||||||||||||||||||||
| Access Control and Security |
| ||||||||||||||||||||||||||||
| Mobile Capabilities |
| ||||||||||||||||||||||||||||
| Application Program Interfaces (APIs) / Embedding |
|
| Spreadsheet Server | Tableau Cloud | Tableau Public | |
|---|---|---|---|
| Small Businesses |  QuickBooks Self-Employed (discontinued) Score 6.4 out of 10 |  Yellowfin Score 8.7 out of 10 |  Supermetrics Score 9.7 out of 10 |
| Medium-sized Companies |  Zoho Books Score 9.1 out of 10 |  Reveal Score 10.0 out of 10 | Supermetrics Score 9.7 out of 10 |
| Enterprises |  SAP Cloud ERP Score 8.6 out of 10 |  Kyvos Semantic Layer Score 9.5 out of 10 |  IBM Analytics Engine Score 7.2 out of 10 |
| All Alternatives | View all alternatives | View all alternatives | View all alternatives |
| Spreadsheet Server | Tableau Cloud | Tableau Public | |
|---|---|---|---|
| Likelihood to Recommend | 8.0 (7 ratings) | 9.3 (75 ratings) | 8.5 (14 ratings) |
| Likelihood to Renew | 9.0 (1 ratings) | - (0 ratings) | 9.1 (2 ratings) |
| Usability | 8.0 (1 ratings) | 8.8 (28 ratings) | 10.0 (5 ratings) |
| Support Rating | 6.0 (1 ratings) | 8.7 (20 ratings) | 9.6 (6 ratings) |
| Online Training | - (0 ratings) | - (0 ratings) | 9.0 (1 ratings) |
| Implementation Rating | - (0 ratings) | - (0 ratings) | 9.1 (2 ratings) |
| Spreadsheet Server | Tableau Cloud | Tableau Public | |
|---|---|---|---|
| Likelihood to Recommend | Insightsoftware, Inc
| Tableau
| Tableau
|
| Pros | Insightsoftware, Inc
 Mary Soffner Controller | Tableau
 Raman Ahuja Associate Consultant | Tableau
 Leah Jakaitis Senior Data Analyst |
| Cons | Insightsoftware, Inc
| Tableau
| Tableau
 Steven Bohlender Executive Vice President |
| Likelihood to Renew | Insightsoftware, Inc
 Pamela Lee, CPA Sr. Manager Internal Auditor | Tableau No answers on this topic | Tableau
 Bonnie Holub Honeywell Endowed Chair in Global Technology Management |
| Usability | Insightsoftware, Inc
| Tableau
| Tableau |
| Support Rating | Insightsoftware, Inc
| Tableau
| Tableau
|
| Online Training | Insightsoftware, Inc No answers on this topic | Tableau No answers on this topic | Tableau
Bonnie Holub Honeywell Endowed Chair in Global Technology Management |
| Implementation Rating | Insightsoftware, Inc No answers on this topic | Tableau No answers on this topic | Tableau
Steven Bohlender Executive Vice President |
| Alternatives Considered | Insightsoftware, Inc
Mary Soffner Controller | Tableau
| Tableau
|
| Return on Investment | Insightsoftware, Inc
| Tableau
 Tom Laughlin Senior Customer Success Manager | Tableau
Christopher Penn Chief Data Scientist |
| ScreenShots | Spreadsheet Server Screenshots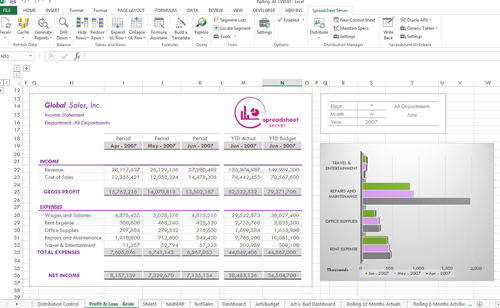  |