Overview
ProductRatingMost Used ByProduct SummaryStarting Price
Chartbeat
Score 8.9 out of 10
N/A
Chartbeat delivers real-time analytics, insights, and transformative tools for content teams around the world, to help improve audience engagement, inform editorial decisions, and increase loyalty.N/A
Cyfe
Score 4.0 out of 10
N/A
Cyfe is all-in-one dashboard software for analyzing data from online services like Google Analytics, Salesforce, AdSense, MailChimp, Amazon, Facebook, etc, from Traject.
$29
per month
Pricing
ChartbeatCyfe, by Traject
Editions & Modules
No answers on this topic
Starter
$29
per month
Standard
$39
per month
Pro
$65
per month
Premier
$119
per month
Offerings
Pricing Offerings
ChartbeatCyfe
Free Trial
YesYes
Free/Freemium Version
NoNo
Premium Consulting/Integration Services
YesNo
Entry-level Setup FeeNo setup feeNo setup fee
Additional DetailsChartbeat pricing is based on monthly site page views. Discounts are applied to multi-year contracts. The Basic Plan includes the Real-time Dashboard, Historical Dashboard, Heads Up Display, Reports, Big Board, iOS and Android app, and Real-time API endpoints. The Plus Plan includes all of the Basic Plan features, plus ONE of the following Premium features: Headline Testing, Advanced Queries, or Multi-Site View. The Premium Plan includes all of the Basic Plan features, plus ALL Premium features: Headline Testing, Advanced Queries, Multi-Site View, and enterprise-level support and custom trainings.
More Pricing Information
Community Pulse
ChartbeatCyfe, by Traject
Features
ChartbeatCyfe, by Traject
Web Analytics
Comparison of Web Analytics features of Product A and Product B
Chartbeat
7.7
15 Ratings
5% below category average
Cyfe, by Traject
-
Ratings
Lead Conversion Tracking6.15 Ratings00 Ratings
Bounce Rate Measurement7.19 Ratings00 Ratings
Device and Browser Reporting7.714 Ratings00 Ratings
Pageview Tracking8.713 Ratings00 Ratings
Event Tracking8.08 Ratings00 Ratings
Reporting in real-time9.314 Ratings00 Ratings
Referral Source Tracking8.414 Ratings00 Ratings
Customizable Dashboards6.812 Ratings00 Ratings
BI Standard Reporting
Comparison of BI Standard Reporting features of Product A and Product B
Chartbeat
-
Ratings
Cyfe, by Traject
6.6
28 Ratings
22% below category average
Pixel Perfect reports00 Ratings6.817 Ratings
Customizable dashboards00 Ratings4.028 Ratings
Report Formatting Templates00 Ratings9.120 Ratings
Ad-hoc Reporting
Comparison of Ad-hoc Reporting features of Product A and Product B
Chartbeat
-
Ratings
Cyfe, by Traject
7.2
26 Ratings
11% below category average
Drill-down analysis00 Ratings8.715 Ratings
Formatting capabilities00 Ratings8.120 Ratings
Integration with R or other statistical packages00 Ratings10.09 Ratings
Report sharing and collaboration00 Ratings2.026 Ratings
Report Output and Scheduling
Comparison of Report Output and Scheduling features of Product A and Product B
Chartbeat
-
Ratings
Cyfe, by Traject
5.0
23 Ratings
49% below category average
Publish to Web00 Ratings4.015 Ratings
Publish to PDF00 Ratings4.021 Ratings
Report Versioning00 Ratings6.89 Ratings
Report Delivery Scheduling00 Ratings1.017 Ratings
Delivery to Remote Servers00 Ratings9.04 Ratings
Data Discovery and Visualization
Comparison of Data Discovery and Visualization features of Product A and Product B
Chartbeat
-
Ratings
Cyfe, by Traject
7.2
19 Ratings
10% below category average
Pre-built visualization formats (heatmaps, scatter plots etc.)00 Ratings3.018 Ratings
Location Analytics / Geographic Visualization00 Ratings8.614 Ratings
Predictive Analytics00 Ratings10.08 Ratings
Access Control and Security
Comparison of Access Control and Security features of Product A and Product B
Chartbeat
-
Ratings
Cyfe, by Traject
7.1
22 Ratings
18% below category average
Multi-User Support (named login)00 Ratings10.020 Ratings
Role-Based Security Model00 Ratings6.314 Ratings
Multiple Access Permission Levels (Create, Read, Delete)00 Ratings8.416 Ratings
Report-Level Access Control00 Ratings1.01 Ratings
Single Sign-On (SSO)00 Ratings9.76 Ratings
Mobile Capabilities
Comparison of Mobile Capabilities features of Product A and Product B
Chartbeat
-
Ratings
Cyfe, by Traject
9.3
19 Ratings
18% above category average
Responsive Design for Web Access00 Ratings9.418 Ratings
Mobile Application00 Ratings10.05 Ratings
Dashboard / Report / Visualization Interactivity on Mobile00 Ratings7.713 Ratings
Application Program Interfaces (APIs) / Embedding
Comparison of Application Program Interfaces (APIs) / Embedding features of Product A and Product B
Chartbeat
-
Ratings
Cyfe, by Traject
7.0
7 Ratings
10% below category average
REST API00 Ratings8.64 Ratings
Javascript API00 Ratings10.02 Ratings
iFrames00 Ratings2.05 Ratings
Java API00 Ratings10.02 Ratings
Themeable User Interface (UI)00 Ratings5.94 Ratings
Customizable Platform (Open Source)00 Ratings5.83 Ratings
Best Alternatives
ChartbeatCyfe, by Traject
Small Businesses
StatCounter
StatCounter
Score 9.0 out of 10
Yellowfin
Yellowfin
Score 8.7 out of 10
Medium-sized Companies
Optimal
Optimal
Score 9.1 out of 10
Reveal
Reveal
Score 10.0 out of 10
Enterprises
Optimal
Optimal
Score 9.1 out of 10
Kyvos Semantic Layer
Score 9.5 out of 10
All AlternativesView all alternativesView all alternatives
User Ratings
ChartbeatCyfe, by Traject
Likelihood to Recommend
9.9
(69 ratings)
8.0
(29 ratings)
Likelihood to Renew
9.9
(9 ratings)
9.4
(9 ratings)
Usability
9.9
(60 ratings)
7.0
(3 ratings)
Support Rating
8.1
(10 ratings)
10.0
(2 ratings)
Implementation Rating
-
(0 ratings)
10.0
(1 ratings)
User Testimonials
ChartbeatCyfe, by Traject
Likelihood to Recommend
Chartbeat
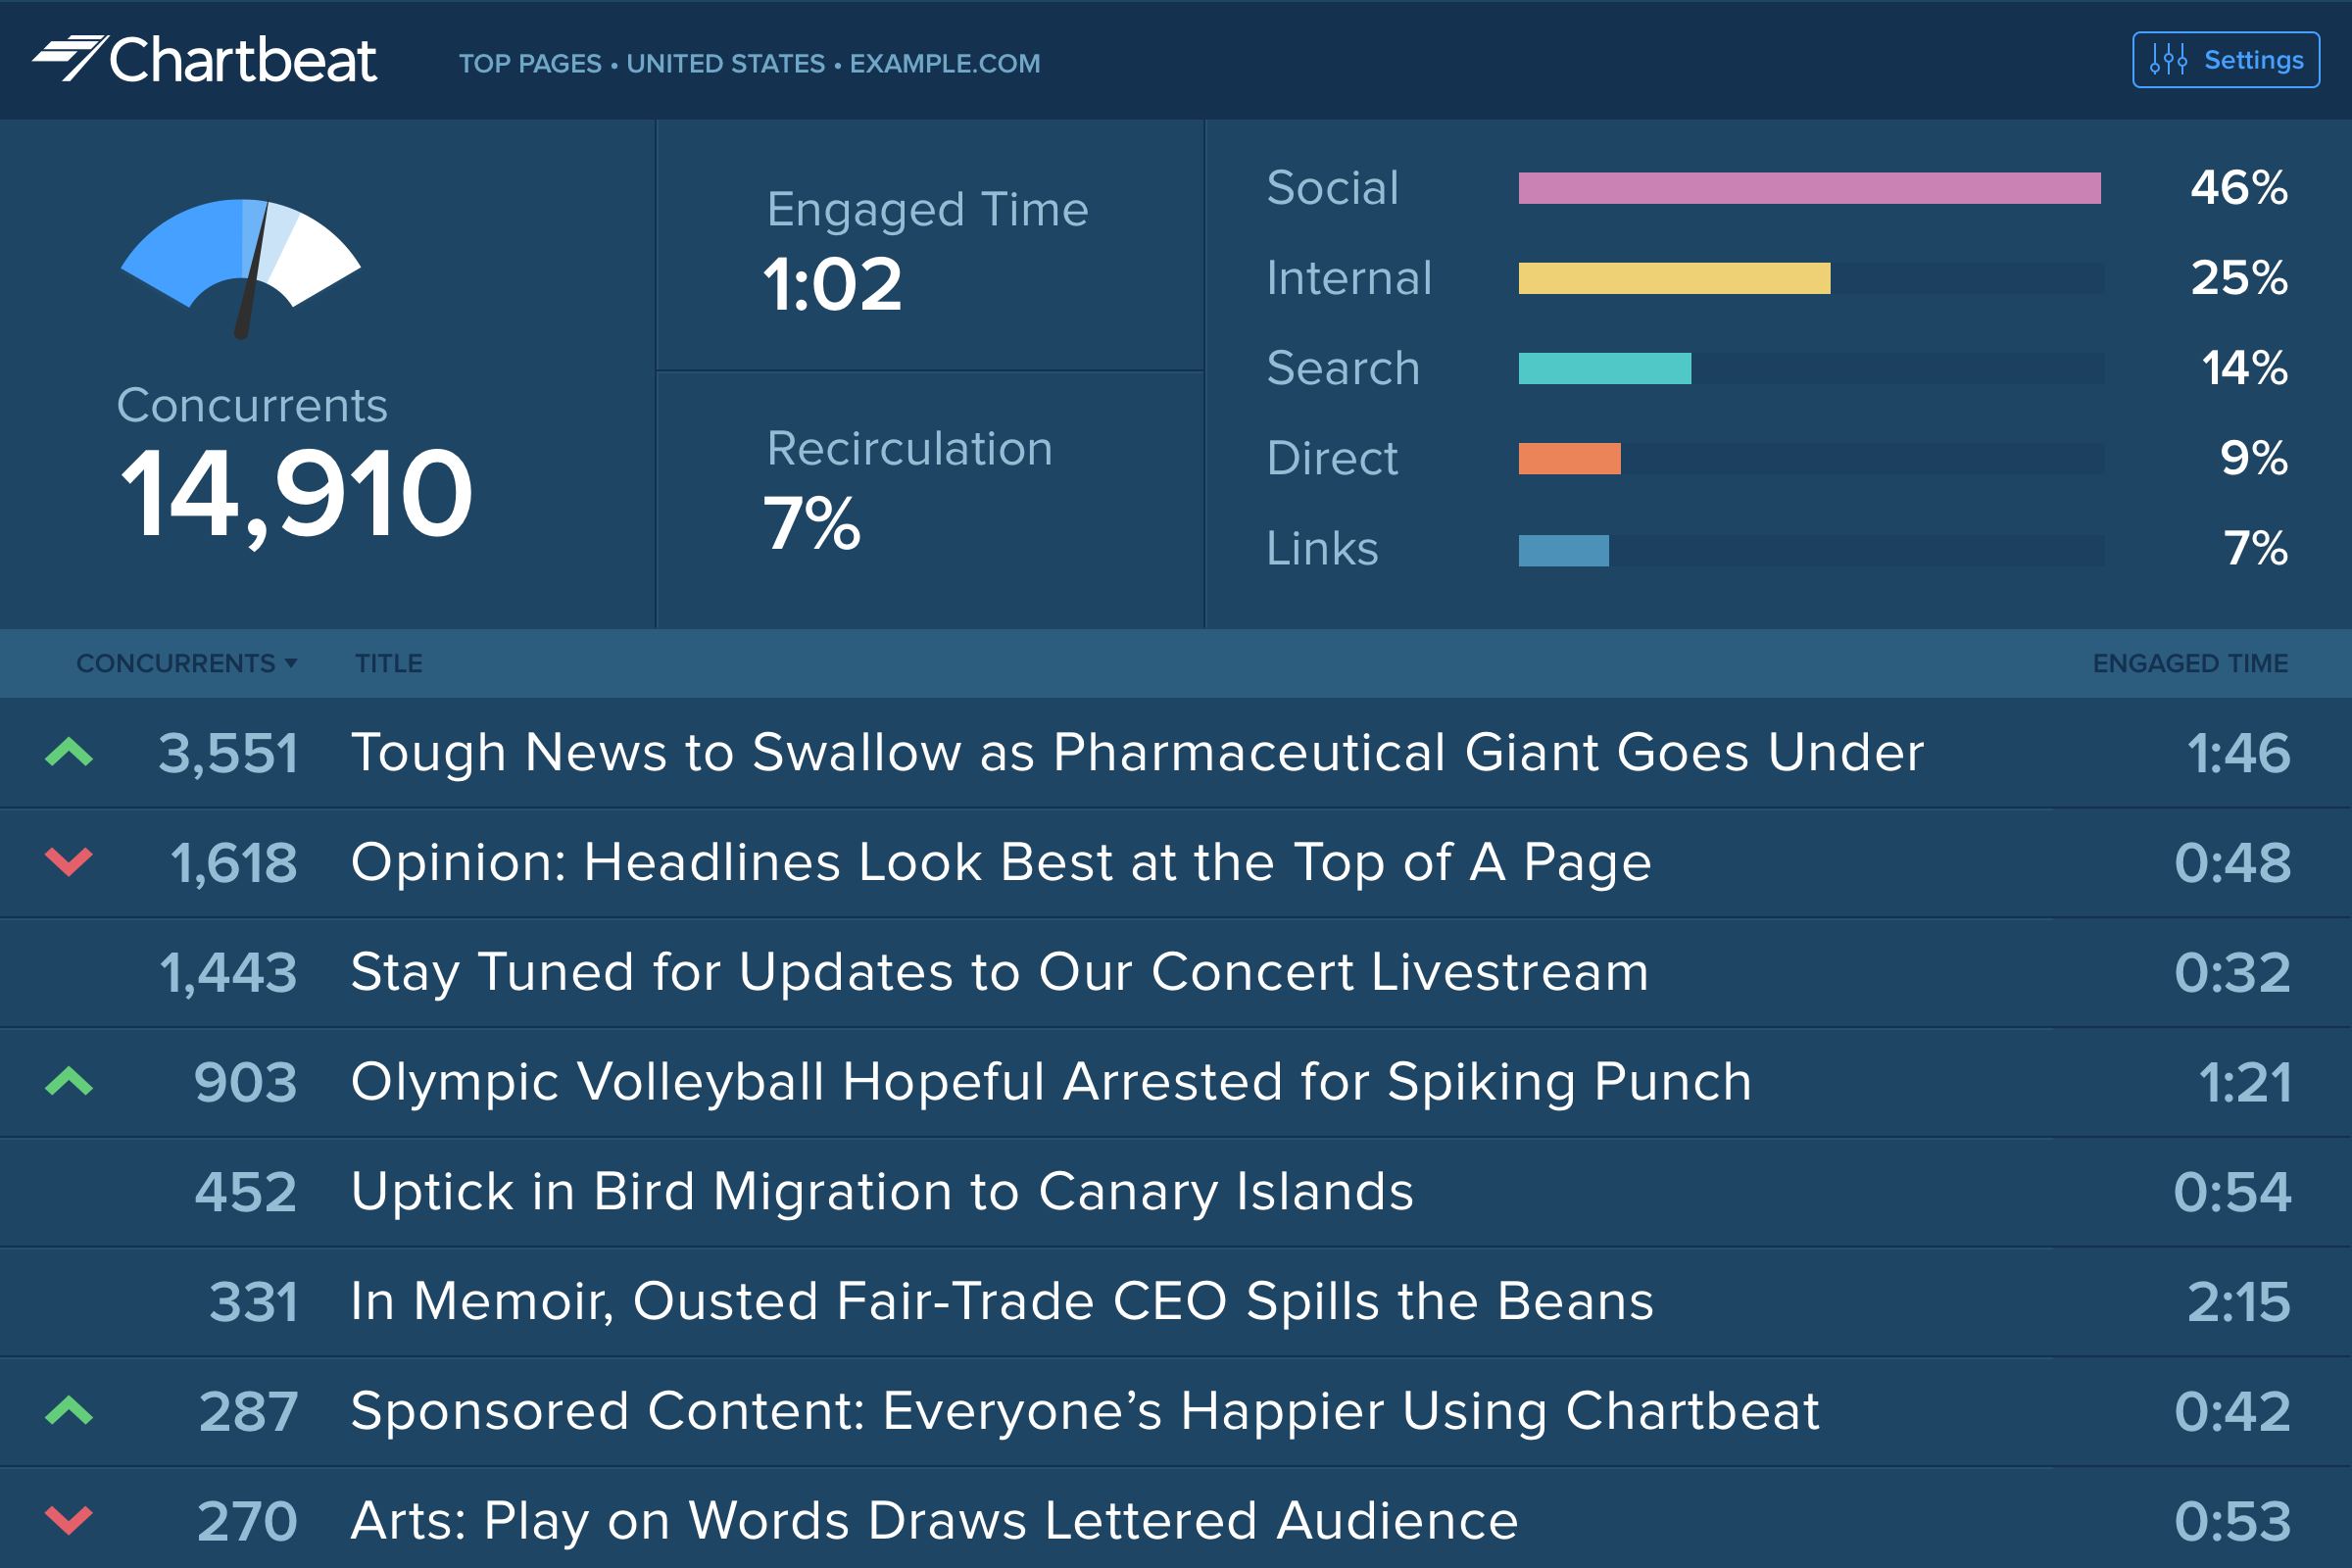
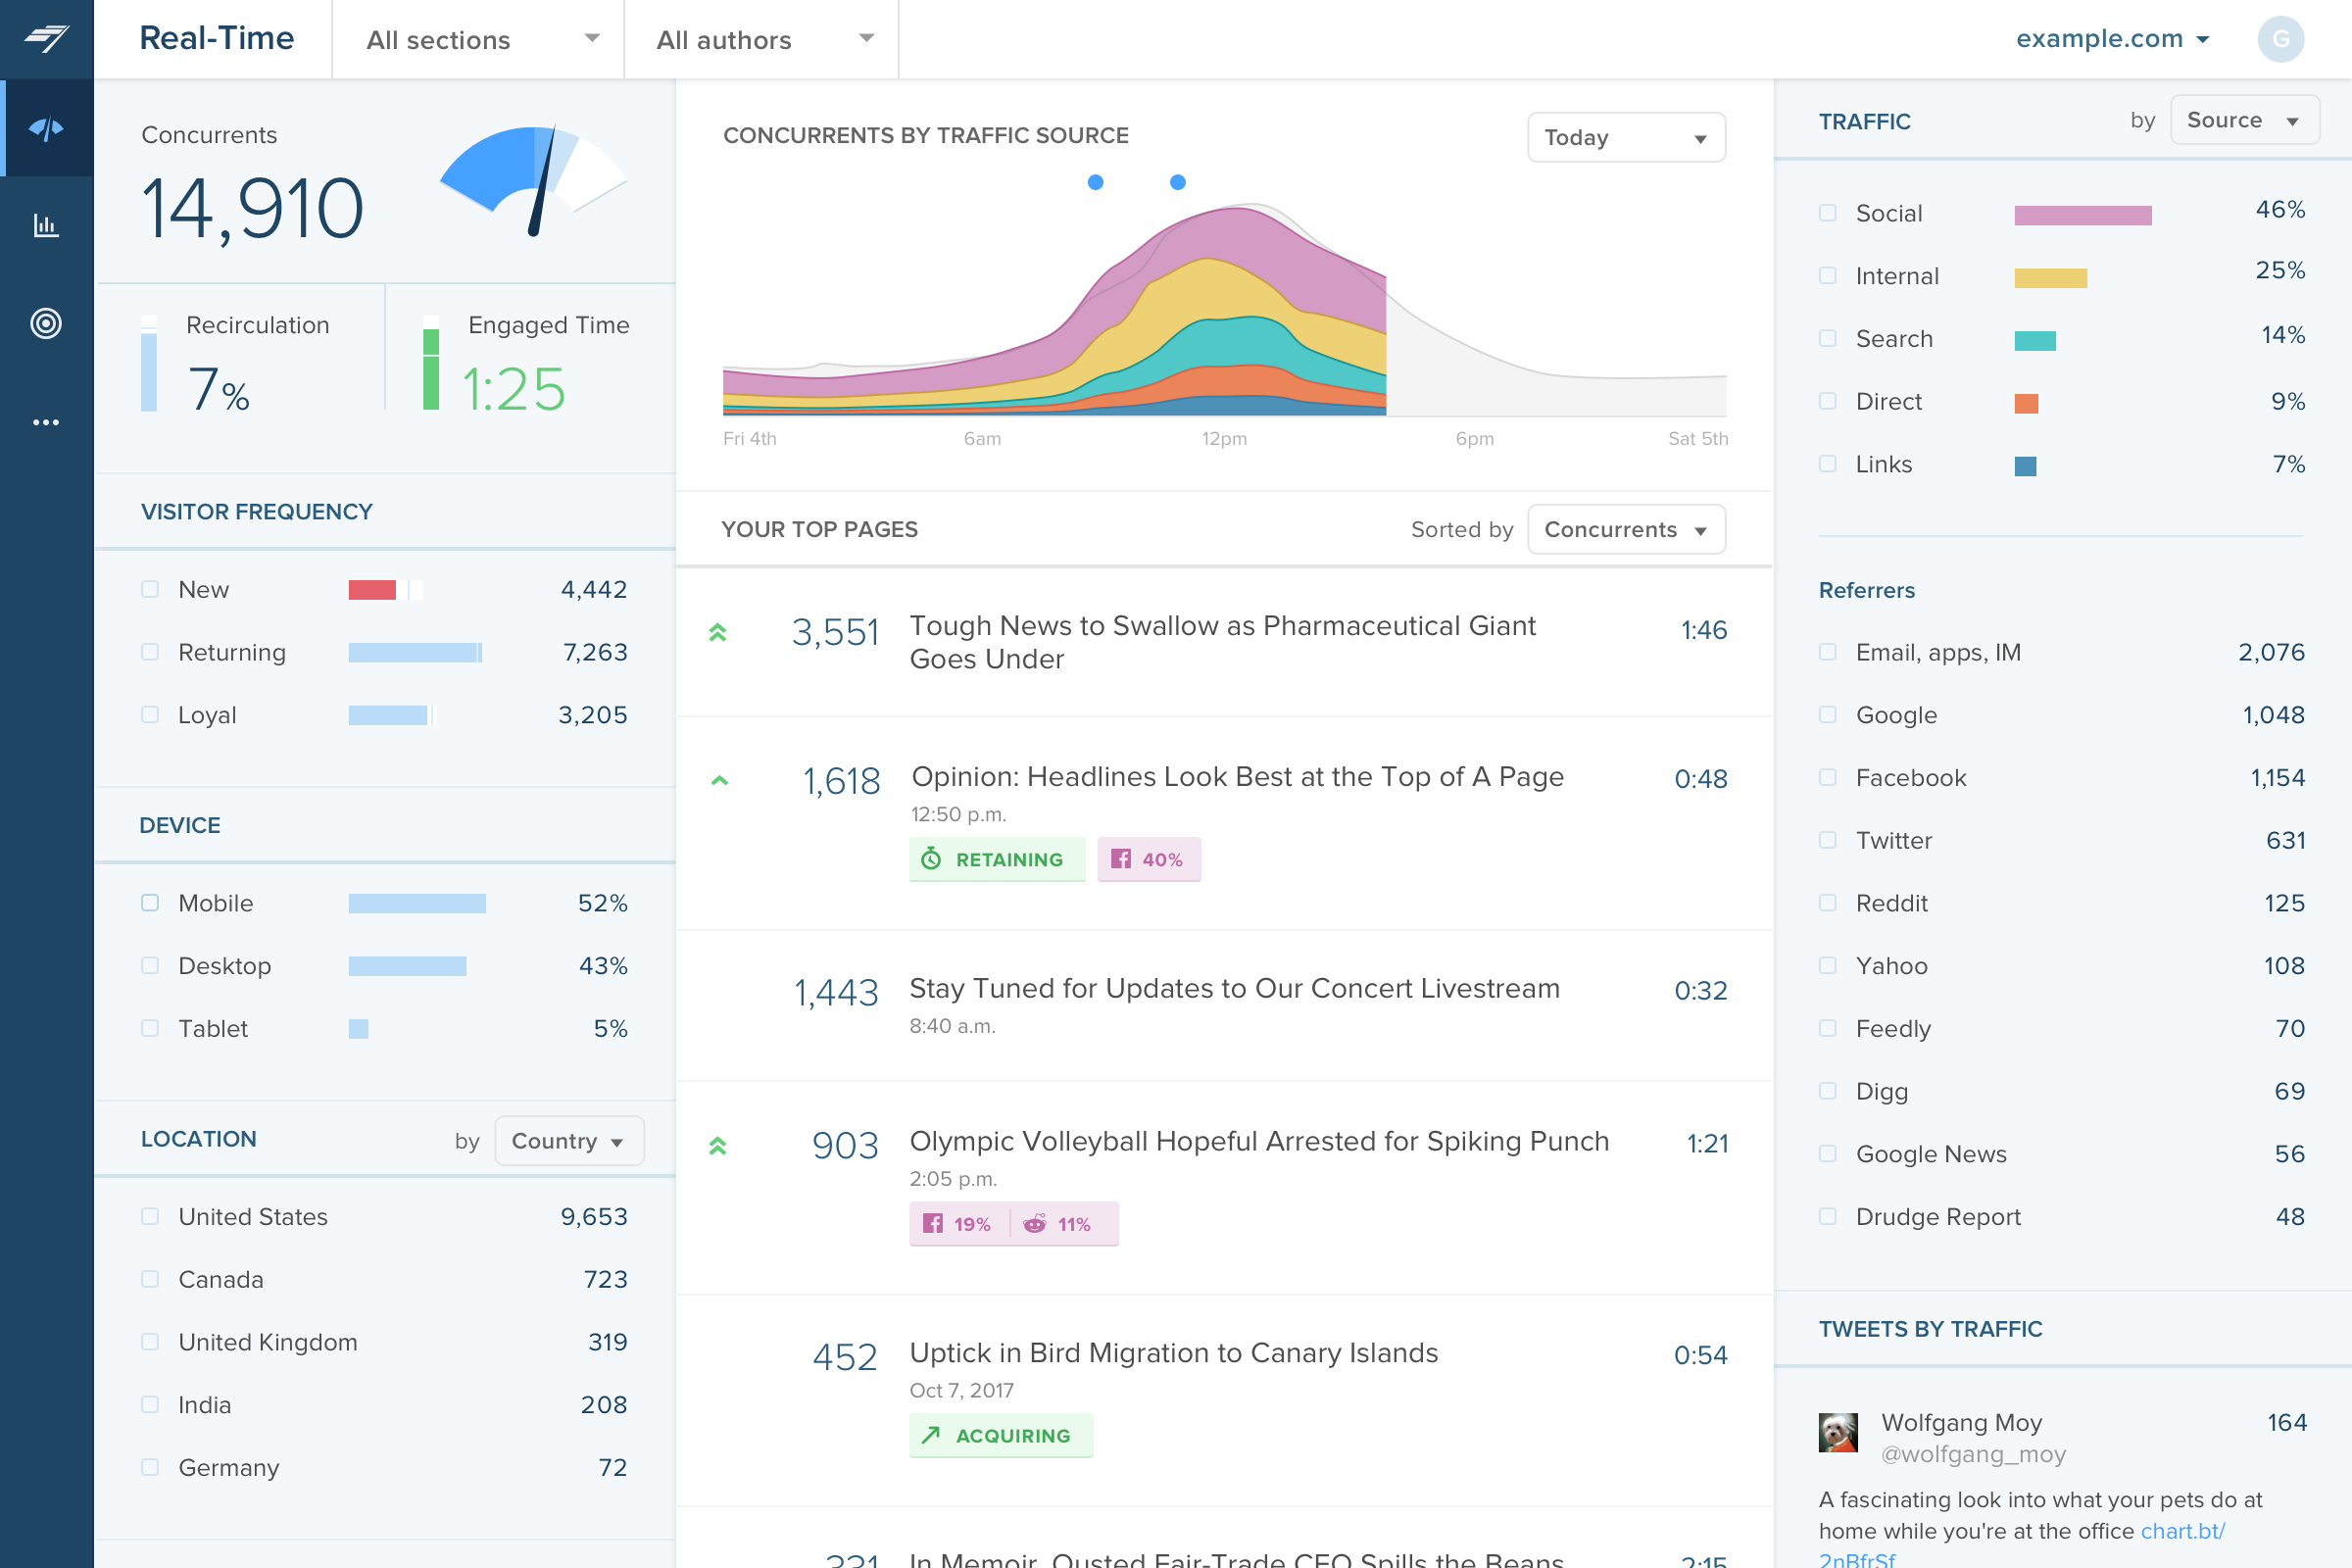
The main point of benefit is the realtime data. This is vital to our team as we are publishing a lot of content per day, so we have a busy homepage to manage and it's important to know which content is performing well. We also like to get an understanding as quickly as possible - which Chartbeat offers - of where traffic is coming from. Often we will see an example where a page is getting high traffic from Google, for example, and we know that might not need to be placed so prominently on the homepage because the traffic is arriving to us externally anyway. Without that depth of understanding what is performing best and why - updated immediately, unlike in Google Analytics now - our homepage would not be as well optimised for users coming to us direct
Read full review
Traject
Cyfe might be for you if you are looking for a cost-effective way to display all of your marketing metrics in one place. If you are looking for a detailed, fine-tuned, niche, or extremely specific metrics, this might not be the best solution. Cyfe is good for a general health check-up of marketing, but not a finely tuned examination.
Read full review
Pros
Chartbeat
  • Provides easy at-a-glance look at what people are reading right now
  • Heads-up Display allows you to make sure the homepage is showing the content people want to read
  • Headline testing tool provides fascinating insight into what makes people read a story and improves headline-writing ability
Read full review
Traject
  • Has preset metric groups that pull similar stats together in one "bucket" saving you the time of setting up each stat-line one by one
  • Allows you to easily adjust the timeframe for what stats you want to see, so you can find YOY stats or just last month's stats rather quickly
  • Colored visualizations of stats make it easy to notice when campaigns are taking off
Read full review
Cons
Chartbeat
  • Source of traffic needs improvement. Search and social make sense, but "internal" and "links" is a grey area. It would be helpful to define those with an organization and provide an information icon so users can easily remember what each of those buckets is tracking.
  • More ways to customize the real-time board. For example, with video content, that's great that I can see a user has started a video, but what is the completion rate, was that only on O&O or can that track Facebook, too?
  • Would like to see demo (age) information included as a way to slice the data so I can see what's working with my older and younger demo.
Read full review
Traject
  • I'd love to see additional functionality to customize colors. The light/dark option is very nice, but a little more flexibility in the colors would go a long way, especially if it was possible at the dashboard level rather than just the account level. Along the same lines, being able to customize the charts a little more, for example being able to show an x-axis on single data type graphs, could make them easier to read in some cases.
  • Being able to choose to report on converted clicks or conversions in AdWords would be helpful.
  • Needs the ability to show the date range on the shared URL dashboards. Would be even better if the date range was adjustable on that view, too.
Read full review
Likelihood to Renew
Chartbeat
I gave Chartbeat a 5 for a renewal rating, because, while it delivers clear and understandable content, Google Analytics also provides many of the same features for free. For a small to medium website, I believe it would be more cost effective to use Google Analytics. A website with a high amount of traffic, however, could merit spending the money on Chartbeat to maximize their potential.
Read full review
Traject
It has become a part of our internal tools so unless a competitor comes out with similar functionality as a similar price point it is unlikely that we would not renew. One area that would cause us not to renew would be if a competing service came out with more third-party integrations that match our needs. Price at this point is no longer an issue as it would allow us to automate a somewhat manual process that we have now connecting Cyfe widgets to Google Sheets.
Read full review
Usability
Chartbeat
I am able to "set it and forget it," keeping it up on my monitor for either constant checking or just keeping an eye on the numbers during the day. I'm also able to keep track of what times are perfect to post a story and which stories rack up the most traffic.
Read full review
Traject
I gave it a rating of 7 because it does a good job at what it does, but there are missing that are missing which I would have benefited from. For instance, if I was able to drill down more on the specific metrics I was able to see, that would have been helpful.
Read full review
Support Rating
Chartbeat
I have had limited experience of support for Chartbeat but whenever I have needed help it has been there. Recently there was an issue of seeing different forms of data in real time - app and otherwise effectively, and the issue was being clearly dealt with and communicated back to us.
Read full review
Traject
Because I had a very minor question and I was able to speak directly to the founder through LinkedIn and through email. I know that as they grow this may not always be an option but the fact that he made himself available to answer my questions said a lot about his passion for the product.
Read full review
Implementation Rating
Chartbeat
No answers on this topic
Traject
Cyfe is a 15 minutes implementation, then some time to get your data sources created. This is an easy one person job that will not result in down time or unnecessary wasted man hours.
Read full review
Alternatives Considered
Chartbeat
Omnilytics is more robust, detailed, and catered for an intermediate media user, while I think Chartbeat is a more user-friendly and beginner-oriented piece of technology. That being said, there is an impressive amount of lift for Chartbeat, and it's evident that simplicity is the key to using a software daily (which is absolutely the point in the content world).
Read full review
Traject
The Salesforce dashboard is comparably flexible and intuitive, but designed more to its internal CRM focus. SumAll shares the social media dashboard capabilities, but lacks all others. Its interesting feature is side-by-side graph analysis for cross-channel performance. Cyfe might borrow from SumAll's default weekly email summary of performance from the dashboard, but implementation could be too complex. Nuvi dashboard is exclusively for social media marketing, but lacks Cyfe's flexibility for third party integration and window customization settings.
Read full review
Return on Investment
Chartbeat
  • It has helped us save time in report generation and performance analysis.
  • By helping us evaluate our contributors, we're able to get our money's worth.
  • Seeing our numbers on the Big Board fosters healthy competition among brands, motivating us to distribute our stories better.
Read full review
Traject
  • Cyfe allows us to provide real time data to our clients
  • Cyfe allows us to provide detailed analytics to our clients showing actual results
  • Cyfe reduced our need to provide monthly "reports" to our marketing clients
  • Cyfe allows us to have better situational awareness and know what is going on throughout our multiple organizations
Read full review
ScreenShots

Chartbeat Screenshots

Screenshot of Big Board: For newsrooms, the leaderboard-style visualization shows the top stories on the biggest screen.Screenshot of Real-time dashboard: Displays how an audience is connecting with content in the moment – across platforms, channels, and devices.Screenshot of Historical Dashboard: To assess content performance, KPIs, and valuable trends over the long term.Screenshot of Heads Up Display: Shows which homepage articles are the top performers, how stories are trending up or down in traffic, and how far visitors are scrolling down the page.Screenshot of Video Dashboard: Reveals how video content captures viewer attention.Screenshot of Conversion Dashboard: Tracks conversion metrics and insights.