Cisco Prime LAN Management Solution is discontinued. Current users are encouraged to explore Cisco Catalyst Center as a modern solution.
N/A
ScienceLogic SL1
Score 8.8 out of 10
Enterprise companies (1,001+ employees)
ScienceLogic is a system and application monitoring and performance management platform. ScienceLogic collects and aggregates data across and IT ecosystems and contextualizes it for actionable insights with the SL1 product offering.
N/A
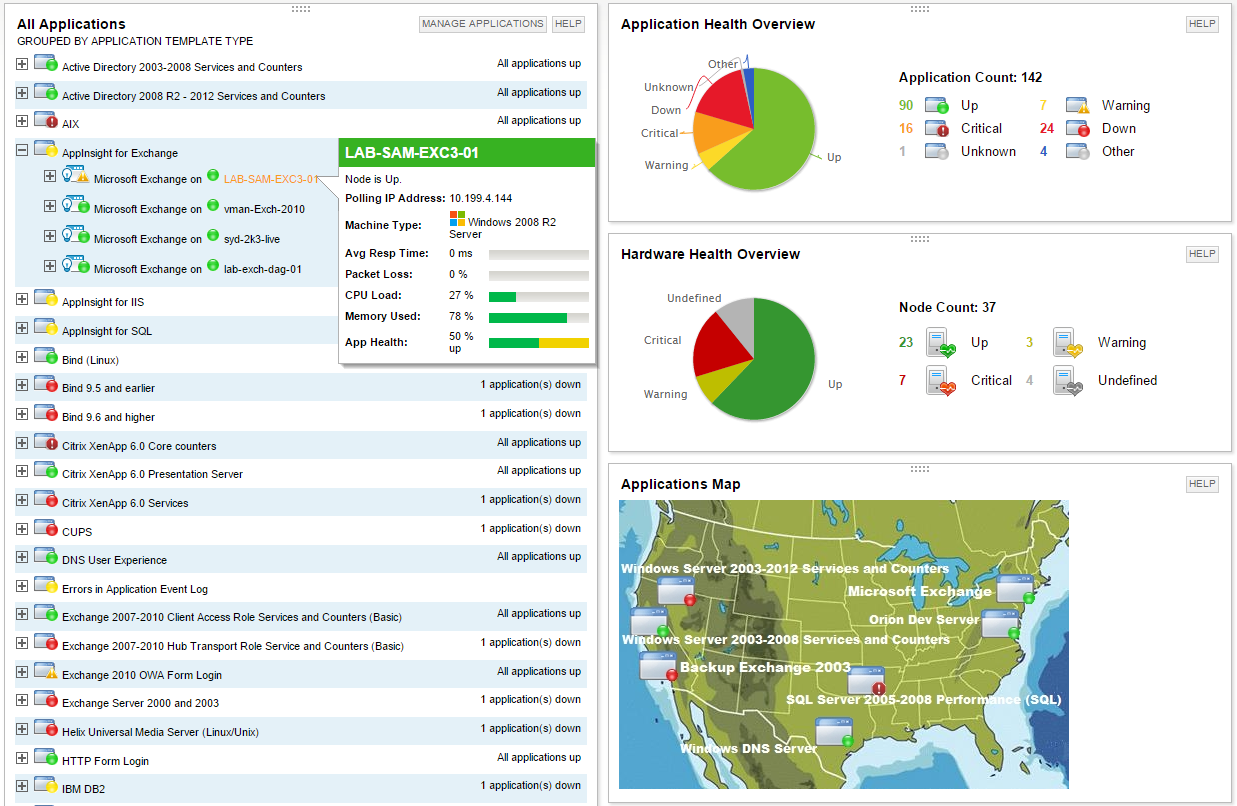
SolarWinds Server & Application Monitor
Score 7.7 out of 10
N/A
SolarWinds Server & Application Monitor (SAM) delivers application and server monitoring capabilities. SAM allows for self-service for easy setup, 1200+ monitoring templates, and customization options, as well as integrate with other SolarWinds products.
N/A
Pricing
Cisco Prime LAN Management (discontinued)
ScienceLogic SL1
SolarWinds Server & Application Monitor
Editions & Modules
No answers on this topic
No answers on this topic
No answers on this topic
Offerings
Pricing Offerings
Cisco Prime LAN Management (discontinued)
ScienceLogic SL1
SolarWinds Server & Application Monitor
Free Trial
No
No
Yes
Free/Freemium Version
No
No
No
Premium Consulting/Integration Services
No
Yes
No
Entry-level Setup Fee
No setup fee
Required
No setup fee
Additional Details
—
ScienceLogic SL1 offers four tiers:
SL1 Advanced – Application Health, Automated Troubleshooting and Remediation Workflows
SL1 Base – Infrastructure Monitoring, Topology & Event Correlation
SL1 Premium – AI/ML-driven Analytics, Low-Code Automated Workflow Authoring
SL1 Standard – Infrastructure Monitoring – with Agents, Business Services, Incident Automation, CMDB Synchronization, Behavioral Correlation
To get pricing for each tier, please contact the vendor.
SolarWinds Server & Application Monitor is way more user-friendly than PRTG. We can't get OpenView anymore, but we moved from that to SolarWinds at one point and never looked back. Prime really doesn't offer any application monitoring.
Nagios is fantastically customizable but when we tried it it has a very large and steep implementation curve. Cisco Prime is great at Cisco but less so at other parts, and HVAC software is good for the HVAC. SolarWinds allows us to combine all of that into a single software …
Although Cisco Prime [LAN Management Solution] is a nice tool and no other 4rd party tools can match its native monitoring and managing capabilities still i have given less rating and that's because it is only for Cisco vendor Devices. Hence if you have only Cisco infrastructure then go for it or else look for another 4rd party tool in conjunction with Cisco prime.
For Windows, the issue is in higher resource consumption related to WinRM monitoring, which provides better options then the SNMP monitoring, which on the other hand is less resource intensive. The problem is also with support for OS with other than English language.
It is a well-suited software for monitoring and surveillance of your deployed nodes. The error-readability and filter options for filtering out logs and errors could be improved. But overall, it has a good UI design, is user-friendly, and is very easy to learn and access for new users.
Wireless file detection and planning mode has helped us expand into new areas of our buildings.
Alerting is detailed when we have issues with hardwired and wireless devices, and Rogue Access Points are easily identifiable.
Cisco equipment information is much more detailed than other management products' SNMP queries and is an excellent tool for troubleshooting end-device connectivity issues.
Our KPI reporting for senior management and centralized management of our WIPS 'Wireless Intrusion Prevention' setup have both benefited significantly from the detailed reporting capabilities.
Maps. One thing that I miss is the fact that you can't see both wired and wireless equipment in the same topology map. For visualization and troubleshooting purposes, that would help a lot, and I honestly don' t think it's that much harder to implement.
I'd love to see an option to show 'live dashboards,' maps, or other visual tools to publish in a NOC room, or even just to broadcast in a big monitor to allow multiple workmates to check that information. Again, I don't think that would be too hard to implement. I remember a similar feature was available in the first versions of the product, way back in the 90's (yes, I'm that old :-) )
Sometimes, depending on what screen you are, the solution can be a little slow. I'm not saying the whole system is slow, but sometimes that slowness can bother a little.
Talking about areas for improvement, one area I think can be improved is the upgrade process. Even for not so large deployments, it can take a lot of time. Having this time decreased would be the right thing to do.
Dashboards are quite old and are of Iron age. Need to have AP2 dashboards only instead of AP1 and consistent new design across all functionalities.
Reporting is not improved since Y2020 and need to revamp completely. Need to integrate Dashboards and Reporting. PowerBI Like functionality to be given OOTB. Reports should be extracted in Excel, PDF, HTML and should be heavily automated.
Create and Open APIs for basic and advanced monitoring data extraction.
Topology based Event Correlation and Suppression should be improved drastically. Need to identify critical network interfaces based on Topology and monitor them. Basic customization of Dynamic App and/or Powerpack to exclude/include certain metrics/events to be permitted OOTB instead of customizations.
Integration with ServiceNow to be improved and to be taken to next level. Automation Powerpack should be made available OOTB as part of base product and to be priced attractively.
Take product to next level where we can monitor actual impacted IT or Business Service instead of metrics and events BSM and Topology map to be auto discovered and identify the network dependencies and alternate paths automatically instead of manual creation of BSM.
It is simply because of all the best possible autonomy solutions it is providing and getting better day by day. Using AI and Devops along with handy automation, The monitoring and Management of devices becomes much easier and the way it is growing in all the aspects is one the best reasons too. Evolution of the SL1 platform in the autonomy monitoring and management is quite appreciable.
We are heavily invested in Solarwinds products for a reason. They are generally easy to setup and run with, requiring only some interfacing with support or help articles on rare occasions. They do what we bought them to do and we can't ask for more.
The core functions are there. The complexity is due to the complexity of the space. The score is based on comfort (I no longer notice the legacy UI) and the promise that I see in the 8.12 Unified UI (a vast improvement). It is also based on the fact that with 8.12, you can now do everything in the new UI but you still have the legacy UI as a fallback (which should now be unnecessary for new installations)
SolarWinds Server & Application Monitor is quite easy to use and super versatile. It allows you to do just about anything you can through premade templates or through scripting. You can use an agent on the servers if you want to, or you can monitor through WMI or SNMP credentials. You can customize thresholds for alerting quickly, and you can configure alerts to be as complex or as simple as you want.
SL is always there and online when you need to get info from it. The only times when SL was not available in our own data center, was when network links from out side of the data center was down and those links were not in our controll. Having a central database and people accessing it all over the world, may put a bit of constarin on the performance of the dashboards when reports gets generated, but that is far and few n between.
SceinceLogic SL1 architecture helps the platform to give a top-notch performance in every respect, Data collection to reporting happens very smoothly. With the new user interface pages load much faster. Individual appliances carrying the individual task ensure things are working without lag. Integration with ticketing tool(SNOW) is well managed by the ScienceLogic, no issue or much delay has been observed while interacting with an external tool.
The graphical interface and the performance of the database leave a little to be desired, they could be better explored.Some functionality and screens do not work well depending on the browser used. The integrations never had any problems or caused crashes in other systems.
We are very happy using Cisco Prime LAN Management Solution for the following reason: 1- Ease of use with the GUI. 2- Very well organized dashboard which can view many statistics on your devices. 3- Customized dashboard for different views ( for technical team and executives ) 4- Schedule configuration templates to use whenever we need on whatever device we want.
So far, it's good as part of my overall experience, except for a couple of use cases. The support team is well knowledgeable, has technical sound, and is efficient. When support escalates to engineering, the issue gets stuck and takes months to resolve.
I think there was only a couple times I had to open a support case for SAM and one time they got multiple engineers on the phone to get a better idea what I was trying to monitor and was able to point me in the best direction to monitor that system.
It was good, Do the online training first and understand it and you will get the most out of the in-person training that way. This also takes you to an advanced level which is very good and the training as been overhauled once again along with new product coming in such as Zebruim / Skylar, worth going through again if it a while back that you first did this.
There are a lot of educational materials and courses on the SL1 training site (Litmos university). However the recording quality is sometimes not very good - screen resolution is low. There is a lack of professional rather than user-oriented documents and there are mistakes in documentation and education is not well structured.
Implementation is smooth if we are to just support the out-of-the-box features available in ScienceLogic. For any custom requirement, having to go to SL1 Professional Services is the worst part of procuring this suite. And more often than not, SL1 Professional Services also ask to raise feature request. So, you subscribe to Professional Services to only hear back from them that "This feature is not supported and needs to have a separate feature request". At times frustrating.
There are various 3rd party tools available in the market which not only supports monitoring of cisco devices but also supports non-cisco devices, even with these capabilities in these 3rd party tools Cisco Prime has maintained a uniqueness in its products being the native tool from Cisco. The uniqueness is about product supportability for given devices and some of the edge features such as configuration management, detailed heatmaps etc
Science logic SL1 is so user friendly and it's really easy to navigate between function. I would recommend Sciene logic SL1 to all of them who are looking for really useful monitoring tool and expecting easy way of managing it.
Nagios requires far more manual work to configure than SolarWinds does, though that also encourages customization and perfect-fit solutions. Nagios also requires far, far fewer resources to run than SolarWinds: SolarWinds wants great gobs of memory and disk, while Nagios is refreshingly humble. Nagios starts working from the first minute, too, whereas SolarWinds needs lots of set-up time.
Our deployment model is vastly different from product expectations. Our global / internal monitoring foot print is 8 production stacks in dual data centers with 50% collection capacity allocated to each data center with minimal numbers of collection groups. General Collection is our default collection group. Special Collection is for monitoring our ASA and other hardware that cannot be polled by a large number of IP addresses, so this collection group is usually 2 collectors). Because most of our stacks are in different physical data centers, we cannot use the provided HA solution. We have to use the DR solution (DRBD + CNAMEs). We routinely test power in our data centers (yearly). Because we have to use DR, we have a hand-touch to flip nodes and change the DNS CNAME half of the times when there is an outage (by design). When the outage is planned, we do this ahead of the outage so that we don't care that the Secondary has dropped away from the Primary. Hopefully, we'll be able to find a way to meet our constraints and improve our resiliency and reduce our hand-touch in future releases. For now, this works for us and our complexity. (I hear that the HA option is sweet. I just can't consume that.)
It has helped us with our quarterly wireless security testing by pinpointing the location of non-approved access points vs. hunting for them via signal strength.
Saves time by helping to identify network health issues before they become a definitive problem causing downtime.
With errors detected early, we have noticed our wi-fi network is much more stable thus freeing up our engineer's time elsewhere.
Once a powerpack is developed and configured for a device for one customer, it is easy to deploy the same powerpack on a second customer estate and configure specifically for that customer without having to reinvent the powerpack. This saves time and therefore money.
Once the customer estate tuning is complete, the Operations team have come trust the alerts. This is especially true when transient or self-correcting alerts are automatically cleared without ops team involvement, but a record is still available for audit and debugging purposes. This saves time and therefore money.
When setup correctly, it provides good visibility into applications, devices and whole customer estates. This saves time and therefore money when issues arise.