Overview
Recent Reviews
Reviewer Sentiment
Awards


Reviewer Pros & Cons
View all pros & consVideo Reviews
Leaving a video review helps other professionals like you evaluate products. Be the first one in your network to record a review of ScienceLogic SL1, and make your voice heard!
Pricing
View all pricingEntry-level set up fee?
- Setup fee required
Offerings
- Free Trial
- Free/Freemium Version
- Premium Consulting / Integration Services
Starting price (does not include set up fee)
- $7.50 per month per node
Features Scorecard
Product Details
What is ScienceLogic SL1?
The ScienceLogic SL1 platform aims to enable companies to digitally transform themselves by removing the difficulty of managing complex, distributed IT services. SL1 uses patented discovery techniques to find everything in a network, so users get visibility across all technologies and vendors running anywhere in data centers or clouds. The vendor states the advantage of SL1 is that it collects and analyzes millions of data points across an IT universe (made up of infrastructure, network, applications, and business services), to help users make sense of it all, share data, and automate IT processes.
With SL1, the user can:
- See everything across cloud and distributed architectures. Discover all IT components—–across physical, virtual, and cloud. Collect, merge, and store a variety of data in a clean, normalized data lake.
- Contextualize data through relationship mapping and machine learning (ML) for actionable insights. Use this context to understand the impact of infrastructure and applications on business service health and risk, accelerate root cause analysis, and execute recommended actions.
- Act on data that is shared across technologies and IT ecosystem in real time. Apply multi-directional integrations to automate workflows at cloud scale.
ScienceLogic SL1 Features
- Supported: Infrastructure Monitoring (Cloud, Container, Server, Storage, Agent-Based, Network, Application, Database, UC/Video, Synthetic)
- Supported: Closed-Loop Automations (Digital Experience Monitoring, CMDB & Inventory, Incident & Notifications, NetFlow, Configuration and Change Management, Troubleshooting & Remediation
- Supported: Topology-Driven Event Correlation
- Supported: Full-Stack Topology Mapping
- Supported: Business Service Monitoring
- Supported: Behavioral Correlation (Events, Changes, Anomalies, Topology)
- Supported: Analytics - ML-Based Anomaly Detection
- Supported: Incident Automation - Event Forwarding & Email
- Supported: Dynamic Baselining Analytics
- Supported: Manage Workflow Health & Endpoints
- Supported: Dashboards and Reporting
- Supported: Log Collection
- Supported: 400+ Pre-Built Monitoring Integrations
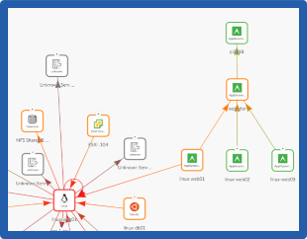
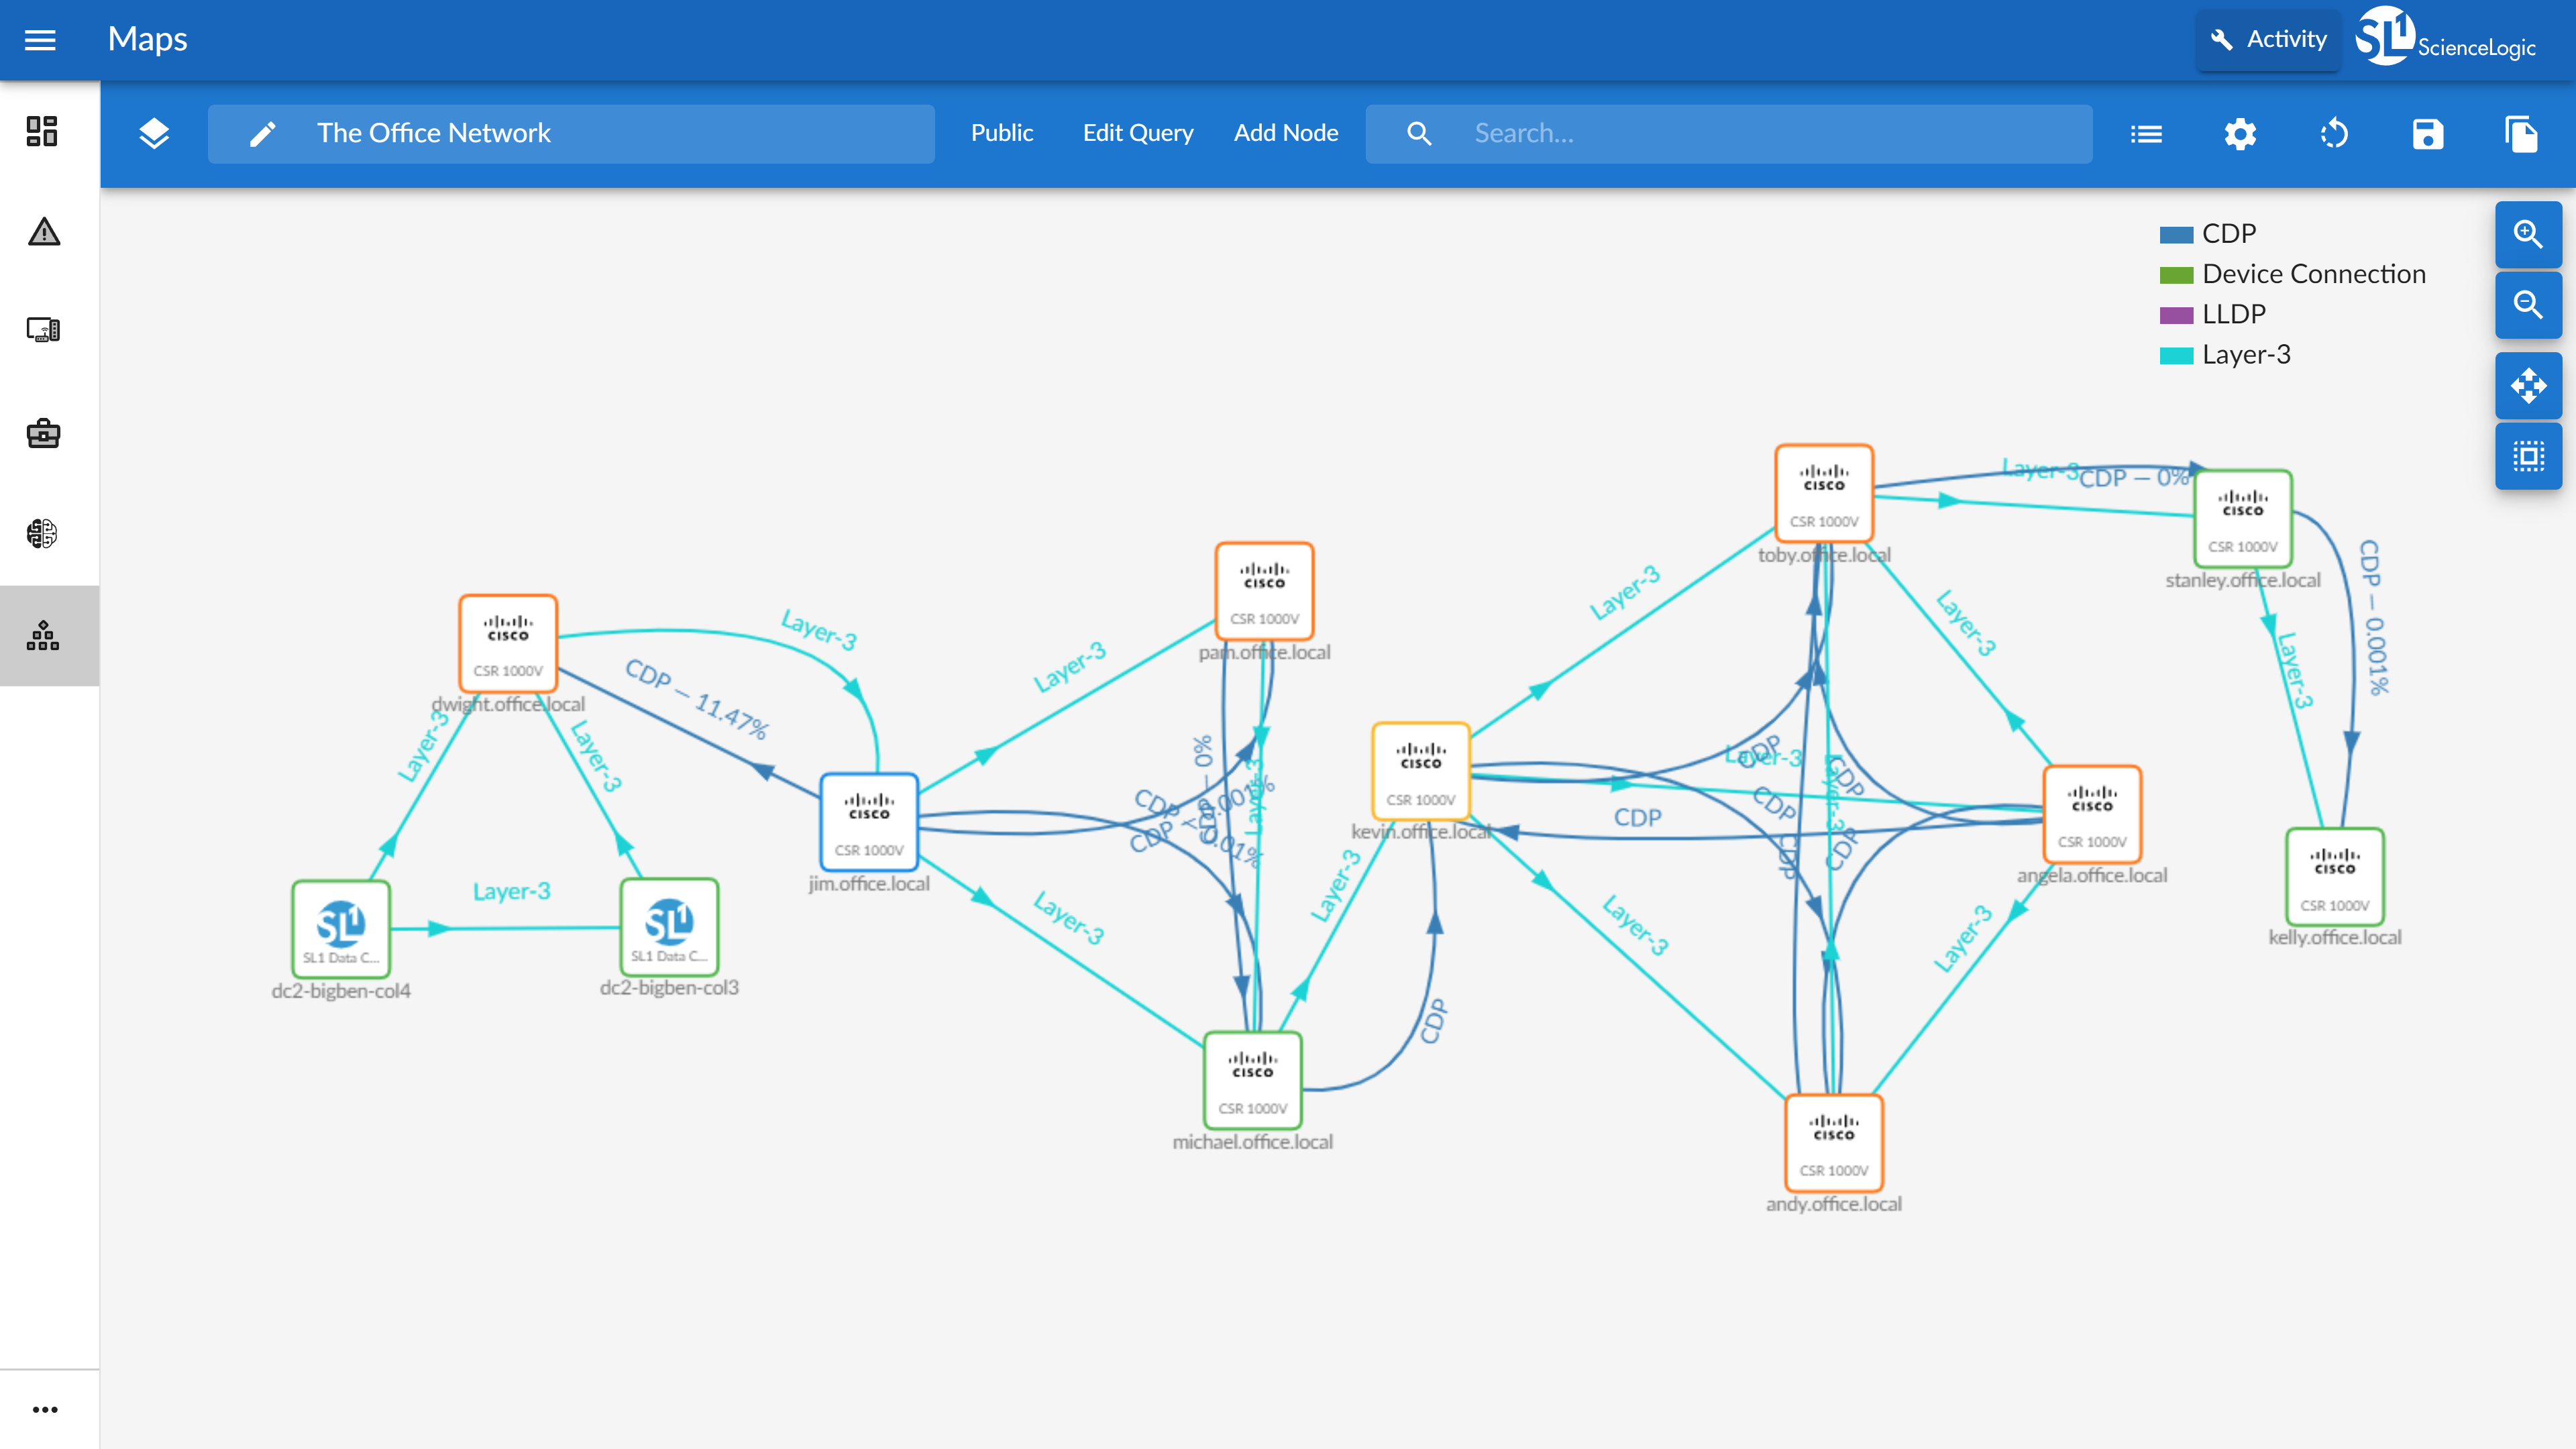
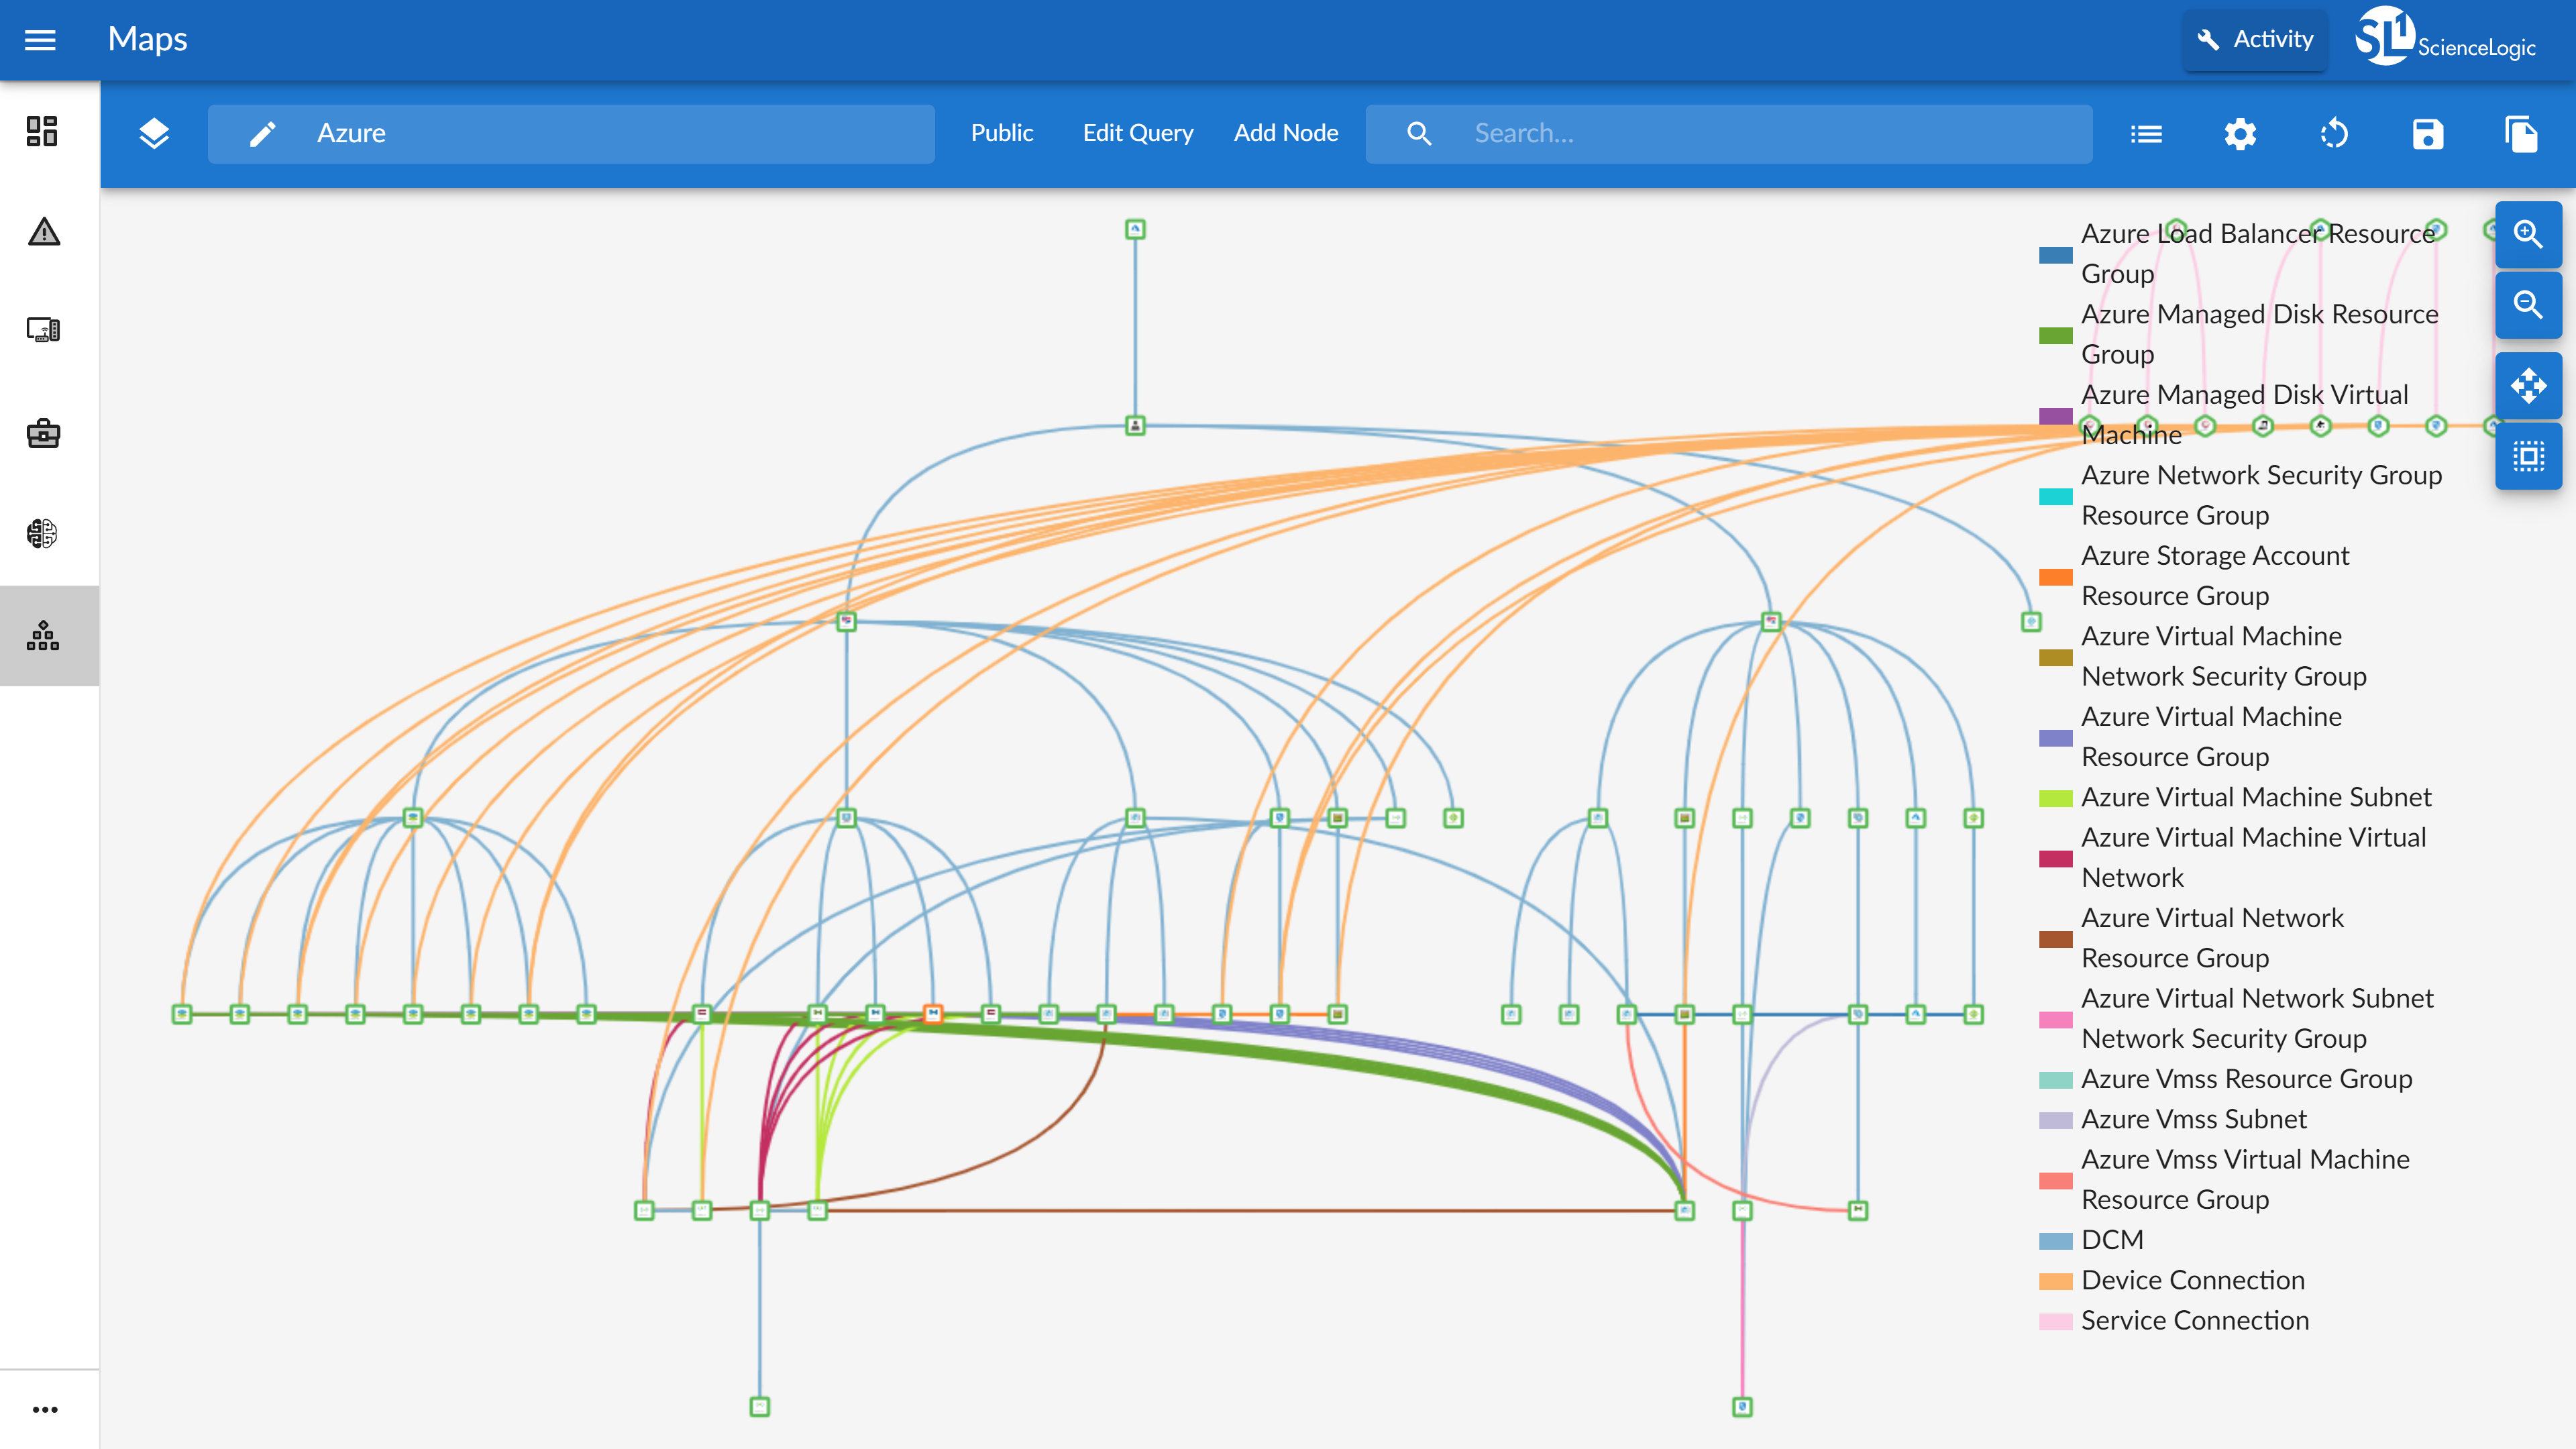
ScienceLogic SL1 Screenshots
ScienceLogic SL1 Videos
Watch Eliminate Visibility Gaps While Driving Tool Consolidation
Watch Diagnose and Resolve Service Impacting Issues with Behavioral Correlation
Watch Automate Troubleshooting for Faster Root Cause Analysis
Watch Achieve CMDB Accuracy With Real-time Synchronization of Monitored Environment
Watch Understand Infrastructure Impact on Apps with AppDynamics
ScienceLogic SL1 Downloadables
ScienceLogic SL1 Integrations
- Kubernetes
- Cisco HyperFlex
- Nimble
- Hyper-V
- MySQL
- Dynatrace
- New Relic
- Cloud -AWS
- Azure
- Google Cloud
- IBM Cloud
- Aliyun
- CloudStack
- OpenStack
- etc.
- Cloud Services – Amazon EKS
- ECS
- Fargate; Azure AKS; etc.
- Containers – Docker
- etc.
- Software-defined Networks/WAN – Cisco
- VMware
- etc.
- Network - Cisco
- F5
- Juniper
- Meraki
- Riverbed
- Aruba
- Avaya
- Fortinet
- HP
- etc.
- Storage - Dell EMC
- NetApp
- HPE
- Hitachi
- Nutanix
- Pure Storage
- etc.
- Hypervisors – VMware
- Xen
- KVM
- etc.
- Operating Systems - Unix
- Windows
- Linux
- Business Applications
- Databases - Microsoft
- SAP
- Office 365
- MS SQL Server
- Oracle
- IBM DB2
- etc.
- APM - AppDynamics
- etc.
- etc.
- Storage - Dell EMC
- NetApp
- Pure
- HP/Nimble
- etc.
- Cloud -AWS
- Azure
- IBM
- Aliyun
- Openstack
- etc.
- Applications -Microsoft
- SAP
- etc.
- Compute -VMWare
- Microsoft Hyper-V
- KVM
- Linux
- Unix
- Converged -Nutanix
- Unified Communications and video - Cisco
- Polycom
- Tandberg
ScienceLogic SL1 Competitors
ScienceLogic SL1 Customer Size Distribution
Consumers | 0% |
---|---|
Small Businesses (1-50 employees) | 0% |
Mid-Size Companies (51-500 employees) | 0% |
Enterprises (more than 500 employees) | 100% |
ScienceLogic SL1 Technical Details
Deployment Types | On-premise, SaaS |
---|---|
Operating Systems | Windows, Linux, Mac, UNIX |
Mobile Application | No |
Supported Countries | Americas, EMEA, APAC |
Supported Languages | English |
Comparisons
View all alternativesCompare with
Frequently Asked Questions
What is ScienceLogic SL1?
How much does ScienceLogic SL1 cost?
What are ScienceLogic SL1's top competitors?
What is ScienceLogic SL1's best feature?
Who uses ScienceLogic SL1?
Reviews and Ratings
Reviews
(1-25 of 151)- Popular Filters
SL1 - Early Adopter
- ITSM workflow automation and monitoring
- Seamless Integration with other observability platform tools
- Provides context between infrastructure, application, and business services relationships
- The elimination of on-premises collectors
- Improve out-of-the-box reporting capabilities
- Allow for more robust dashboards
SL1 - strategic monitoring tool of choice
- VMware vSphere stack monitoring
- Linux operating system monitoring (ssh)
- Historical performance data gathering and presentation
- Consolidation of functionality into a single PowerPack. e.g. Microsoft: Windows Server
- Search feature for historical events. Currently have to check individual devices.
- Need the ability to template thresholds on Linux devices based on Organization and filesystem name.
Review
- Installation of Appliances is simple
- UI is good
- It supports many Protocols
- APM is required
- Agent should be available for On-Prem solution
- AIOPS functionalities should be available for On-Prem solution
SL1 is continuously evolving and it effectively integrates with other softwares to become Manger of managers.
- Auto-Discovery feature is very good which helps us in building relationships between hyper-v and VMware host and guest devices. Also, it helps in building the relationship with MSSQL Databases.
- Ability to perform bulk discovery and update in ScienceLogic.
- Flexibility to clone the Dynamic Applications and do custom modifications.
- Flexibility to create custom RBA's and do several automations.
- OOB Reports (Availability and Capacity) are not very user-friendly and also do not fetch correct data most of the time or even show blank reports a lot of time. A very limited number of reports and that too very basic and do not comply with industry best practices (like Availability reports do not have a business and not business hour feature and even does not exclude the outages during scheduled maintenance)
- Dashboards do not have a lot of widgets and are hence are not able to create complex dashboards. There should be the flexibility of adding an additional column on dashboards through Custom attributes.
- Not possible to put only a few metrics (like DB services) in maintenance for a certain period. The entire server has to be put in maintenance mode and then even OS alerts get suppressed.
- The audit logs page does not get loaded and gives "504 Gateway Time-out" most of the time
- Every small customization is treated as PS work and PS is very costly.
- The SL1 support team does not support and even does provide suggestions on issues on customized DA even if the issue is because of the built-in ScienceLogic functions. There are a lot of internal Dynamic Apps (Like for filesystem, services, processes, availability, etc) where there is no visibility on the logic of how alerts are configured.
Scope of use cases - each PowerPack should be tested properly for alerting. With the help of the application team, the DB alerts should be tested. They should consult with the DB team and ask what alerting is required and how relevant it is with the PowerPack that ScienceLogic SL1 offers, and accordingly, this should be enhanced.
- Ping monitoring and polling reports are very good. Customer-first looks for this feasibility and how closely it can monitor that is well defined in ScienceLogic SL1.
- Collectors' connectivity with SL DB is very stable. We hardly see issues of any connectivity failing. Agentless is far better and easy to handle and use than other tools. The best part is plug and play type.
- CDM monitoring, it really does well and has wise poll reporting.
- The dashboard is really awesome. We use and showcase to customers their servers as a whole, and for one server, a lot of details can be checked under the performance graph.
- Bulk Onboarding/Offboarding is so good in ScienceLogic SL1. Search criteria are matchless. ScienceLogic SL1 has such a beautiful, organized field.
- Suppression alerts, FS is so well defined, easy and quick to use.
- ScienceLogic SL1 has improved so much in defining license consumption, which shows license consumed against all items.
- Log monitoring and event monitoring should be defined and should not be enabled with event ids. We have to create a duplicate Dynamic App if different events ids are to be enabled as per application. More visibility and descriptions should be included in the Log and Event id monitoring description.
- Database monitoring should be enhanced, and more advanced features should be added, such as replication, DB mirroring, DB Sync, Log Shipping, etc. So far, with the Dynamic app, we can't monitor DB status. The same goes with virtual server addition, we don't get DB status alerts which is deadly required. The same goes for all the DB like Oracle, Postgres, MySQL, and others. Numerous features and capabilities should be there. You may take the example of CA UIM, which has more than 75 parameters to enable against DB. ScienceLogic SL1 is lacking badly in this area.
- UNIX servers cluster monitoring is not that good, we can only monitor cluster nodes' status, but there are more that can be captured as part of features.
- TOP 10 processes and services should be captured for CPU and Memory. We don't have such things yet that can be enabled or found in a server.
- HADR, AS400 are majorly asked for by customers but till now it's not available.
- Application deep level monitoring is very limited in scope, such as HTTP, DNS, AD, and others.
- ScienceLogic SL1 reports don't work so well. They need to be worked on it for internal troubleshooting purposes.
- Hardware, Backup, and Storage monitoring are very limited in scope, which should be increased.
- Traps based monitoring should be encouraged more from ScienceLogic SL1.
- Monitoring with advanced features of Active Directory, DNS servers, Exchange servers, etc., should be more in scope.
- The most important thing, PowerPack, which is in ScienceLogic SL1, should be tested well and should be released only with the consent of the Application/DB team.
- There should be a team who should work on Community PowerPack so that if the customer wants to make it and use it via general availability should be available.
- Customer support and follow-up have gone down over the past two years as if they don't bother, which has a negative impact. Customer is big or small. SMEs who work ideally send out messages to other organizations about how good a tool is or how bad its support system is.
- A quarterly training session should be organized, as in real terms, your ScienceLogic SL1 is driven by SMEs who work on your tool, and many of the wrong impressions are sent due to SMEs' ignorance even if the tool is good.
- I see the big scope of ScienceLogic SL1 as a monitoring tool provided 10% of ScienceLogic SL1 product is improved. The demand for 10% is so much, and it's not good that it's the main reason your 90% good things are sidelined.
Cognizant Review
- On prem Monitoring
- Cloud monitoring
- customization option available to explore solutions that are not available out of the box
- Integration Options
- License flixibility
- PS cost
- Frequency to release new cloud service support
All in one AIOps solution
- Discovery of IT devices and update the CMDB
- Network device performance monitoring
- Event correlation of IT Devices
- SL1 uses remote monitoring technology for server device monitoring, using PowerShell, WMI, and other protocols which are cumbersome to deploy required lots of effort to open the ports and start initial monitoring
- Remote monitoring technology brings some challenges such as a number of devices to be monitored per collector.
- Procuring remote monitoring pre requisites are time consuming and error prone
- Log monitoring & management required significant improvement
- Data analytics & management required significant improvement
Science Logic EM7 SL1 Release for Service Providers
- Event logging
- Event escalation
- Monitoring of applications
- Collection of data
- Ticketing platform is being deprecated
- UI not intuitive for most users
- SL1 is not complete in functionality
My view on ScienceLogic SL1
- Escalation support for EM7 product
- Flawless handover between support engineers during a P1
- Online Training
- Service desk support needs improvement. I would love to get minimal questions from SD agent during a critical P1 support call when [the] customer is referring a case number
- Support engineer knowledge on IS product needs improvement
- Delay in Engineering teams support during public holidays and weekend support
- Percona support and response needs improvement during crisis
Good product!
- UI is good.
- Alerts feature has been beneficial.
- API makes it easy to pull data for developers.
- API are not robust since they fail sometimes due to multiple requests.
- API documentation could be bettered.
- UI is a little slow and dodgy sometimes.
- Powerful monitoring capability, can ingest data from a lot of sources
- Good multi-tenancy features
- Extensible - can write your own powerpacks/code snippets
- Built-in automation features
- Business Services
- The interface - it is out of the 1980s. Version 8.14 is current and I believe a new version is coming with a new interface. UPDATE - the new interface is much, much better.
- Community - not a huge user group like you have with other software. i.e. - very few blogs on features/how-tos etc.
- Monitoring items in VMware is a bit cumbersome, You need to monitor the vCenter endpoint. It will drag in all components relating to it. If you wish to see metrics for particular machines, you also need to create and manage a discovery for that machine--something as simple as file space usage.
- Powerpack support. If you use a powerpack that is community-built, getting support for this is tough.
- Support does not have a chat option, however it is typically good.
- Discover the whole environment
- Getting granular details about the nodes in the environment
- Dynamic alignment of monitoring applications
- Agentless monitoring
- Understanding the inbuilt Maria DB schemas and data structure
- Details on the Dynamic Applications Snippets and the associated core Python scripts created on the servers
- Changing any details on the backend [via Database] not reflected in front end [GUI]
My ScienceLogic Review
It escalates callouts to our engineers via PagerDuty and then raises a ticket in hornbill for the incident.
- It monitors our devices and reports on the detections we have created.
- Most of the things I can think of have now been addressed in this new release.
Technical opinion
In some cases, it is helping us to generate our report for our customers, i.e. when a customer migration happens.
Also, we create some intelligence about alarming, so the service is better monitored.
- Accurate monitoring.
- Monitoring automation.
- Alarm reporting.
- Hardware requirements too high.
- Tracing tool.
- Professional reporting tool.
Just the beginning
- Increased speed and efficiency of onboarding new environments.
- Contextual troubleshooting with IT and Business Services.
- Consolidation of toolsets.
- Requires deep knowledge of the product, time to upskill.
- Do not assume everything works straight out of box, be prepared to develop code.
- Business resistance to change and expenditure.
SciLo
- You can integrate automation.
- Monitoring devices for outages.
- Scheduling for device maintenance window.
- Modernized display or GUI.
- Additional tools for monitoring.
- Device logging.
ScienceLogic SL1's Benefits with the environment
- The automation of monitoring
- The integration to ticketing tools
- Can change schedules and automate the maintenance schedule of the device to prevent alerts
- For now, I can't see any problem with ScienceLogic SL1, however, I think it's good to put an option or settings with the TimeZone, since our office is in AU but we're working in the PH.
Good tool, not excellent
- Agentless monitoring
- Capacity monitoring
- Cloud capacity monitoring
- General integration through snippets/api/RBA
- Development documentation is still required.
- Out of the box integration with event management tools.
My ScienceLogic Review
- Dynamic Applications: Able to build custom applications which makes us more scalable.
- CMDB population: Automatic CI population of assets and attributes provides excellent inventory reporting and helps with billing.
- Dashboards: Excellent ways to build custom views of devices and graphs helps to get a good view of the health of a customer's system.
- Upgrades: Looking forward to the new Yum deployment.
- Interface management: I want to be able to disable/not discover certain interfaces. Filters by type, device class, ifDescr, org, etc. would be lovely.
Just a try
- Correlation
- Incident reduction
- P1 Outage handling
- Dashboards
- On your website, please include a doc for the offline upgrade if it is not there, as I didn't find one.
- ITSM testing with ServiceNow.
- PerconaCluster.
ScienceLogic SL1 review and why you should use it
ScienceLogic helps solve a number of problems:
- Monitoring of status and performance of assets and services.
- Displays and views via dashboards and Business Service views of the overall health/risk and performance of key higher-level services.
- Event-based automation. ScienceLogic is a great platform to launch automated actions from. It comes with a large number of pre-build infrastructure specific scripts, which are easy to customize (with basic knowledge of Python).
- Integration with other IT deliver tools such as ITSM tooling & CMDB.
- Auto-generation of network maps that show asset dependency.
- Status and performance monitoring with great de-duplication of events.
- Event-based automation.
- Easy integration with ITSM tools for CMDB, Incident Management and Change Enablement.
- Dashboards and Business Service views.
- Network dependency mapping.
- One of the strengths of ScienceLogic is its investment in the roadmap and development.
- SL always listen to ideas on how we think we can improve the product.
This has improved as SL1 offers deeper levels of monitoring and also easier management of the platform (Ease of management is important as changes are more likely to get done. If I make an improvement to a monitoring method, I can easily apply that update to all of those monitored devices across multiple customers).
The Business Service views mean that I can easily create views into the monitoring data that are applicable to different levels within an organization. For example, an overview of business services for director level and a lower level performance view of assets for engineer level of employee.
We use ScienceLogic across the organization to monitor both our infrastructure and the health endpoints of services, and have found it gives us great visibility of system health. We are currently exploring moving away from competent level dashboarding and moving to dashboarding that will display the business services and show the impact a component failure has on that service as well as any other services dependent or linked to it.
In 2020 we carried out a migration to ScienceLogic’s SaaS platform to remove the requirement of both hosting and managing onsite DBs and this has also opened up new opportunities we are exploring within ScienceLogic.
- Easy to install and configure.
- Good level of detail/information captured from the monitoring.
- Great engagement from account managers, CSM’s and support teams.
- Reduce the time it takes to fix support requests.
When moving to ScienceLogic we gained a deeper insight into our infrastructure, its functionality and health alongside providing us with a more in-depth dashboarding tool-set.
We are also hoping with the move to service orientated dashboarding this will provide us with better visibility of service functionality, the impact a service issue has on other services, and also allow us to provide the business with dashboards to be able to view their service health.
ScienceLogic - Enterprise Considerations
- Deep monitoring across infrastructure components and with 8.12 across application layers
- Device discovery which builds infrastructure components
- ServiceNow Integration for CMDB driven device discovery as well as event-to-incident integration and automation
- Runbook Automation controlling notification as well as leading to remediation capabilities
- Event richness enabling detection of leading events which occur prior to a failure
- 12 introduces #multitenancy support which enables Enterprise with many Organizations to share (read-only) properties and performance data across Organizations without compromising credentials with inappropriate access. This is the first release of this feature and we are only now evaluating the well-communicated delivery against our requirements. This has been communicated as only being applicable via the new UI.
- Monitor thyself. We have found data gappiness issues which stem from incomprehensible / non-actionable system messages. The system is unable to communicate SIGTERM when used as a timeout (implying capacity issues) and SIGTERM when actually used as a fault (implying something non-actionable). The advisory services team is going to help, but this needs to be productized and shipped rather than be made available by customer success manager engagement. Things that SHOULD have results but do not should throw a under-collected event by the type of collection which is under reported. This should have a dynamic part of the event giving specific numbers not bland / generic statements that have to be interpreted. The platform team should immediately recognize the fault because the numbers are relevant. These events should be actionable, either referencing KB articles or some other specific remediation plan.
- Data collector load v. capacity planning in both a vertical (cpu, memory, disk) and horizontal (more collectors). The data collector specs are very stale. 4x24G is recommended for 1000 devices but customers frequently view that as individual devices, not the DCM trees found during discovery. Those tend to be my expect N (<= 1000) devices + M (which are barely understood records and which are typically treated as zero, when in fact these devices are what blow through the assumed 4x24G capacity spec). Need a horizontal-infra-scaling event as well as a vertical-capacity-limit event to be thrown when more collectors are needed.
- Actionable events. My end users barely understand the events. Referencing a KB article by URL might help users and admins in remediation. If you already understand the events they are obvious. If you don't, such as timeouts, having an article which helps people identify standard remediation steps will help close outages faster. Most events are contextual. Pointing users at that context will help.
- In-person training
- Self-taught
Previously, the two minor upgrades seemed to take a long time and seemed to have lots of problems.
At our 8.5.1.2 to 8.9.0 upgrade, we quantified for ScienceLogic the number of pain points required to upgrade and regain a measure of stability.
We suggested that use of RPM under the hood would ease their upgrade problems.
These were painful at 8-10 hour days per stack with a fair amount of cascading problems after the upgrade.
We worked with ScienceLogic to prepare for the 8.12 upgrade and had them verify our upgrade procedures.
At our 8.9.0 to 8.12.0.1 upgrade, we still had problems, but the overall stress of 8-10 hour days was replaced by a leisurely 4-6 hour days where one could take an hour out for lunch away from the desk.
Our upgrade process is now:
1. Install and upgrade on a vagrant - write the procedure.
2. Upgrade our non-prod environments.
3. Upgrade our prod environments.
4. Consult with ScienceLogic on upgrade challenges when complete.
SL1 - review
- Flexible
- Expandable
- Service provider level
- Very detailed
- Complicated
- Lack of support from SL1
- Support sucks
- PS team sucks
- No SLa on support, it’s a joke
ScienceLogic SL1 Review
- Server monitoring
- Network monitoring
- Application URL monitoring
- Database monitoring
- Dashboard customization process needs to be improved
- Reporting part requires improvement
- Agent-based monitoring needs to be improved