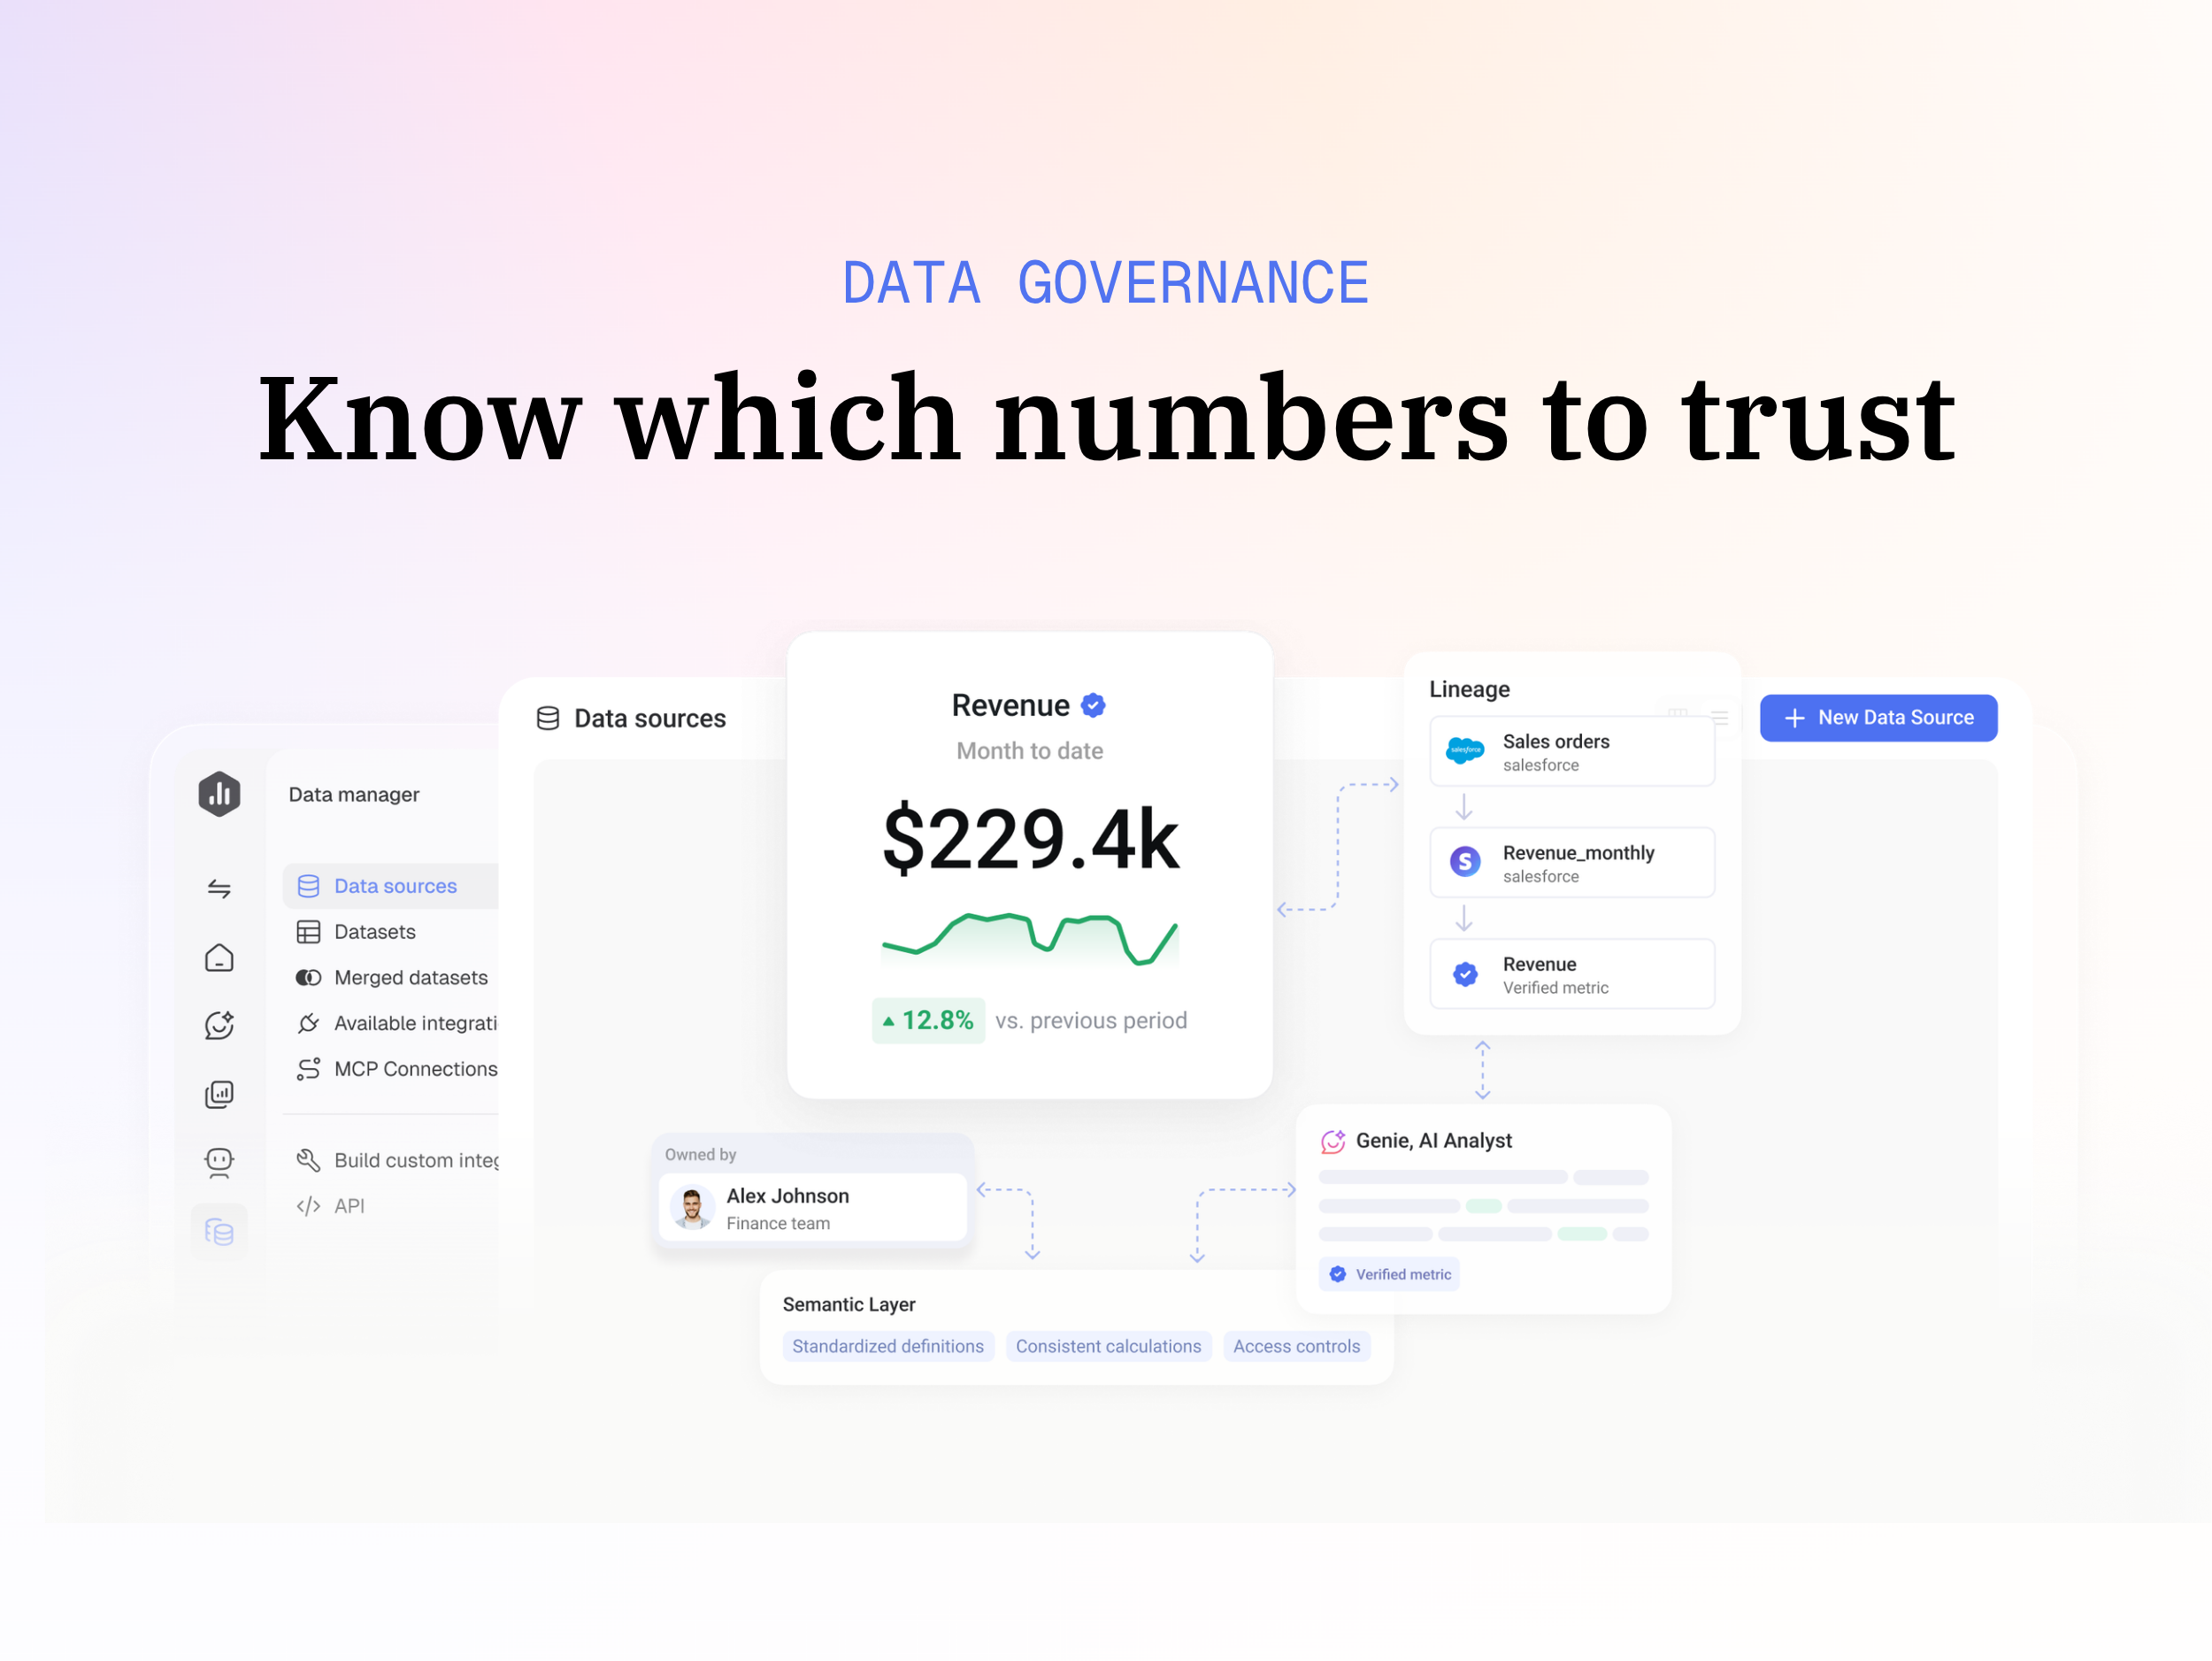
Databox is business intelligence software built for teams that need fast, actionable insights.
$79
per month
Parse.ly
Score7.8 out of 10
N/A
Parse.ly is a content optimization platform for online publishers. It provides in-depth analytics and helps maximize the performance of the digital content. It features a dashboard geared for editorial and business staff and an API that can be used by a product team to create personalized or contextual experiences on a website.
$499
per month
Pricing
Databox
Parse.ly
Editions & Modules
Free
$0
1 user, 3 data sources & 50 AI credits/mo included
Analyst
$89
per month 1 user, 5 data sources & 150 AI credits/mo included
Team
$249
per month 3 users, 10 data sources & 500 AI credits/mo included
Agency
Starting at $99
per month 4 clients, unlimited users, 20 data sources & 300 AI credits/mo included
Custom
Contact us
More users, More data sources, More AI credits/mo, We optimize it as your needs
I believe Databox can be an asset for any company. We are a small company, but I can see the value for large companies too. Databox is a great fit for departments or organizations that need to put their data into a readable form without needing a ton of reports. Databox allows you to save time and put together a nice report without having to do too much extra work. Once it is set up, it basically runs on its own at the frequency you set. I personally receive a daily report and have it sent to the respective people on the day of our meeting so we can quickly review it.
A de minimis incentive was given to thank the reviewer for their time. The incentive was not used to bias or drive a particular response, nor was the incentive contingent on a positive endorsement. More Info
Parse.ly is a great tool for publishers who want to track engagement and audience behaviour across websites. With Parse.ly, we can easily track metrics like pageviews, time spent on page, and scroll depth to see which content is resonating with our audience and optimize our content strategy accordingly. Our marketers found Parse.ly to be an excellent tool for tracking the effectiveness of our campaigns. We can use Parse.ly to track metrics like referral sources, conversion rates, and engagement by audience segment to see which channels and tactics are driving the most engagement and conversions.
A de minimis incentive was given to thank the reviewer for their time. The incentive was not used to bias or drive a particular response, nor was the incentive contingent on a positive endorsement. TR verified that a representative sample of customers was invited. More Info
A de minimis incentive was given to thank the reviewer for their time. The incentive was not used to bias or drive a particular response, nor was the incentive contingent on a positive endorsement. More Info
A de minimis incentive was given to thank the reviewer for their time. The incentive was not used to bias or drive a particular response, nor was the incentive contingent on a positive endorsement. More Info
Some types of data can only be reported on for 1-2 months back. Unless I'm misunderstanding the function of the software this seems really weird. I can't figure out how to report on Activities more than 2 months ago
A de minimis incentive was given to thank the reviewer for their time. The incentive was not used to bias or drive a particular response, nor was the incentive contingent on a positive endorsement. More Info
A de minimis incentive was given to thank the reviewer for their time. The incentive was not used to bias or drive a particular response, nor was the incentive contingent on a positive endorsement. TR verified that a representative sample of customers was invited. More Info
As an employee, this is difficult for me to comment as I am not directly funding or making these business decisions. However, it is a tool many get on with for surface level data that is useful to editorial teams.
A de minimis incentive was given to thank the reviewer for their time. The incentive was not used to bias or drive a particular response, nor was the incentive contingent on a positive endorsement. More Info
Databox is an intuitive, well-designed platform that can be used by non-technical marketers. It is easy to learn, and while set up takes time, usability is high and the team has enjoyed creating custom dashboards and clients have also given us great feedback regarding its usability and value. While other BI tools are much more complex to navigate, Databox is a breeze.
A de minimis incentive was given to thank the reviewer for their time. The incentive was not used to bias or drive a particular response, nor was the incentive contingent on a positive endorsement. More Info
The Parse.ly platform is very user-friendly and easy to use. User management is simple, and reporting setup only takes a few minutes. They provide very helpful documentation for implementing the scripts on your site and have great customer support to help with custom development such as implementing their content recommendation engine.
A de minimis incentive was given to thank the reviewer for their time. The incentive was not used to bias or drive a particular response, nor was the incentive contingent on a positive endorsement. More Info
I have really enjoyed using Databox and have seen the value of it in many ways. They also continue to improve the functions of it and grow their integrations and templates. I look forward to continuing to use Databox in the future, potentially even finding ways to incorporate it into other departments to help them with reporting as well.
A de minimis incentive was given to thank the reviewer for their time. The incentive was not used to bias or drive a particular response, nor was the incentive contingent on a positive endorsement. More Info
I rate this question this way solely because I haven't requested any support. I feel where I will eventually get support would be when we take Parse.ly up on some training that is being offered. We are looking to do that at some point after the first of the year and when our schedules support it.
A de minimis incentive was given to thank the reviewer for their time. The incentive was not used to bias or drive a particular response, nor was the incentive contingent on a positive endorsement. More Info
Databox is unique in its ability to report from multiple data sources. Google Analytics is the standard when it comes to web metrics, but it's just one of the tools that integrates with Databox. Tableau is fantastic for data visualizations and reporting, but it's much more expensive than Databox, so it's not ideal for everyone. Tableau is also superior with customization
A de minimis incentive was given to thank the reviewer for their time. The incentive was not used to bias or drive a particular response, nor was the incentive contingent on a positive endorsement. More Info
Parse.ly does pretty well compared to Chartbeat, particularly when it comes to historical information and analysis options that are easy for employees to use after some short training. The onboarding for Parse.ly is intuitive, and the scheduled reports take away basically all of the inconvenience associated with regular metrics reviewing. But Chartbeat wins in its social audience tracking because it can source traffic to a specific social post, which can show you exactly how your audience is coming to your content and where you need to put your content to be sure you get that audience.
A de minimis incentive was given to thank the reviewer for their time. The incentive was not used to bias or drive a particular response, nor was the incentive contingent on a positive endorsement. TR verified that a representative sample of customers was invited. More Info
A de minimis incentive was given to thank the reviewer for their time. The incentive was not used to bias or drive a particular response, nor was the incentive contingent on a positive endorsement. More Info
Sometimes in meetings our editorial director will point out stories that didn't perform well. To us, that means readers don't really care about the topic, so we'll pivot away from writing about that in the future. That might not be "business objectives" though.
A de minimis incentive was given to thank the reviewer for their time. The incentive was not used to bias or drive a particular response, nor was the incentive contingent on a positive endorsement. More Info