
Chose Epicor Grow
Epicor Grow vs. Oracle Analytics vs. Tableau Desktop
Epicor Grow vs. Oracle Analytics vs. Tableau Desktop
| Product | Rating | Most Used By | Product Summary | Starting Price |
|---|---|---|---|---|
 Epicor Grow | Small Businesses (1-50 employees) | Grow, from Epicor since the March 2022 acquisition, is a business intelligence software that is designed to empower businesses to become data-driven and accelerate growth by aligning team objectives and inspiring strategic decisions. | N/A | |
 Oracle Analytics | N/A | Oracle Analytics is a solution used to visually explore data to create and share compelling stories. Oracle Analytics Cloud is a cloud native service, and Oracle Analytics Server is the on-premise option. | N/A | |
 Tableau Desktop | N/A | Tableau Desktop is a data visualization product from Tableau. It connects to a variety of data sources for combining disparate data sources without coding. It provides tools for discovering patterns and insights, data calculations, forecasts, and statistical summaries and visual storytelling. | $1,380 per year (purchased via a Creator license) |
| Epicor Grow | Oracle Analytics | Tableau Desktop | ||||||||||||||||||||||
|---|---|---|---|---|---|---|---|---|---|---|---|---|---|---|---|---|---|---|---|---|---|---|---|---|
| Editions & Modules | No answers on this topic | No answers on this topic |
| |||||||||||||||||||||
| Offerings |
| |||||||||||||||||||||||
| Entry-level Setup Fee | Required | No setup fee | No setup fee | |||||||||||||||||||||
| Additional Details | — | Must contact sales team for pricing. | All pricing plans are billed annually. A Creator license includes Tableau Desktop, Tableau Prep Builder, and Tableau Pulse. Discounts sometimes available for volume. | |||||||||||||||||||||
| More Pricing Information | ||||||||||||||||||||||||
| Epicor Grow | Oracle Analytics | Tableau Desktop | |
|---|---|---|---|
| Considered Multiple Products |  Epicor Grow  Kyle Garrett Marketing and Sales Operations Chose Epicor Grow Grow.com has the easiest to use UI/UX out of the other business intelligence tools that I have used. It is a little more intuitive and takes less knowledge of SQL to really get what you want. The pre-built metrics really help to get up and going right out of the box, where … | Oracle Analytics  Jude Odu Senior Business Analyst / SME Chose Oracle Analytics Oracle BI is similar to MicroStrategy in their difficulty of implementation and need for technical resources for ongoing management and administration. Both are well-suited for very large corporations with extensive data processing requirements. More modern BI tools such as Tabl…  Hemant Prabhakar Patil BI Consultant Chose Oracle Analytics Business Objects was considered in places where the organization is using an SAP-based transactional system. Looker again becomes the advantage where you are going to build a totally new customized data warehouse model since it allows you to better reduce some extent of the ETL …  Vineet Rai BI Architect Chose Oracle Analytics Oracle BI works pretty well and has been well acknowledged and appreciated by the business users and power users who develop reports and dashboards. Compared to other tools, Oracle BI object development is easier and has a quick turnout. Using Oracle BI with Essbase and Oracle …  Sumeet Saraf Sr BI Consultant Chose Oracle Analytics SAP Business Object license is not cheap and was a bigger pain for the client to implement and adapt a new tool. QlikView is mainly used for dashboards and is not the best fit for reporting and ad-hoc reports. Since the client was using an Oracle tool set for their application …  Carlos Sanz Porro Business Intelligence Consultant Chose Oracle Analytics Customers compare them with othe tools and find they are not the same.  Satyendra Yenugula Director of Business Intelligence Chose Oracle Analytics Compared to Microsoft BI, Oracle BI has got good data modeling, adhoc reporting, scheduling and some rich visualization capabilities which definitely made us to choose Oracle BI against Microsoft BI. Tableau BI is a very simple and easy tool to implement and helps business users …  John WilsonMay Business Intelligence Program Manager Chose Oracle Analytics I have used SQL Server, SAS deployed over the web, SPSS, Tableau and Salesforce. Each has their own positives and negatives. I was not directly involved in the selection process, but have participated as a BI representative using the tools. OBI is less complicated than SAS, but …  Mary BrowningSmith Project Leader - Strategic Leverage Platforms Chose Oracle Analytics Business Objects - OBIEE is more stable - BO was always going down, OBIEE has a superior metadata layer Tableau is nice to have as a compliment to OBIEE, but it could never take its place. It is not scalable and the report builders need to have a greater understanding of the … |  Tableau Desktop No answer on this topic |
| Epicor Grow | Oracle Analytics | Tableau Desktop | |||||||||||||||||||||||||||
|---|---|---|---|---|---|---|---|---|---|---|---|---|---|---|---|---|---|---|---|---|---|---|---|---|---|---|---|---|---|
| BI Standard Reporting |
| ||||||||||||||||||||||||||||
| Ad-hoc Reporting |
| ||||||||||||||||||||||||||||
| Report Output and Scheduling |
| ||||||||||||||||||||||||||||
| Data Discovery and Visualization |
| ||||||||||||||||||||||||||||
| Access Control and Security |
| ||||||||||||||||||||||||||||
| Mobile Capabilities |
| ||||||||||||||||||||||||||||
| Application Program Interfaces (APIs) / Embedding |
|
| Epicor Grow | Oracle Analytics | Tableau Desktop | |
|---|---|---|---|
| Small Businesses |  Yellowfin Score 8.6 out of 10 | Yellowfin Score 8.6 out of 10 | Yellowfin Score 8.6 out of 10 |
| Medium-sized Companies |  Reveal Score 10.0 out of 10 | Reveal Score 10.0 out of 10 | Reveal Score 10.0 out of 10 |
| Enterprises |  Kyvos Semantic Layer Score 9.5 out of 10 | Kyvos Semantic Layer Score 9.5 out of 10 | Kyvos Semantic Layer Score 9.5 out of 10 |
| All Alternatives | View all alternatives | View all alternatives | View all alternatives |
| Epicor Grow | Oracle Analytics | Tableau Desktop | |
|---|---|---|---|
| Likelihood to Recommend | 8.0 (32 ratings) | 8.1 (76 ratings) | 9.0 (204 ratings) |
| Likelihood to Renew | - (0 ratings) | 9.1 (8 ratings) | 7.5 (41 ratings) |
| Usability | 7.1 (5 ratings) | 8.2 (6 ratings) | 8.3 (73 ratings) |
| Availability | - (0 ratings) | 9.1 (1 ratings) | 10.0 (11 ratings) |
| Performance | - (0 ratings) | 9.1 (1 ratings) | 8.0 (10 ratings) |
| Support Rating | 9.4 (5 ratings) | 9.1 (4 ratings) | 1.0 (57 ratings) |
| In-Person Training | - (0 ratings) | 9.0 (1 ratings) | 9.4 (4 ratings) |
| Online Training | - (0 ratings) | 9.1 (1 ratings) | 8.0 (5 ratings) |
| Implementation Rating | - (0 ratings) | 9.1 (3 ratings) | 8.0 (34 ratings) |
| Configurability | - (0 ratings) | 9.1 (1 ratings) | 7.0 (3 ratings) |
| Ease of integration | - (0 ratings) | 8.2 (1 ratings) | 10.0 (1 ratings) |
| Product Scalability | - (0 ratings) | 9.1 (1 ratings) | 9.0 (4 ratings) |
| Vendor post-sale | - (0 ratings) | - (0 ratings) | 10.0 (1 ratings) |
| Vendor pre-sale | - (0 ratings) | - (0 ratings) | 10.0 (1 ratings) |
| Epicor Grow | Oracle Analytics | Tableau Desktop | |
|---|---|---|---|
| Likelihood to Recommend | Epicor Software
| Oracle
| Tableau
 Karol Kozłowski Project manager |
| Pros | Epicor Software
 Matthew Racz Co-Founder and Chief Operating Officer | Crowdfunding Advisor | Oracle
| Tableau
 Afia Tamanna Information Technology Business Consultant |
| Cons | Epicor Software
 Ian Nate Digital Marketing Operations Manager | Oracle
| Tableau
|
| Likelihood to Renew | Epicor Software No answers on this topic | Oracle
Satyendra Yenugula Director of Business Intelligence | Tableau
|
| Usability | Epicor Software
| Oracle
| Tableau
 Al Mubassir Muin Software Engineer |
| Reliability and Availability | Epicor Software No answers on this topic | Oracle
| Tableau
 Brad Llewellyn Associate Data Analytics Consultant |
| Performance | Epicor Software No answers on this topic | Oracle
| Tableau
|
| Support Rating | Epicor Software
| Oracle
| Tableau
|
| In-Person Training | Epicor Software No answers on this topic | Oracle
 Tom Jaskula Manager - Business Analytics | Tableau
 Jon Boeckenstedt Associate Vice President |
| Online Training | Epicor Software No answers on this topic | Oracle
| Tableau
|
| Implementation Rating | Epicor Software No answers on this topic | Oracle
Tom Jaskula Manager - Business Analytics | Tableau
 David Fickes Decision Sciences - Modeling, Simulation & Analysis |
| Alternatives Considered | Epicor Software
 Thomas (TC) Riley Director, Analytics | Oracle
 Ali Kazempour Information Technology Adviser | Tableau
|
| Scalability | Epicor Software No answers on this topic | Oracle
| Tableau
|
| Return on Investment | Epicor Software
 Haleigh Doherty Demand Gen Ops Manager | Oracle
Mary BrowningSmith Project Leader - Strategic Leverage Platforms | Tableau
|
| ScreenShots | Epicor Grow Screenshots  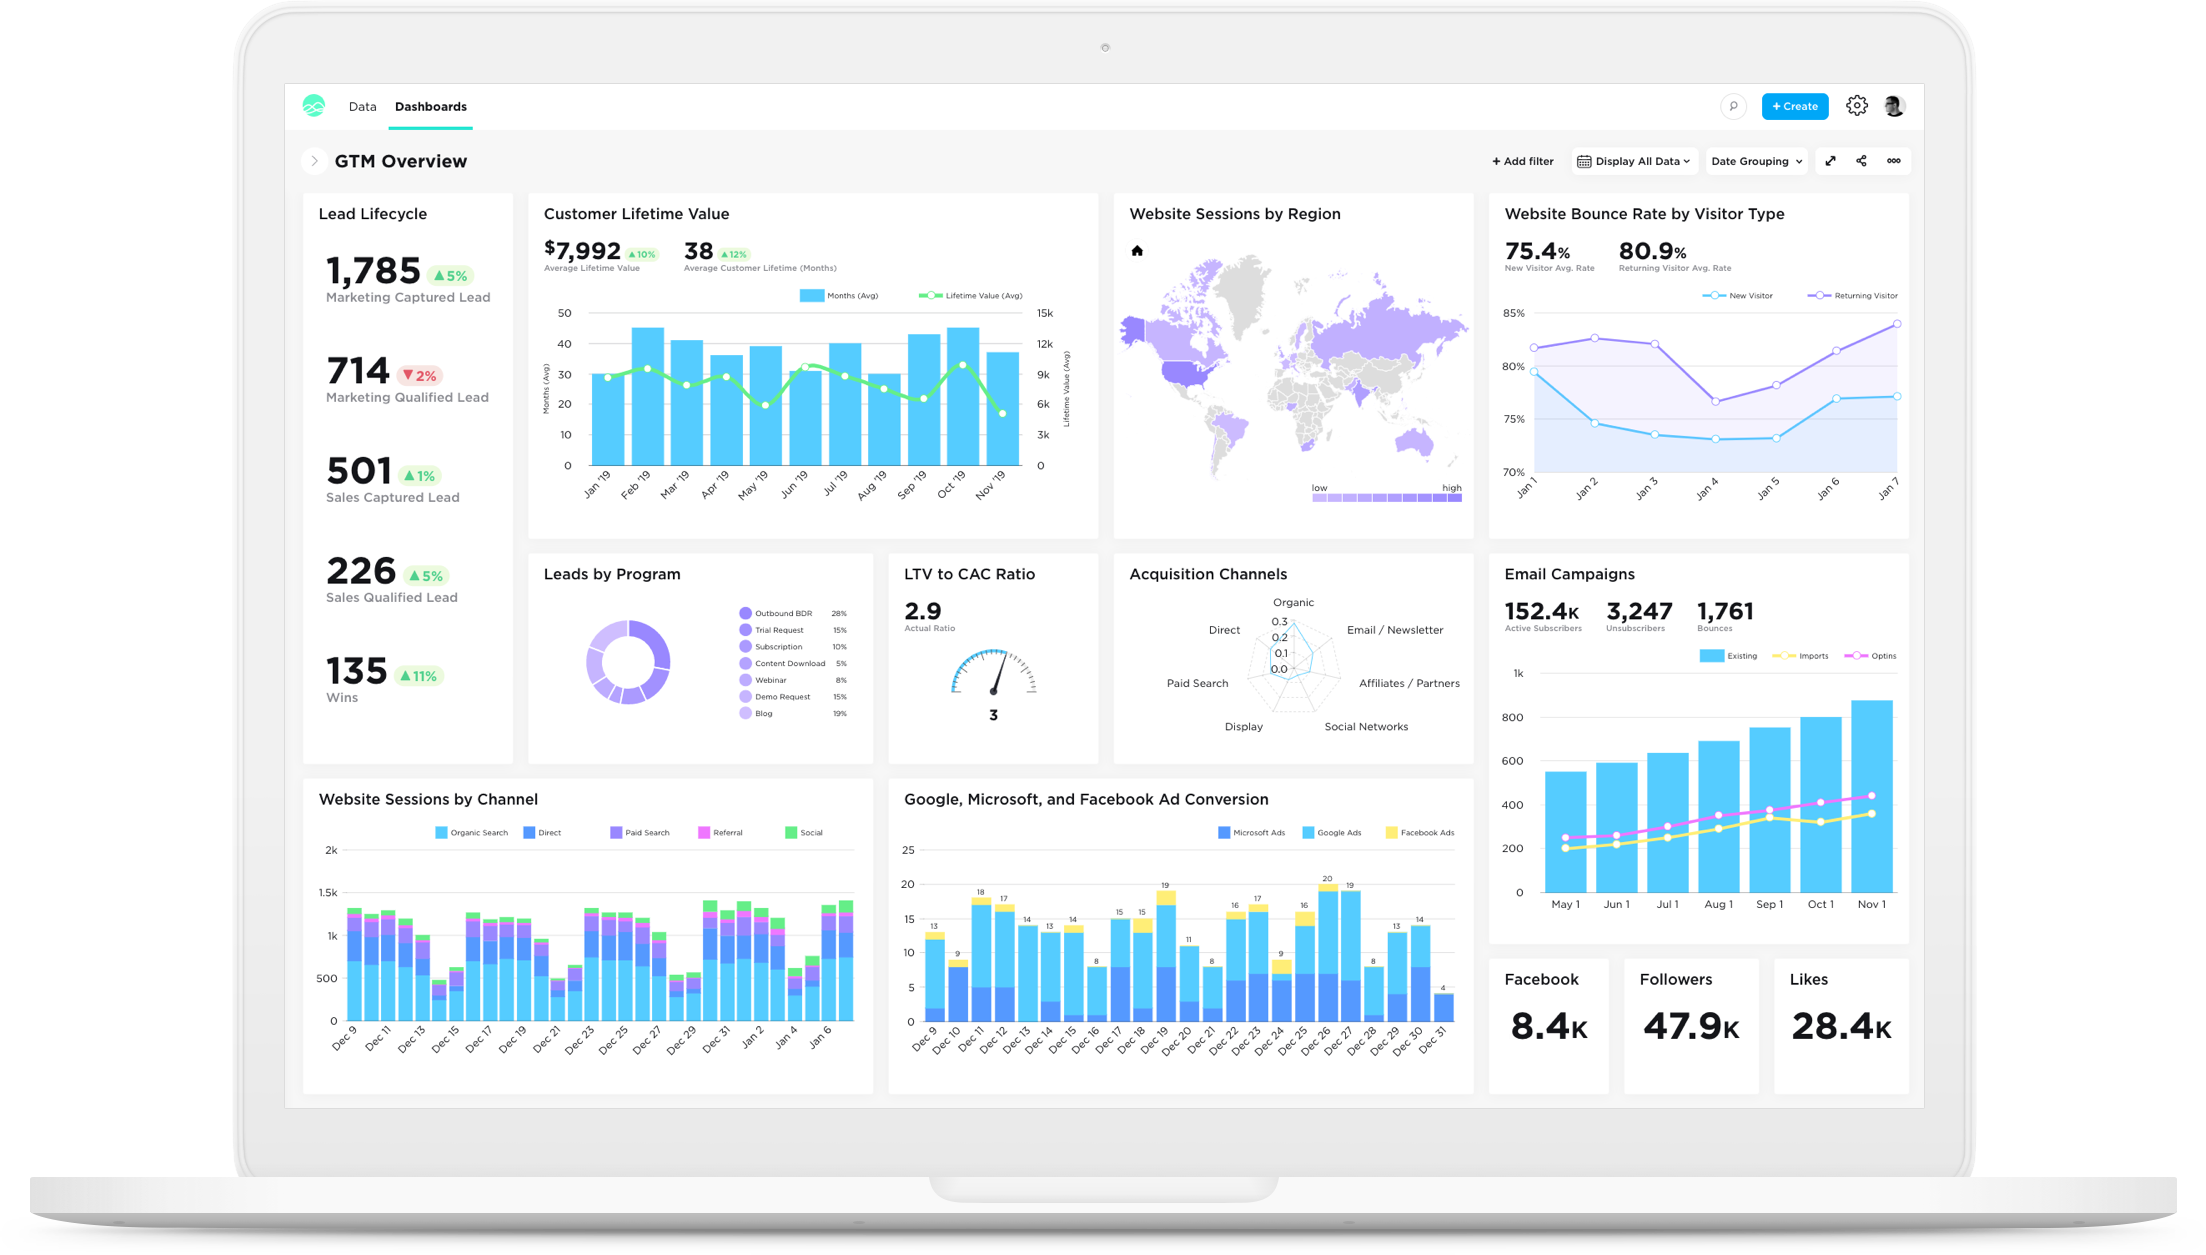 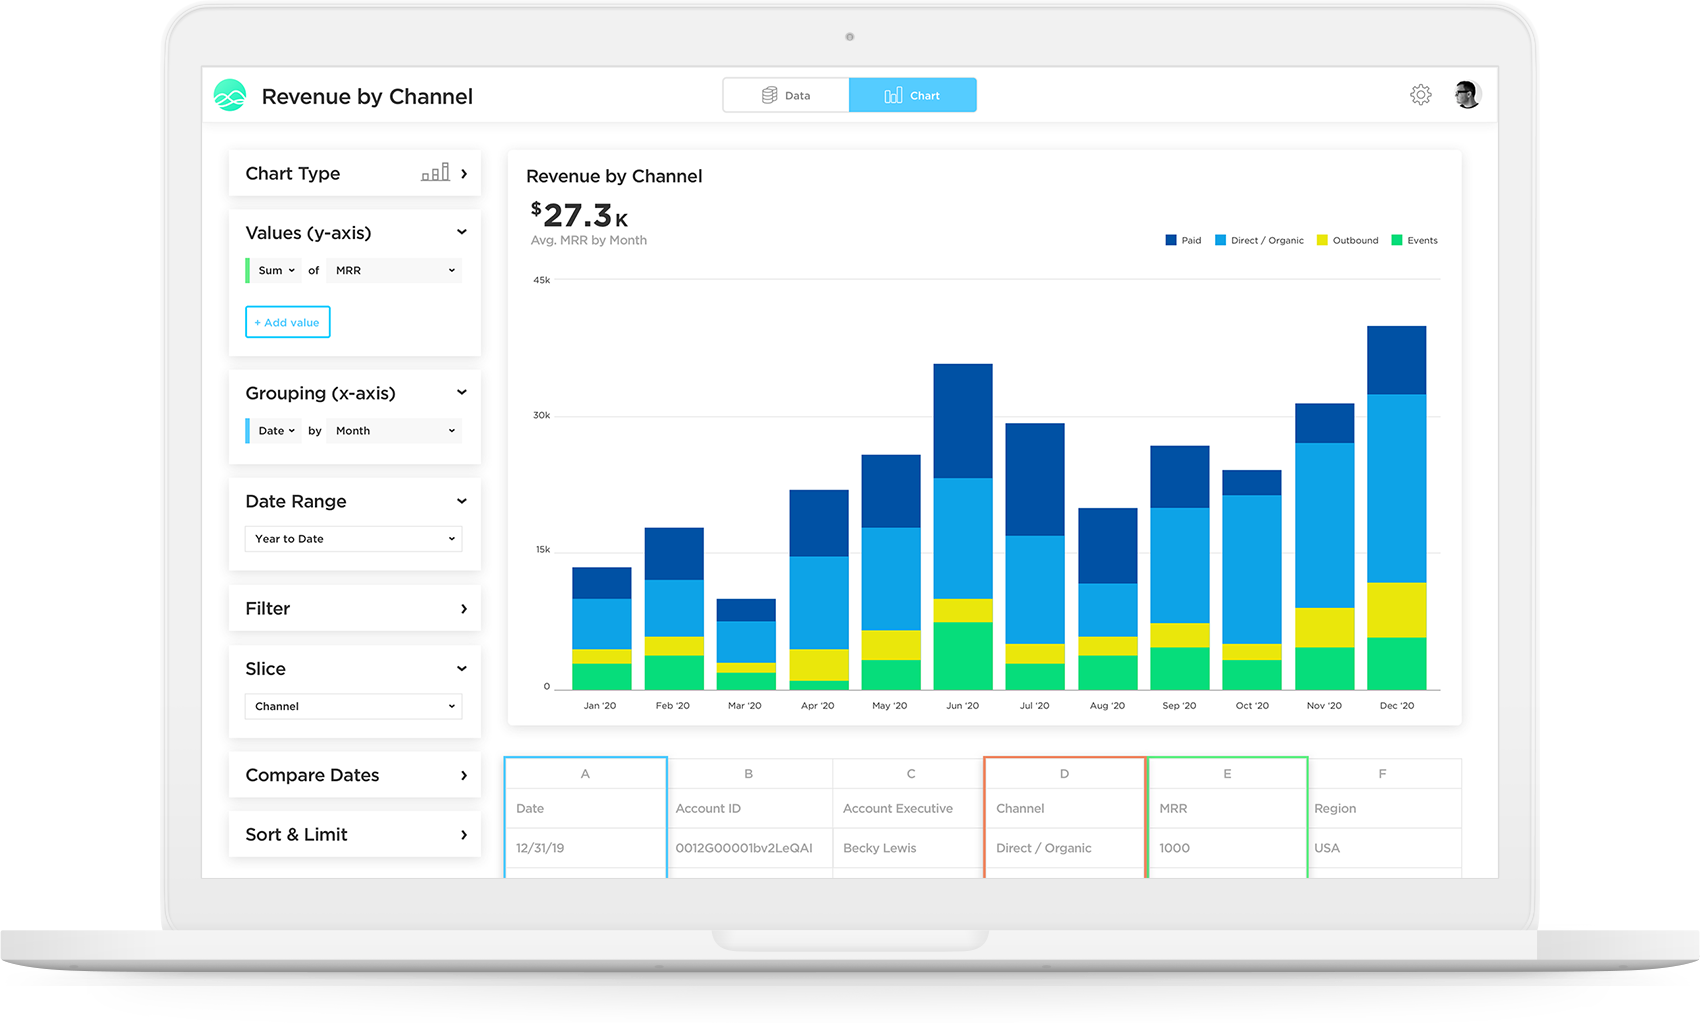 |