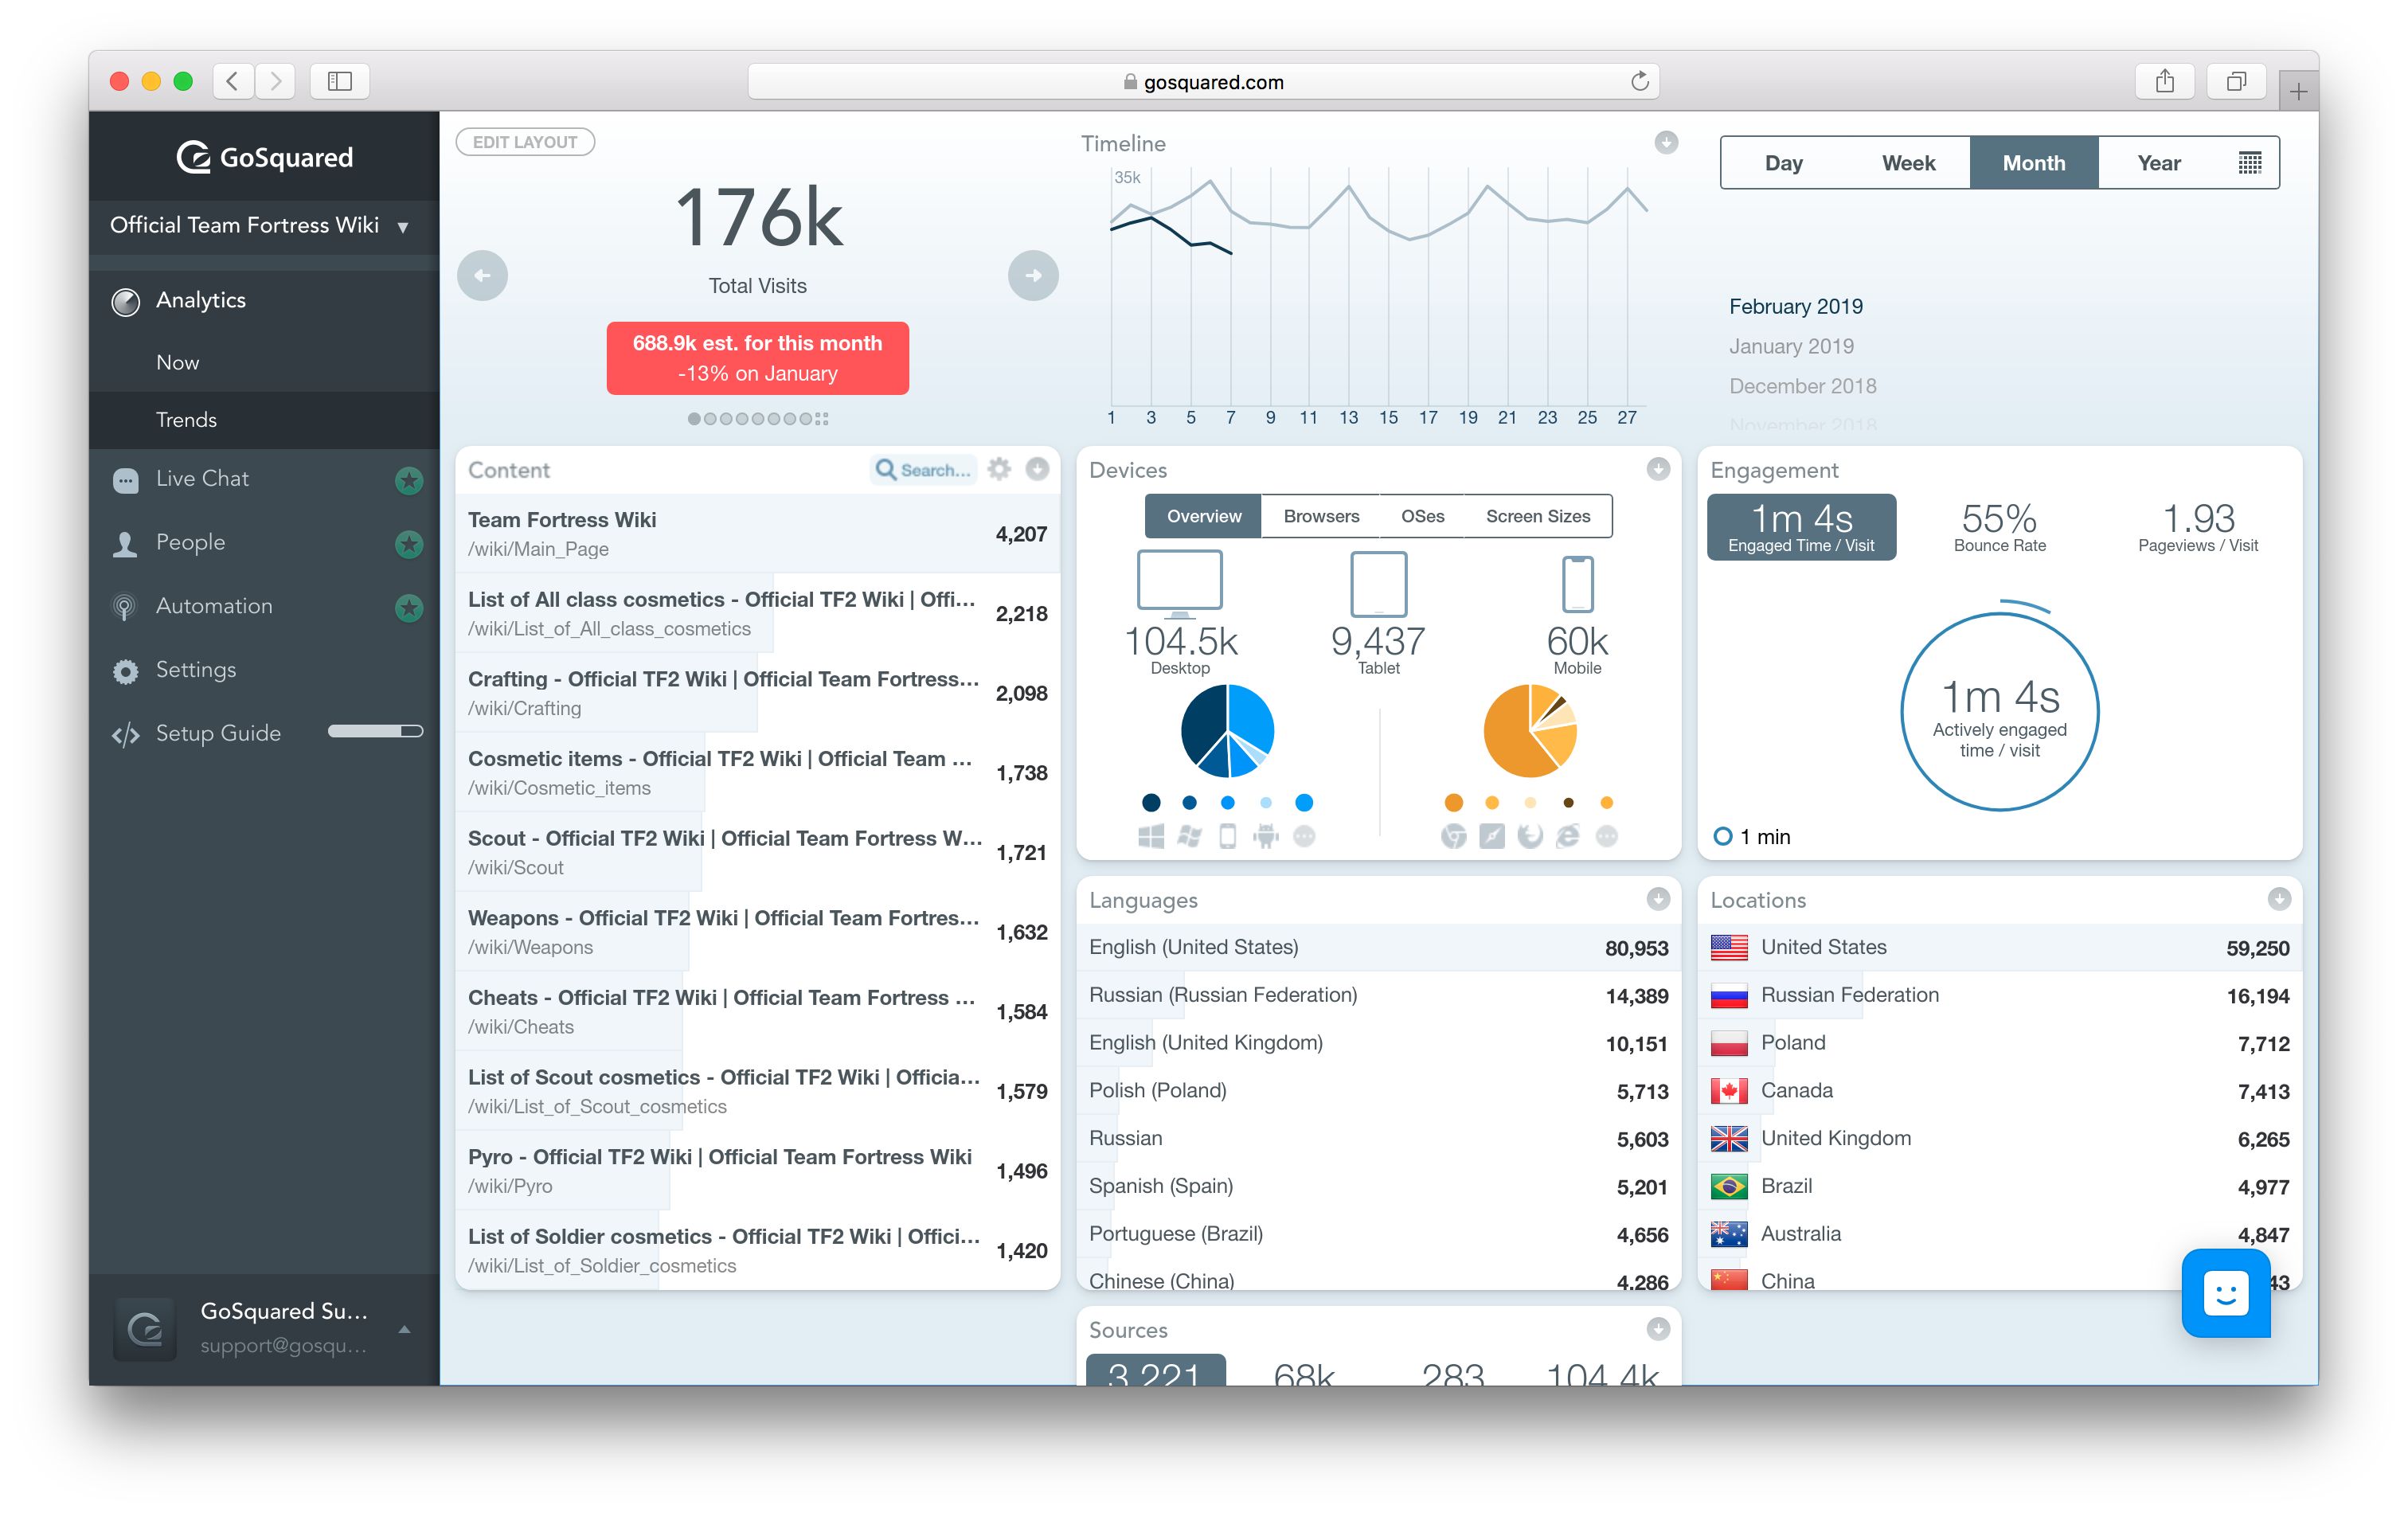
GoSquared provides real-time website analytics to sites of all sizes. The real-time dashboard displays website analytics on an individual visitor basis. The Now App displays concurrent analysis (the visitors who are on your site right now) of your site performance. The Trends App displays historical, trends and comparison analysis on real-time data. You don't have to wait 4 - 24 hours in order to compare todays current performance against last years. The Ecommerce App displays the same freshness…
$0
Per Month [Unlimited Users]
Parse.ly
Score 7.8 out of 10
N/A
Parse.ly is a content optimization platform for online publishers. It provides in-depth analytics and helps maximize the performance of the digital content. It features a dashboard geared for editorial and business staff and an API that can be used by a product team to create personalized or contextual experiences on a website.
$499
per month
Pricing
GoSquared
Parse.ly
Editions & Modules
GoSquared Free - Access to the Now and Trends realtime web analytics dashboard.
$0
Per Month [Unlimited Users]
GoSquared Analytics - Everything included in free plus premium analytics features.
$29
Per Month [Unlimited Users]
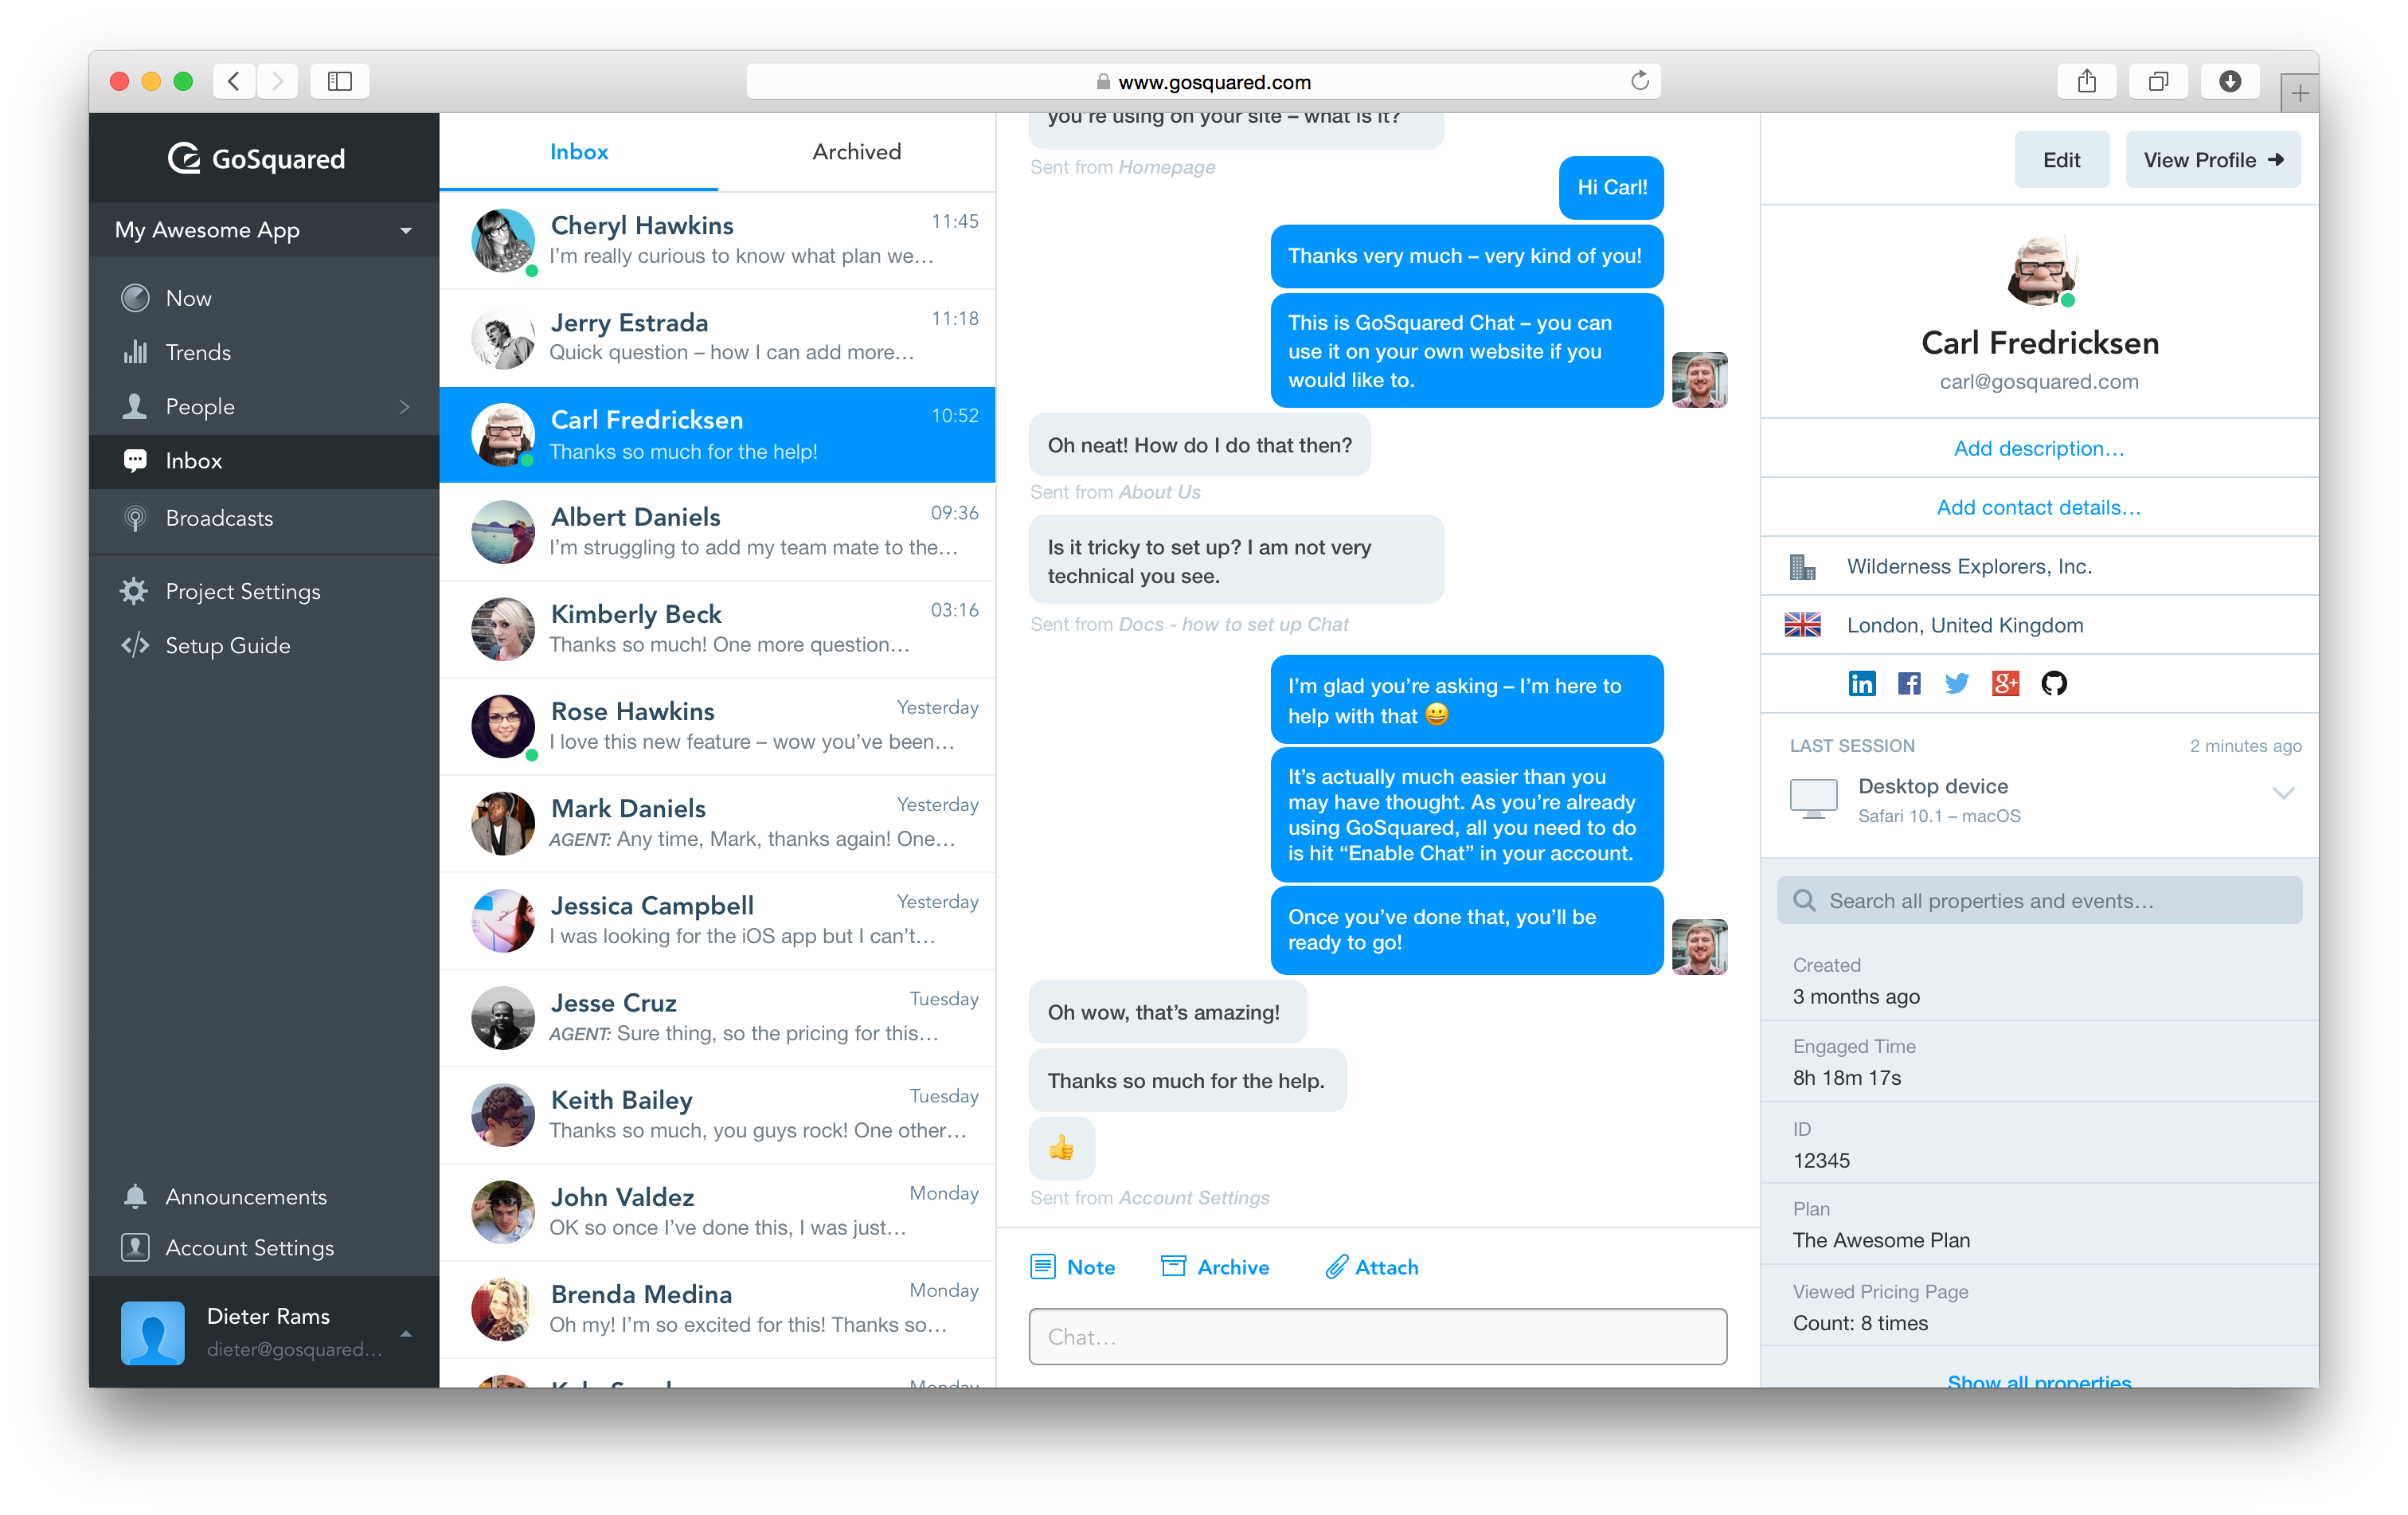
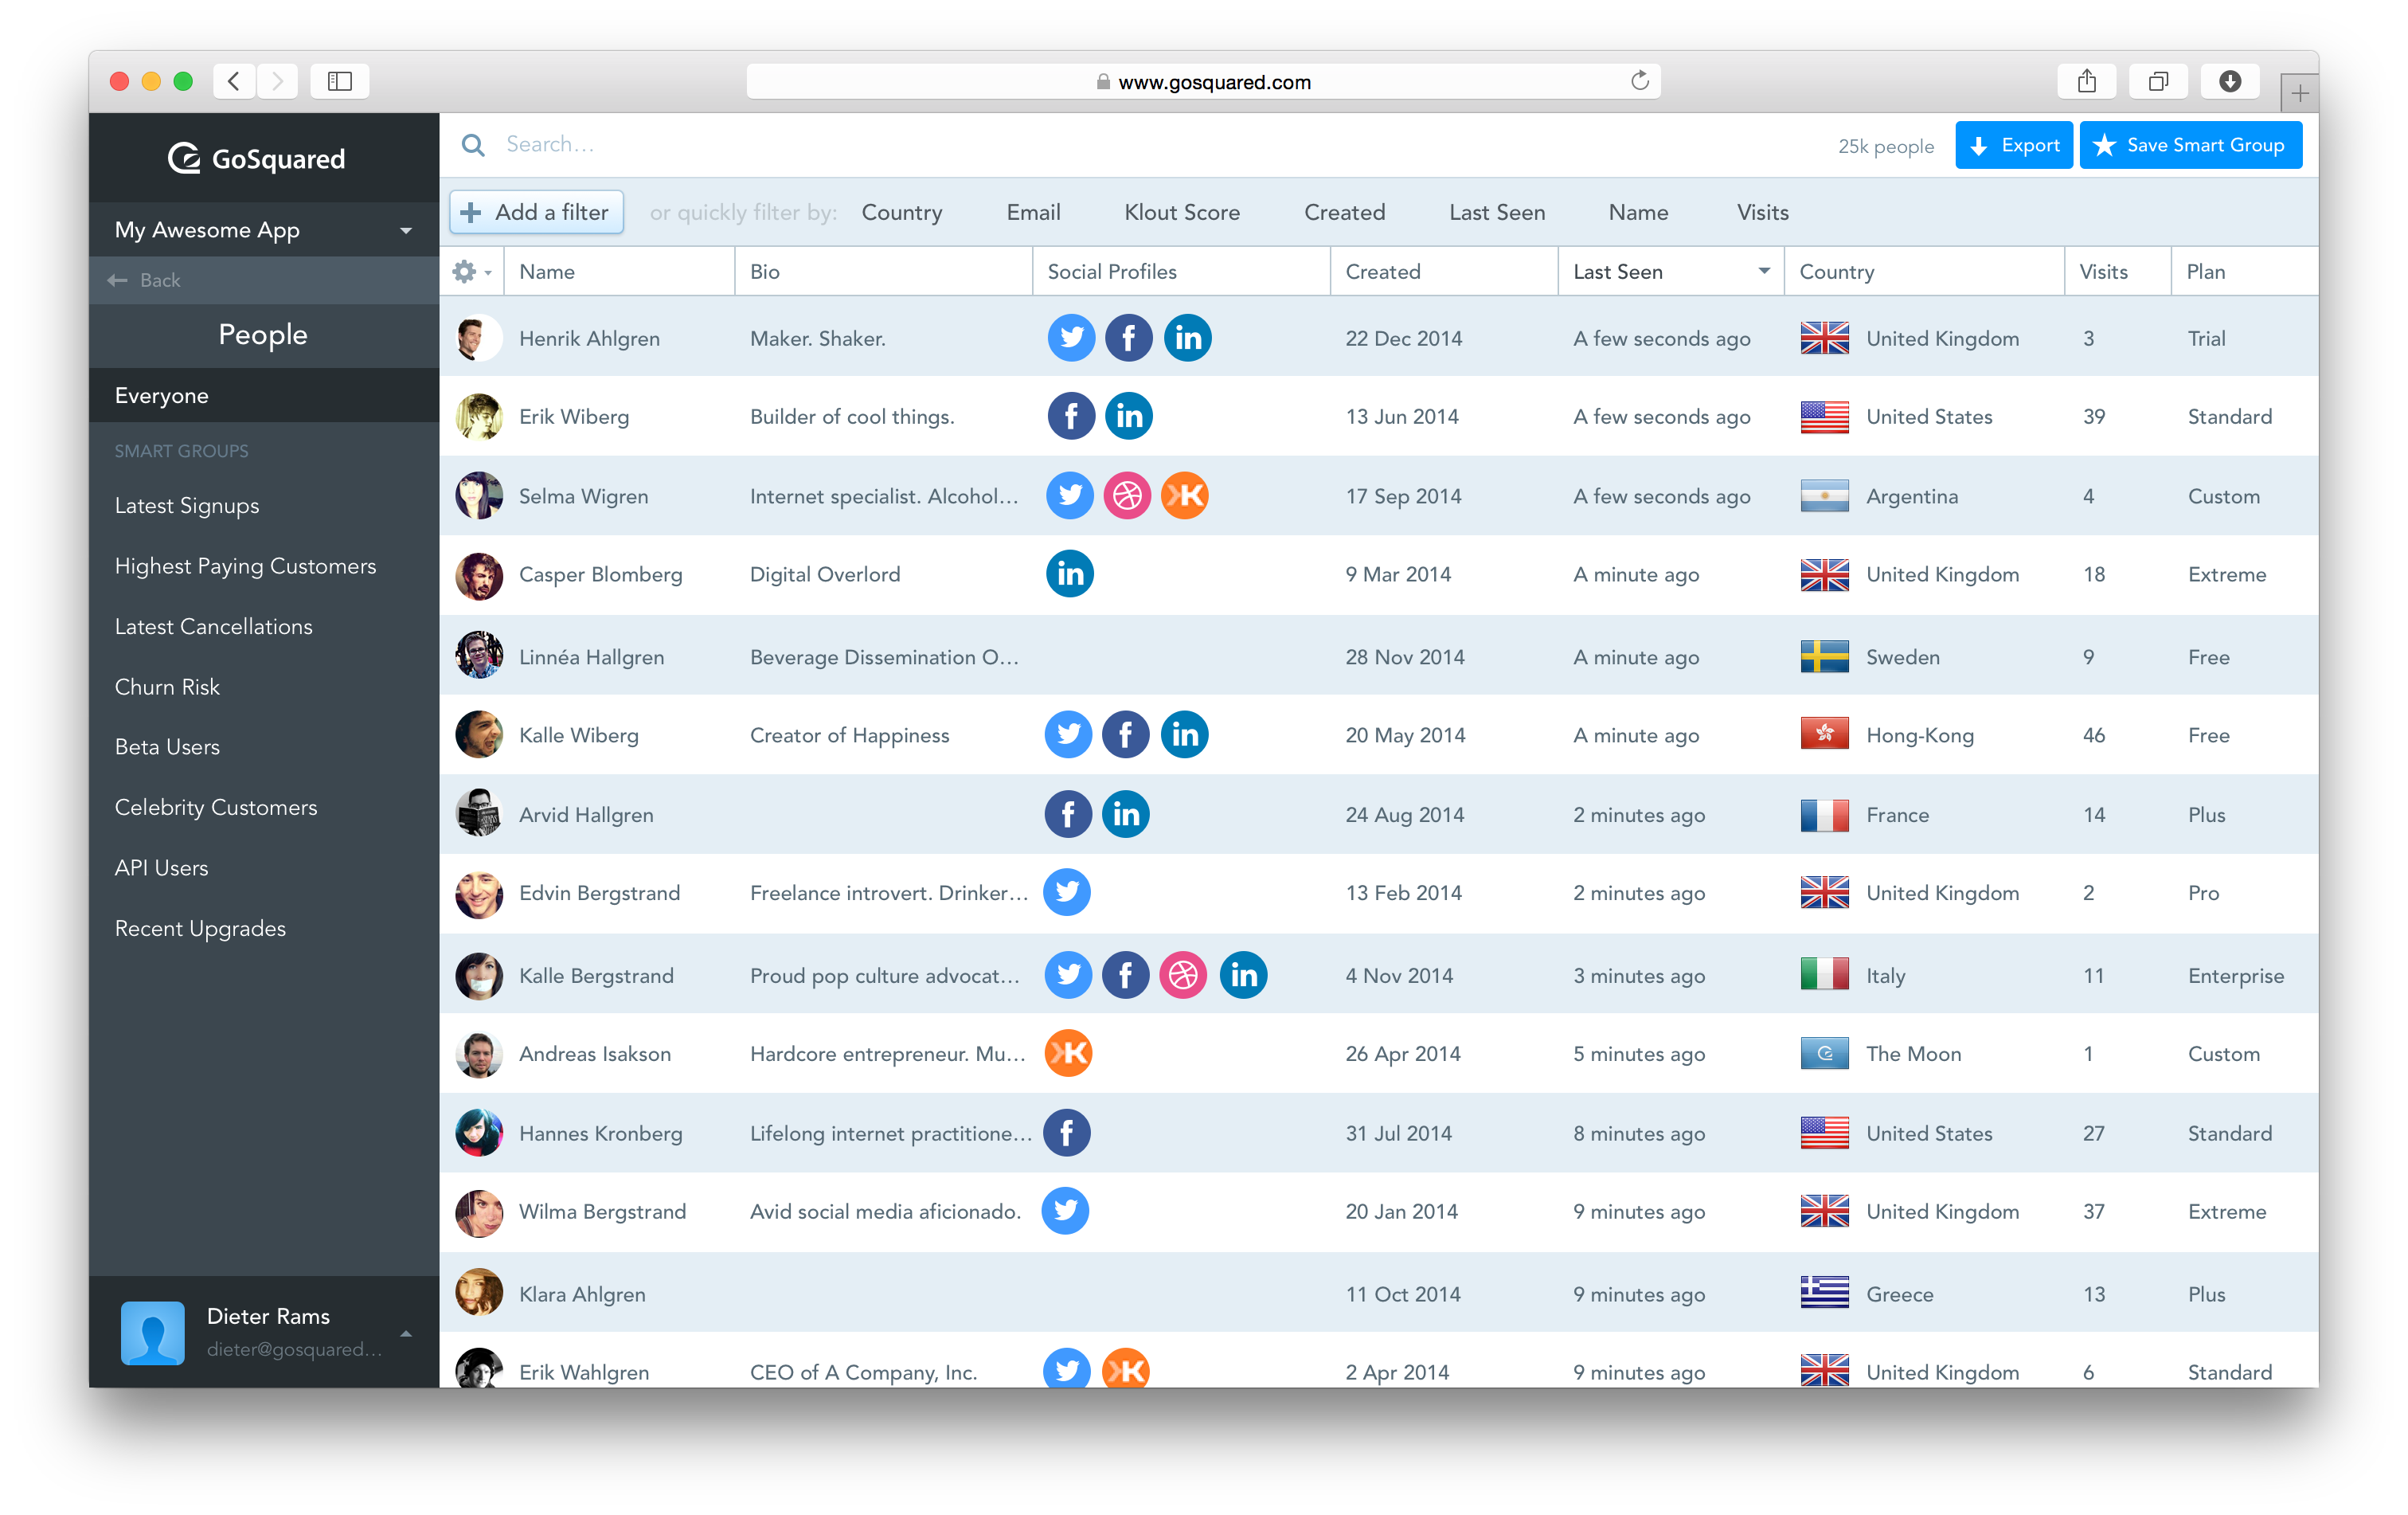
GoSquared Suite - The most popular GoSquared plan, full access to our real time analytics dashboards, intelligent live chat and customer data hub.
$79
Month [Unlimited Users]
No answers on this topic
Offerings
Pricing Offerings
GoSquared
Parse.ly
Free Trial
Yes
Yes
Free/Freemium Version
Yes
No
Premium Consulting/Integration Services
Yes
Yes
Entry-level Setup Fee
No setup fee
Required
Additional Details
GoSquared Free, track up to 1000 pageviews a month. GoSquared Analytics, track up to 100k pageviews a month with pricing starting at £29/month. GoSquared Suite, track up to 100k pageviews a month with pricing starting at £79/month.
—
More Pricing Information
Community Pulse
GoSquared
Parse.ly
Features
GoSquared
Parse.ly
Web Analytics
Comparison of Web Analytics features of Product A and Product B
1) Maintaining customer relationships - GS just makes it so easy to respond to our users who use our product more from a tactical point of view 2) Onboarding - I think it's more or less an extension of the first point above but GS does make it easy for us to onboard new clients who are sort of beginners.
Parse.ly is a great tool for publishers who want to track engagement and audience behaviour across websites. With Parse.ly, we can easily track metrics like pageviews, time spent on page, and scroll depth to see which content is resonating with our audience and optimize our content strategy accordingly. Our marketers found Parse.ly to be an excellent tool for tracking the effectiveness of our campaigns. We can use Parse.ly to track metrics like referral sources, conversion rates, and engagement by audience segment to see which channels and tactics are driving the most engagement and conversions.
Not only does the GoSquared application work well, the GoSquared team is constantly making improvements. When I first started using GoSquared, they only offered daily reporting -- now they offer the weekly and monthly feature per popular request. I like that they are always updating the look and feel of the website and emails they send to maintain a modern look. GoSquared is easy to implement and easy to use!
As an employee, this is difficult for me to comment as I am not directly funding or making these business decisions. However, it is a tool many get on with for surface level data that is useful to editorial teams.
The Parse.ly platform is very user-friendly and easy to use. User management is simple, and reporting setup only takes a few minutes. They provide very helpful documentation for implementing the scripts on your site and have great customer support to help with custom development such as implementing their content recommendation engine.
I rate this question this way solely because I haven't requested any support. I feel where I will eventually get support would be when we take Parse.ly up on some training that is being offered. We are looking to do that at some point after the first of the year and when our schedules support it.
Google Analytics is massively bloated and can be difficult to configure, navigate and understand. While GoSquared doesn't provide the feature set that Google Analytics does it focuses on providing the best experience for the features it does offer. If you just want to know who is visiting your website and when then GoSquared is a simple way of tracing this information.
Parse.ly does pretty well compared to Chartbeat, particularly when it comes to historical information and analysis options that are easy for employees to use after some short training. The onboarding for Parse.ly is intuitive, and the scheduled reports take away basically all of the inconvenience associated with regular metrics reviewing. But Chartbeat wins in its social audience tracking because it can source traffic to a specific social post, which can show you exactly how your audience is coming to your content and where you need to put your content to be sure you get that audience.
GoSquared helps us to react quickly to high volumes of traffic, and allows us to identify very quickly how engaging our content is
Using browser specs helps us to ensure our websites are compatible with as many of our customers as possible, rather than relying on generic global stats
Sometimes in meetings our editorial director will point out stories that didn't perform well. To us, that means readers don't really care about the topic, so we'll pivot away from writing about that in the future. That might not be "business objectives" though.