LogicMonitor’s SaaS-based platform, LM Envision, enables observability across on-prem and multi-cloud environments. It provides IT and business teams operational visibility and predictability across their technologies and applications.
N/A
Redgate Monitor
Score 8.0 out of 10
N/A
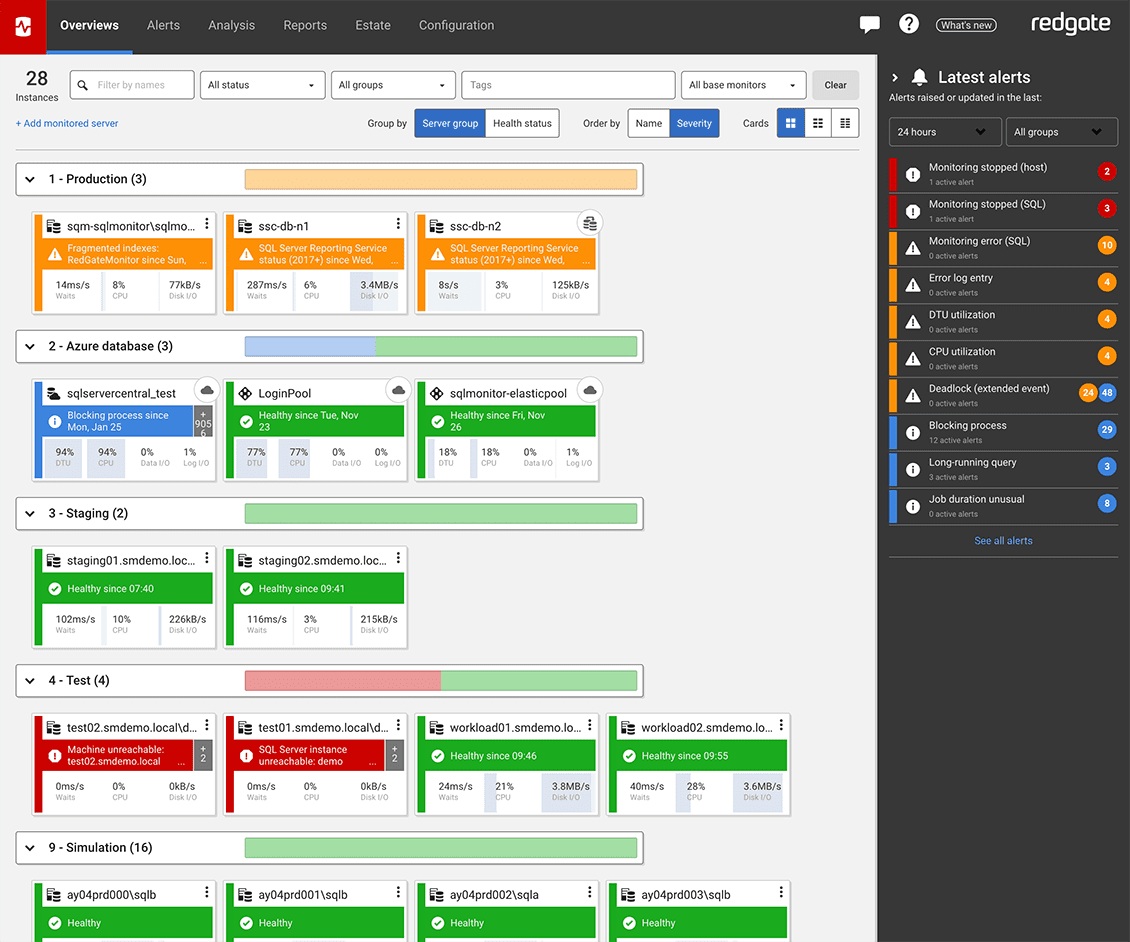
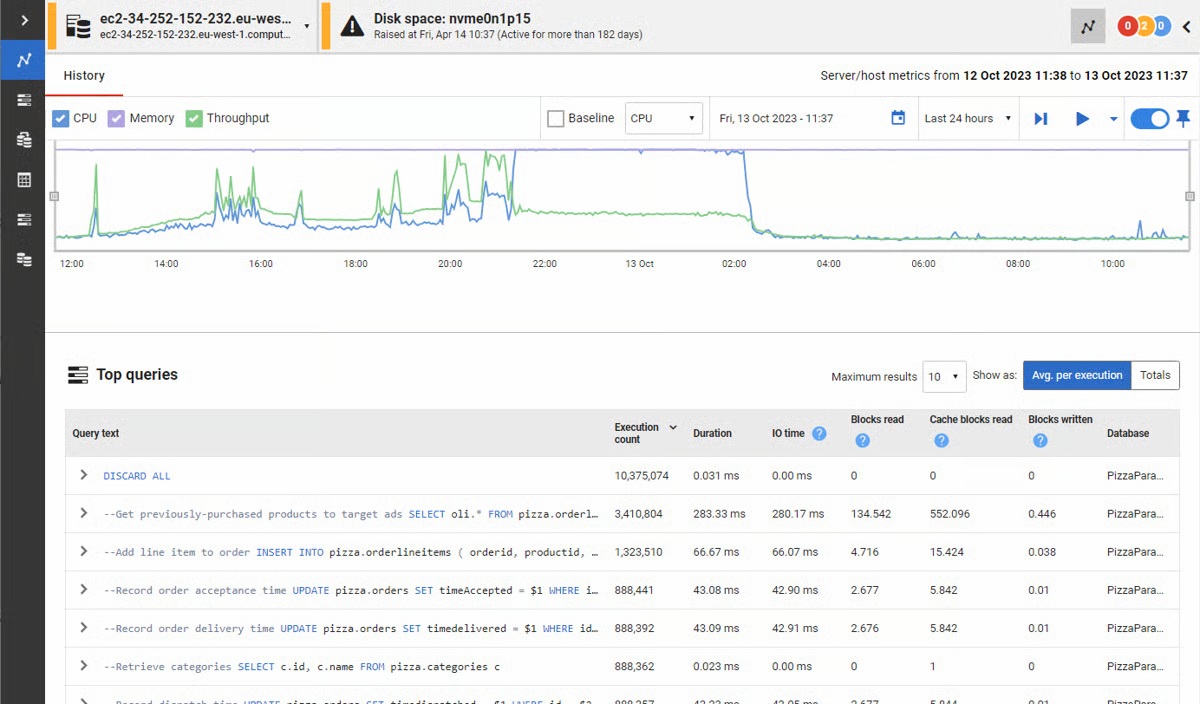
Redgate’s SQL Monitor helps teams looking after SQL servers be more proactive. SQL Monitor enables monitoring environments custom to the user’s SQL server to recognize issues before they impact users. It supports monitoring on-premises and cloud-based servers from a single interface.
$1,164
per year per server
Pricing
LogicMonitor
Redgate Monitor
Editions & Modules
Enterprise
Contact sales team
Website Monitoring
Contact sales team
No answers on this topic
Offerings
Pricing Offerings
LogicMonitor
Redgate Monitor
Free Trial
Yes
Yes
Free/Freemium Version
No
No
Premium Consulting/Integration Services
Yes
Yes
Entry-level Setup Fee
No setup fee
Optional
Additional Details
Our platform is broken down into Pro and Enterprise Pricing. Pro includes monitoring for all of your cloud, hybrid, and on-premises infrastructure. Our Enterprise package includes all of this, plus our AIOps and Machine Learning functionality that provides dynamic thresholds, root cause analysis, anomaly detection and more!
LogicMonitor only charges by the device. What is considered a device? A device is anything with an IP address that you want to monitor, including a physical device or a cloud resource. This means multiple data sources under the same IP address can be monitored for the same price. Unlike some monitoring platforms. we don’t charge per node, interface, or metric.
All prices are per server and include one year’s support and upgrades.
For being a product that can monitor a wide variety of resource types it is a strong tool. It just breaks down against some of the more in depth database monitoring tools that we need in the DBA team. We need more detail tracking on SPIDs and query level analysis and this is …
I would recommend LogicMonitor to mid-sized IT teams or MSPs. I thought it was going to be just another monitoring tool, but the more you work with it, the more you realize how solid it actually is; now it's a full-on platform. I've had a really good experience with Logic Monitor. It's powerful, a little messy in Parts. But once it's running smoothly, it's kind of a beast, definitely made my life easier.
With mission-critical SQL Server instances at multiple physical locations and in the cloud, it's critical for us to know immediately when there are performance issues or outages. The Redgate SQL Monitor provides an intuitive dashboard that allows for detailed resource monitoring. Perhaps not as useful in a 100% managed SQL environment.
Openness - They are too attached to their Intellectual Property to the detriment of usability, stability and reliability. So once its is installed and working leave it alone. Best run it on a VM as that can be restored quickly for when it breaks.
If they exposed an API/SDK that allowed you to leaver their products life would be far sweeter, it would feel less of a battle.
Add WebHooks to SQL Monitor to enhance integration to other subsystems.
Make it easy to install in default mode. So you are not forced to use TomCat Use as ASP.Core Selfl Hosting options.
This product has met virtually all of our needs. It was easy to implement and has been simple to support. Customization has been intuitive with many options available. They keep adding features and expanding available options. The future of LogicMonitor looks even better than it is today which is very promising. The management and support teams at LogicMonitor are always helpful
Set up is super easy. Just stand up a small Linux or Windows server to act as a collector. There are no agents to install on monitored devices and all you need is SNMP or WMI access. When creating dashboards, all you have to do is find the widget on the device you want to show up and choose the menu option to add it.
In general, the Redgate dashboard is one of the most thorough yet intuitive products I've had the pleasure of using. Compared to other vendors in different verticals, the Redgate dashboard's deployment, configuration, monitoring, and reporting is second to none
The sales team support we received was top notch. They worked hand in hand to make sure the product met all expectations. So far we have not really had to work with support that much; we have worked with setup team after purchase to deploy product fully. No issues so far and we are four weeks in.
The implementation experience was awesome for me, as the LogicMonitor team was really helpful to us. They installed everything on our primary server and provided clear, intelligible explanations. They even trained our non-tech team on it as well. Therefore, my team and I had a very simple and pleasurable implementation experience.
Our business used the trial period they provided on one of our systems and conducted sessions with all of this software. Our team tested all of these software options before deciding on LogicMonitor, as our business is expanding daily and we needed a system that could accommodate our growing workforce and automatically add systems to our network, which LogicMonitor alone provided.
Pricing seems to be getting more and more aggressive, I worry that it's going to turn into ServiceNow or SAP and everything minor feature will be an extreme cost that prices out us and our customers
Haven't really used it but our initial onboarding PS was disappointing. Felt like we were being told what we needed to cover as opposed to what we wanted to cover. In addition, we were pushed into using the PS in tight time frames and we were not ready to do so.