TrustRadius: an HG Insights company

LogicMonitor vs. SolarWinds Database Performance Monitor

Save this comparison

Save this comparison

Add Product

Recommended Comparisons

    Overview
    ProductRatingMost Used ByProduct SummaryStarting Price

    LogicMonitor

    Score8.9 out of 10
    Mid-Size Companies (51-1,000 employees)
    LogicMonitor’s SaaS-based platform, LM Envision, enables observability across on-prem and multi-cloud environments. It provides IT and business teams operational visibility and predictability across their technologies and applications.N/A

    SolarWinds Database Performance Monitor

    Score9 out of 10
    N/AVividCortex, acquired by SolarWinds in December 2019, provides database performance monitoring designed to increase system performance, team efficiency, and infrastructure cost savings. The GDPR- and SOC 2-compliant platform offers visibility into major open-source databases—MySQL, PostgreSQL, Amazon Aurora, MongoDB, and Redis—for the engineering team at scale. Industry leaders like Etsy, GitHub, SendGrid, and Yelp rely on Database Performance Monitor for all-query monitoring and drill…N/A
    Pricing
    LogicMonitorSolarWinds Database Performance Monitor
    Editions & Modules
    Enterprise
    Contact sales team
    Website Monitoring
    Contact sales team
    No answers on this topic
    Offerings
    Pricing Offerings
    LogicMonitorSolarWinds Database Performance Monitor
    Free Trial
    YesYes
    Free/Freemium Version
    NoNo
    Premium Consulting/Integration Services
    YesYes
    Entry-level Setup FeeNo setup feeNo setup fee
    Additional DetailsOur platform is broken down into Pro and Enterprise Pricing. Pro includes monitoring for all of your cloud, hybrid, and on-premises infrastructure. Our Enterprise package includes all of this, plus our AIOps and Machine Learning functionality that provides dynamic thresholds, root cause analysis, anomaly detection and more! LogicMonitor only charges by the device. What is considered a device? A device is anything with an IP address that you want to monitor, including a physical device or a cloud resource. This means multiple data sources under the same IP address can be monitored for the same price. Unlike some monitoring platforms. we don’t charge per node, interface, or metric.—
    More Pricing Information
    Community Pulse
    LogicMonitorSolarWinds Database Performance Monitor
    Considered Both Products
    LogicMonitor
    No answer on this topic
    SolarWinds
    No answer on this topic
    Key User Insights
    Would buy again
    97%
    Would buy again
    91 Answers
    No answers on this topic
    Delivers good value for the price
    98%
    Delivers good value for the price
    84 Answers
    No answers on this topic
    Happy with the feature set
    97%
    Happy with the feature set
    91 Answers
    No answers on this topic
    Lived up to sales and marketing promises
    95%
    Lived up to sales and marketing promises
    77 Answers
    No answers on this topic
    Implementation went as expected
    93%
    Implementation went as expected
    81 Answers
    No answers on this topic
    Features
    LogicMonitorSolarWinds Database Performance Monitor
    Monitoring Tasks
    Comparison of Monitoring Tasks features of LogicMonitor and SolarWinds Database Performance Monitor
    Feature
    LogicMonitor
    7.1
    2 Ratings
    18% below category average
    SolarWinds Database Performance Monitor
    -
    Ratings
    Remote monitoring7.12 Ratings00 Ratings
    Best Alternatives
    LogicMonitorSolarWinds Database Performance Monitor
    Small Businesses
    Amazon CloudWatch
    Score7.8 out of 10
    No answers on this topic
    Medium-sized Companies
    Datadog
    Score8.8 out of 10
    SolarWinds Database Performance Analyzer
    Score5.6 out of 10
    Enterprises
    ManageEngine Site24x7
    Score10 out of 10
    Foglight
    Score10 out of 10
    All AlternativesView all alternativesView all alternatives
    User Ratings
    LogicMonitorSolarWinds Database Performance Monitor
    Likelihood to Recommend
    8.9
    (182 ratings)
    9.0
    (2 ratings)
    Likelihood to Renew
    8.0
    (9 ratings)
    -
    (0 ratings)
    Usability
    7.3
    (31 ratings)
    9.0
    (1 ratings)
    Availability
    9.1
    (1 ratings)
    -
    (0 ratings)
    Performance
    9.1
    (1 ratings)
    -
    (0 ratings)
    Support Rating
    6.0
    (110 ratings)
    -
    (0 ratings)
    In-Person Training
    8.2
    (1 ratings)
    -
    (0 ratings)
    Online Training
    7.3
    (1 ratings)
    -
    (0 ratings)
    Implementation Rating
    9.0
    (27 ratings)
    -
    (0 ratings)
    Configurability
    9.1
    (1 ratings)
    -
    (0 ratings)
    Contract Terms and Pricing Model
    7.4
    (5 ratings)
    -
    (0 ratings)
    Ease of integration
    7.3
    (1 ratings)
    -
    (0 ratings)
    Product Scalability
    9.1
    (1 ratings)
    -
    (0 ratings)
    Professional Services
    7.6
    (4 ratings)
    -
    (0 ratings)
    Vendor post-sale
    9.1
    (1 ratings)
    -
    (0 ratings)
    Vendor pre-sale
    9.1
    (1 ratings)
    -
    (0 ratings)
    User Testimonials
    LogicMonitorSolarWinds Database Performance Monitor
    Likelihood to Recommend
    LogicMonitor
    For environments that mostly use VMs and baremetal devices, LogicMonitor is a fantastic choice. It lends itself especially well to situations where you want individual teams to be able to manage the monitoring and observability of their own domains, and if you take the time to customize it to your environment in the frontend, you can get to the point where your LogicMonitor platform administrators are very rarely needed.
    Incentivized
    Read full review
    SolarWinds
    Computing resources consumed by the DB instance, DPA queries & wait time, deadlock conditions, virtual infrastructure resources. The addition of NPM & DPA integration as well as cross-correlation in the identification of issues with the network or server or DB is all stupid-proof. Monitoring is more than just health and resource consumption, it's also performance. DB performance analysis is key to maintaining healthy DB instances.
    Incentivized
    Read full review
    Pros
    LogicMonitor
    • It shows us system issues right away so we can fix them fast.
    • It finds new devices on its own, so we do not miss anything.
    • It alerts us only when something really unusual happens.
    • Its dashboards make it easy for everyone to see system health.
    • It helps us see trends so we are ready for busy times.
    Incentivized
    Read full review
    SolarWinds
    • Simple to use and very easy to learn.
    • The execution engines run in parallel, can execute any syntax or query.
    • DPN can run all queries for both Oracle and SQL with no additional support.
    Incentivized
    Read full review
    Cons
    LogicMonitor
    • Segmentation at an instance level not just the resource when clients are sharing the same device but shouldn't see each other's relevant data
    • ARM CPU support for collectors to allow for a lighter weight appliance deployment
    • WMI collection with a Linux collector so a windows collector would not be needed or a virtual appliance template that can be used to deploy collectors
    Incentivized
    Read full review
    SolarWinds
    • The Reporting feature currently doesn't allow customization.
    Incentivized
    Read full review
    Likelihood to Renew
    LogicMonitor
    This product has met virtually all of our needs. It was easy to implement and has been simple to support. Customization has been intuitive with many options available. They keep adding features and expanding available options. The future of LogicMonitor looks even better than it is today which is very promising. The management and support teams at LogicMonitor are always helpful
    Incentivized
    Read full review
    SolarWinds
    No answers on this topic
    Usability
    LogicMonitor
    Set up is super easy. Just stand up a small Linux or Windows server to act as a collector. There are no agents to install on monitored devices and all you need is SNMP or WMI access. When creating dashboards, all you have to do is find the widget on the device you want to show up and choose the menu option to add it.
    Incentivized
    Read full review
    SolarWinds
    I would say it is a very good tool from overall perspective compared to what I have used till now, still I will give it like 9 just for the sake of the interface and the integration which they should be doing soon with the main module which is SAM , NPM etc.
    Incentivized
    Read full review
    Support Rating
    LogicMonitor
    The sales team support we received was top notch. They worked hand in hand to make sure the product met all expectations. So far we have not really had to work with support that much; we have worked with setup team after purchase to deploy product fully. No issues so far and we are four weeks in.
    Incentivized
    Read full review
    SolarWinds
    No answers on this topic
    In-Person Training
    LogicMonitor
    Add good training
    Incentivized
    Read full review
    SolarWinds
    No answers on this topic
    Online Training
    LogicMonitor
    The training is good but room to improve
    Incentivized
    Read full review
    SolarWinds
    No answers on this topic
    Implementation Rating
    LogicMonitor
    The implementation experience was awesome for me, as the LogicMonitor team was really helpful to us. They installed everything on our primary server and provided clear, intelligible explanations. They even trained our non-tech team on it as well. Therefore, my team and I had a very simple and pleasurable implementation experience.
    Incentivized
    Read full review
    SolarWinds
    No answers on this topic
    Alternatives Considered
    LogicMonitor
    Our business used the trial period they provided on one of our systems and conducted sessions with all of this software. Our team tested all of these software options before deciding on LogicMonitor, as our business is expanding daily and we needed a system that could accommodate our growing workforce and automatically add systems to our network, which LogicMonitor alone provided.
    Incentivized
    Read full review
    SolarWinds
    SolarWinds DPA gives you a very deep analysis and monitoring of the devices which these tools will not give you neither Datadog or ManageEngine. It even gives you job rate , db locks and all other parameters to monitor which we usually do manually by going in to the DB and not from the tools. It also creates a dashboard out of the same.
    Incentivized
    Read full review
    Contract Terms and Pricing Model
    LogicMonitor
    Pricing seems to be getting more and more aggressive, I worry that it's going to turn into ServiceNow or SAP and everything minor feature will be an extreme cost that prices out us and our customers
    Incentivized
    Read full review
    SolarWinds
    No answers on this topic
    Professional Services
    LogicMonitor
    Haven't really used it but our initial onboarding PS was disappointing. Felt like we were being told what we needed to cover as opposed to what we wanted to cover. In addition, we were pushed into using the PS in tight time frames and we were not ready to do so.
    Incentivized
    Read full review
    SolarWinds
    No answers on this topic
    Return on Investment
    LogicMonitor
    • We Eliminated an on-prem monitoring tool which was in excess of 25 servers
    • A decrease in time to response from our Network Operations Center resulted in a more consistent client experience
    • Dynamic alert thresholds helped reduce alerting by about 10 to 15% as soon as we turned it on for volatile metrics like CPU and memory
    Incentivized
    Read full review
    SolarWinds
    • What is the cost of a downed DB instance? That's your ROI. DPM lets you see issues before they become critical.
    Incentivized
    Read full review
    ScreenShots

    LogicMonitor Screenshots

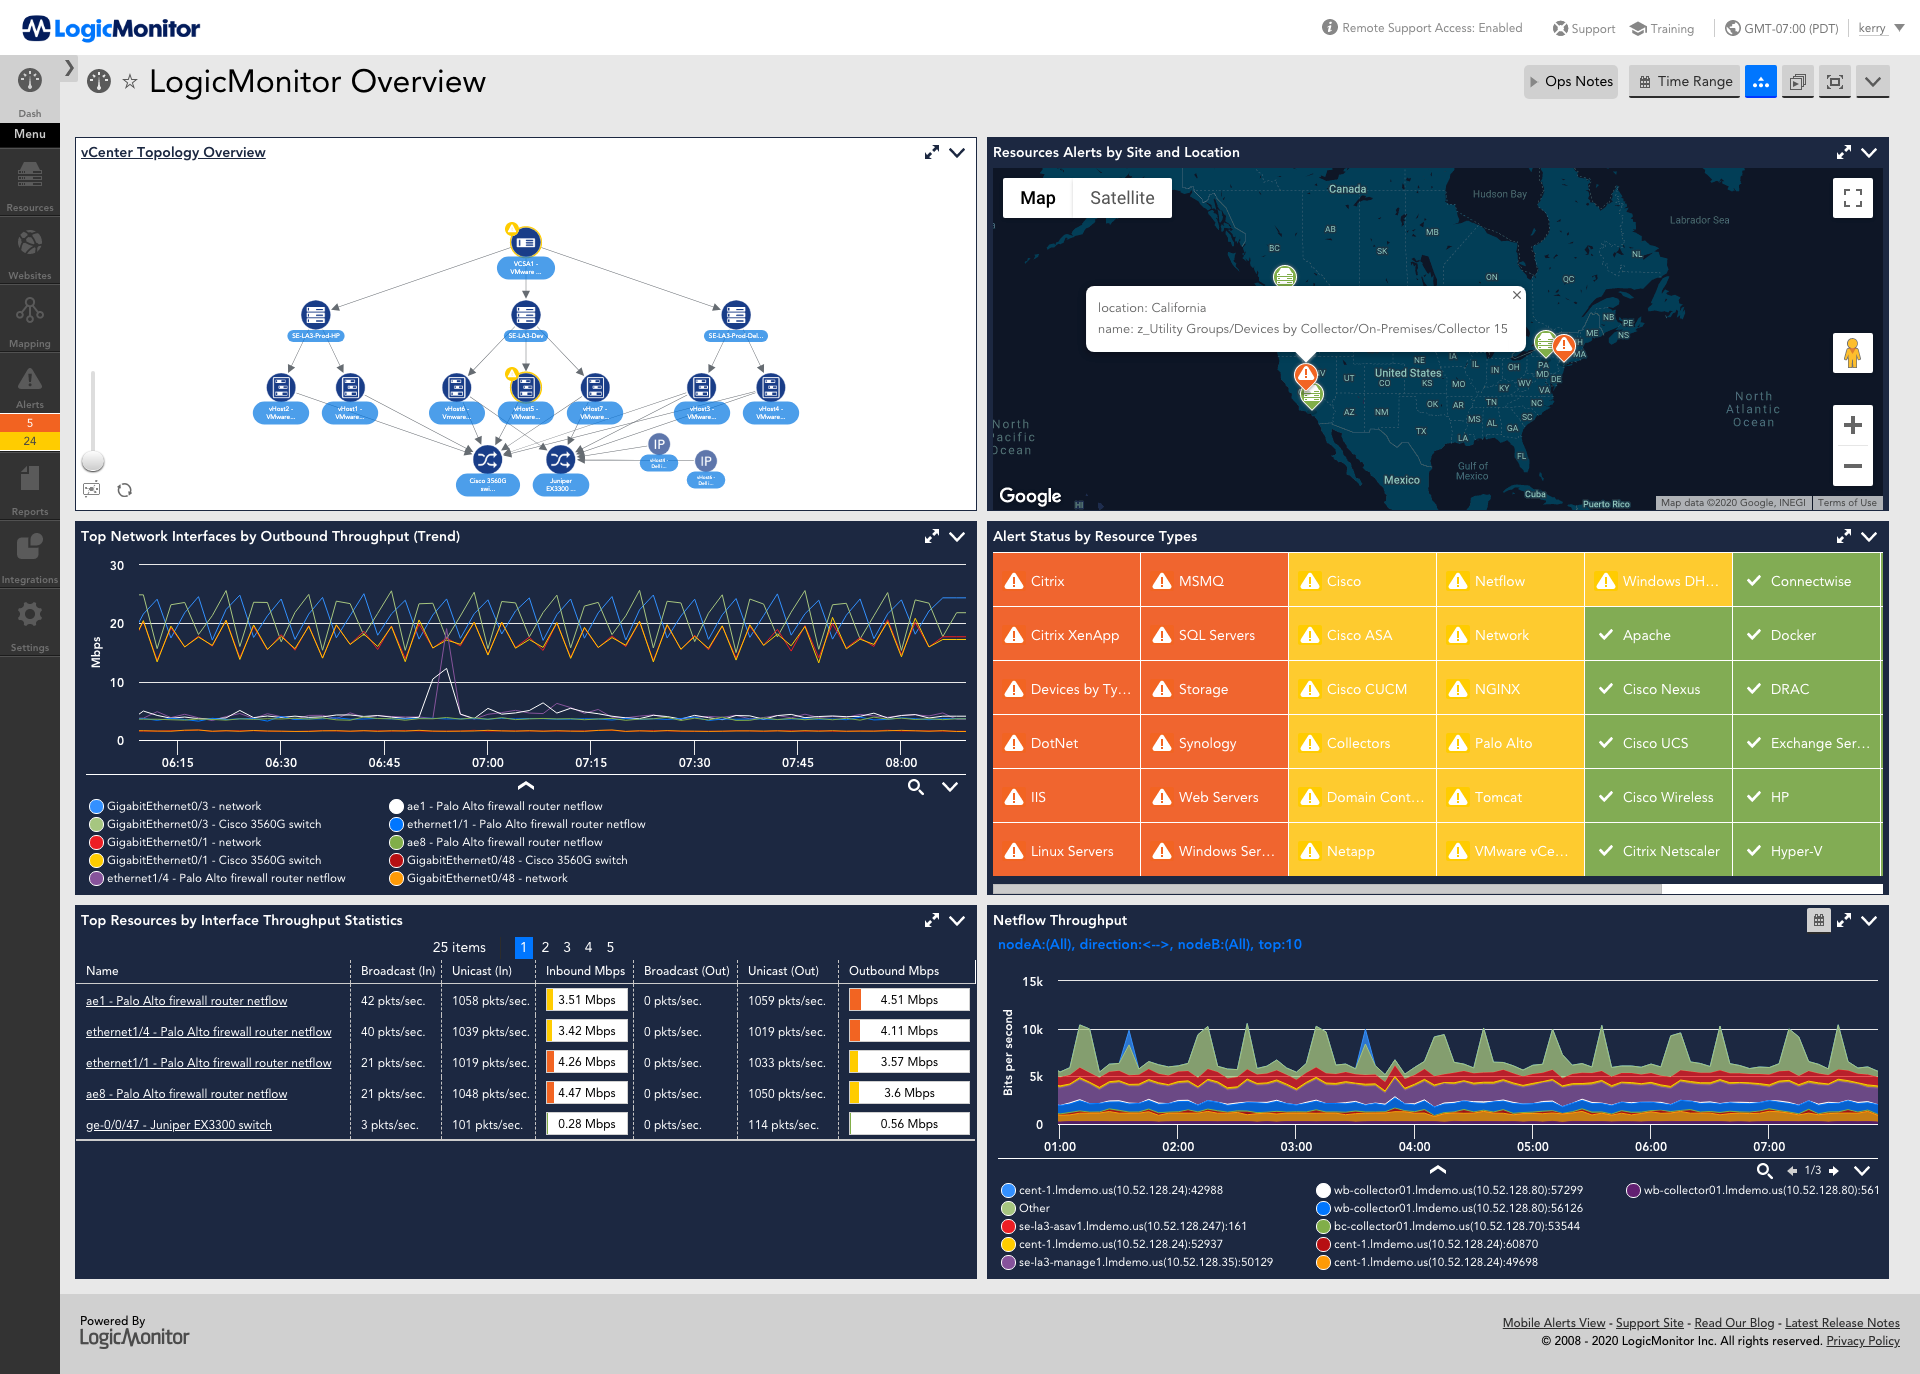
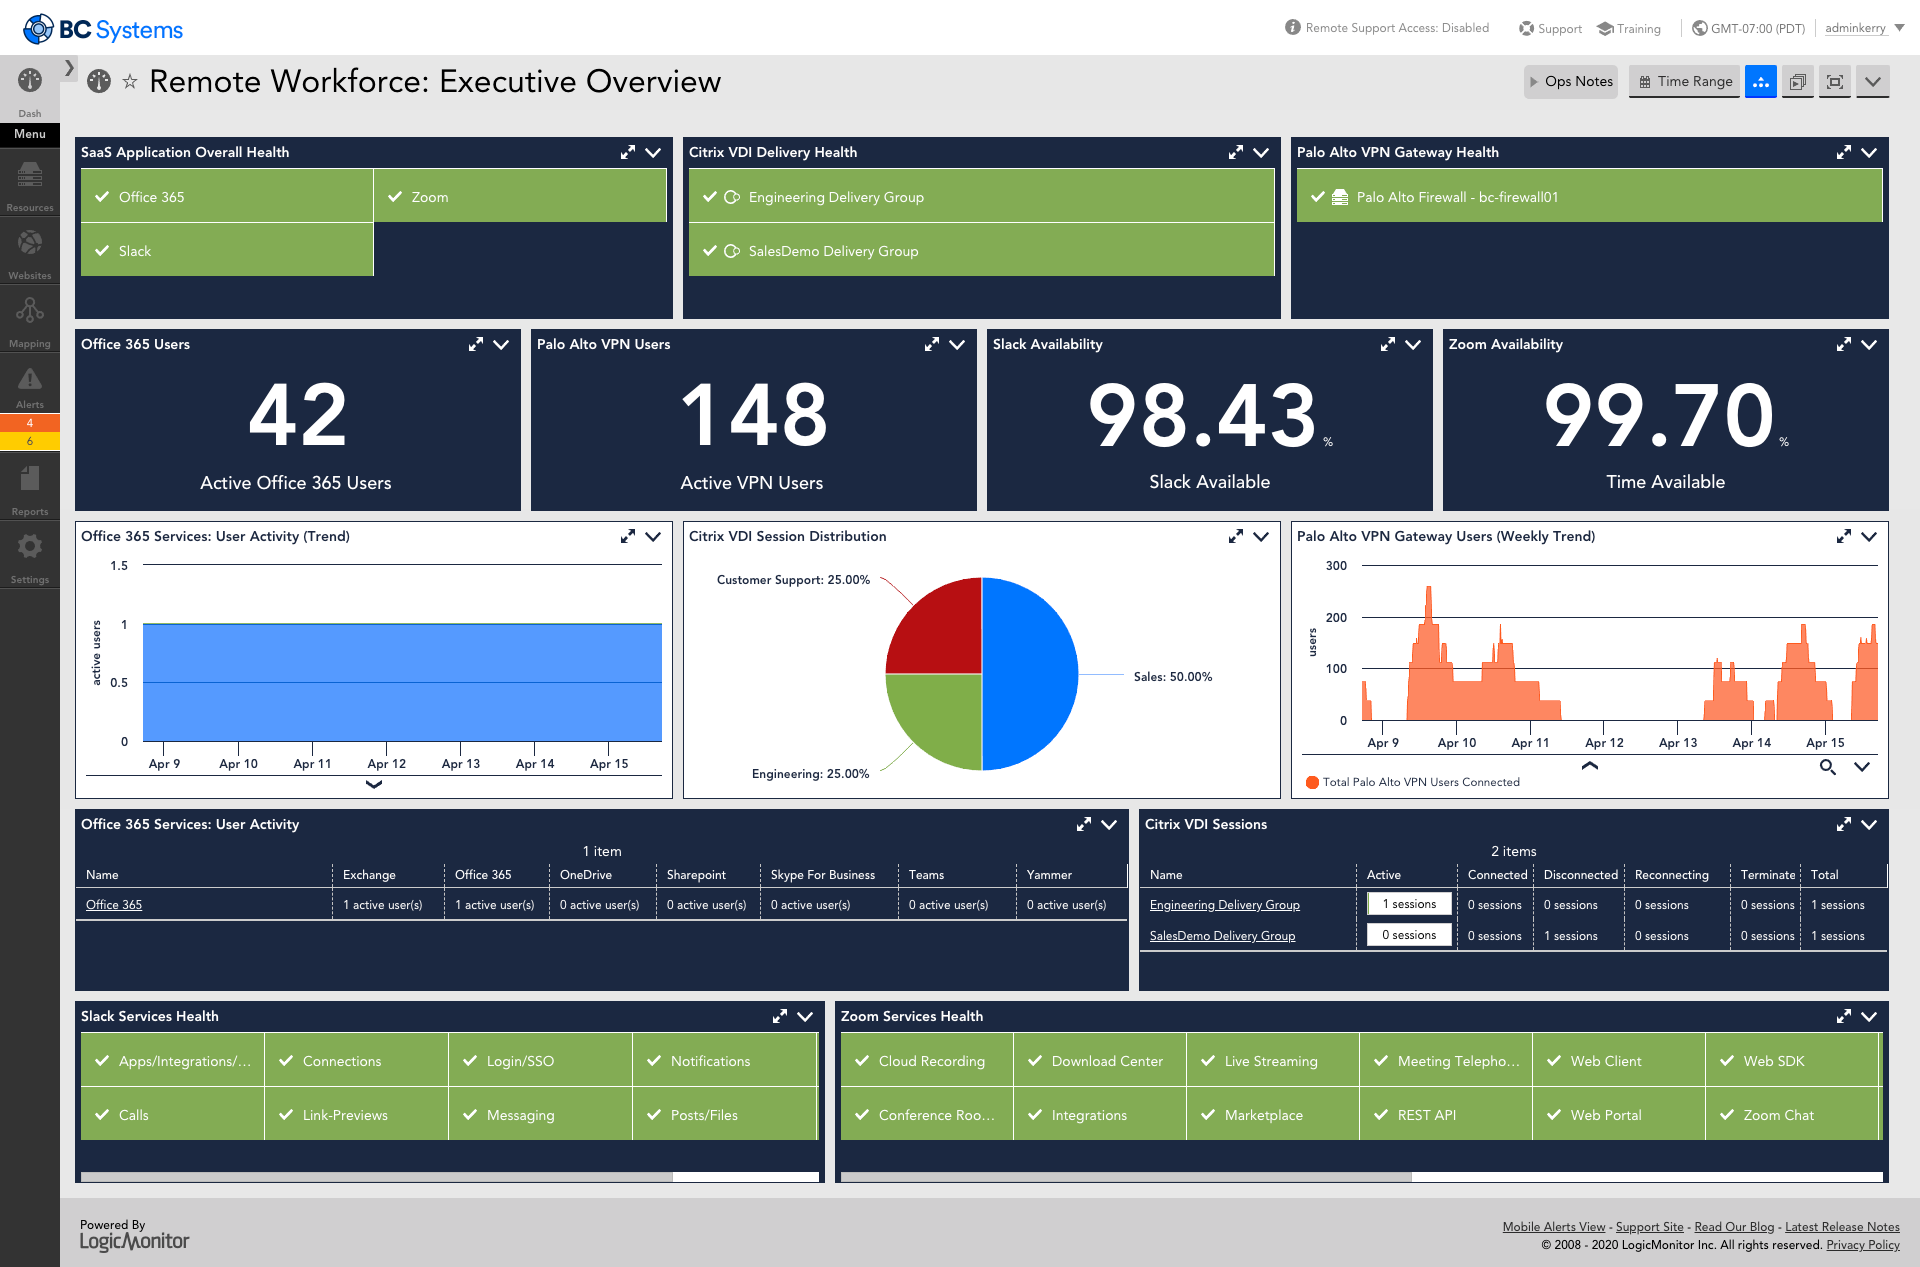
    Screenshot of AIOps features for enterprises using technology or hybrid environments with cloud and container resources. LogicMonitor can be used to monitor and improve the performance of complex enterprise networks with dynamic thresholds, topology mapping, anomaly detection, and root cause analysis.Screenshot of LM Envision's comprehensive monitoring and observability capabilities across the IT infrastructure, that help to identify alerts for the most important systems while ensuring the user experience is uninterrupted across the globe.Screenshot of Monitoring that ensures servers and the applications running on top of them are highly available. Helps resolve issues and optimize resource consumption for the server infrastructure.Screenshot of LogicMonitor remote workforce monitoring, which ensures that employees are connected to the systems that keep them productive and provide proactive insight into dispersed systems and third-party outages.Screenshot of Unified cloud monitoring across a hybrid multi-cloud ecosystem.Screenshot of LM Logs delivering log analysis at enterprise scale.

    SolarWinds Database Performance Monitor Screenshots

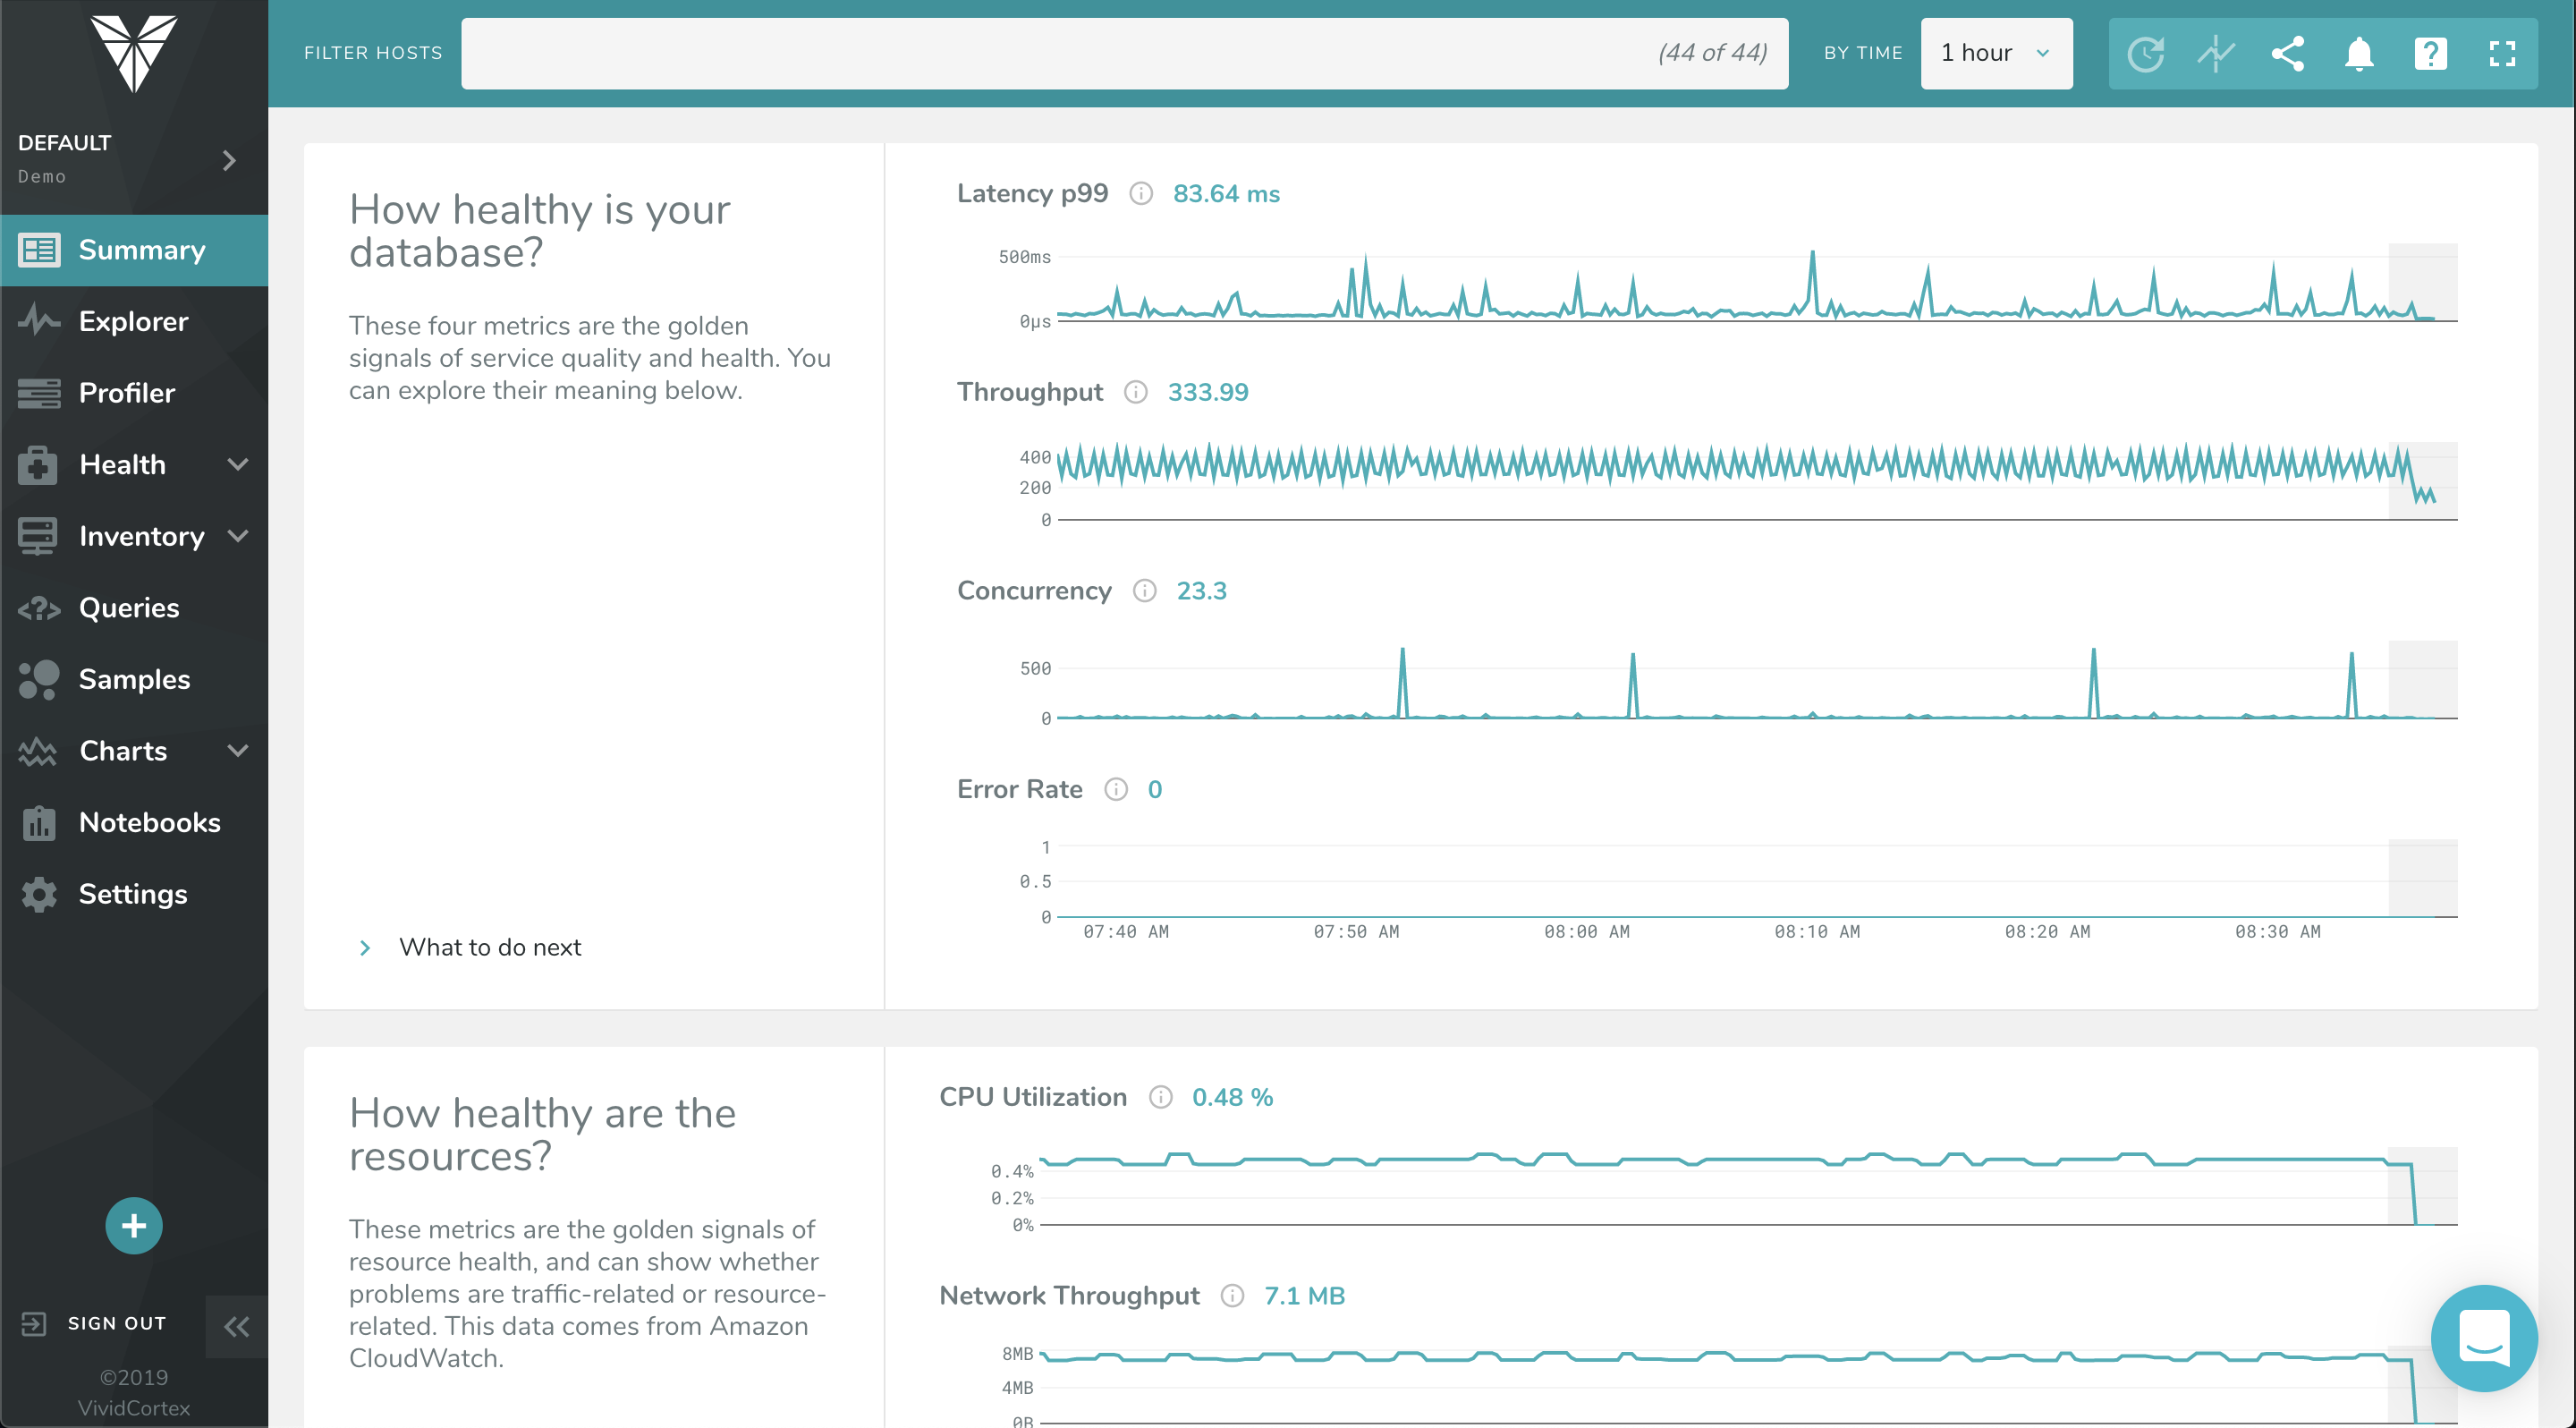
    Screenshot of The Profiler Dashboard is a powerful, dynamic dashboard for ranking and filtering activity on your servers: It can instantly show you what needs attention and it provides a unified view of all your database types that VividCortex monitors. It enables you to view and understand your system by profiling it according to its most significant attributes—customized and selected by you.Screenshot of This dashboard displays a list of queries and allows you to filter them with powerful specificity. Filters can be set according to query text, host, and timeframe when the query was first seen / last active.Screenshot of VividCortex captures an enormous amount of data, and the Summary Dashboard helps users make sense of it, reducing their time-to-insight. It features widgets with automatic displays for Top 5 Queries by Total Time, Top 5 Queries by User CPU, Application Overview, Critical Events, and more.Screenshot of VividCortex monitors thousands of metrics in your system, and the Charts and Dashboard’s navigation pane allows you to toggle, customize, and enable various categories of generated charts. You can then easily navigate and examine the charts’ metrics with mouseover and zoom capabilities.