New Relic is a SaaS-based web and mobile application performance management provider for the cloud and the datacenter. They provide code-level diagnostics for dedicated infrastructures, the cloud, or hybrid environments and real time monitoring.
$0
No credit card required; 100 GB free ingest per month, 1 free full user + unlimited basic users, 8 days retention, 100 Synthetics Checks
SonarQube
Score 7.8 out of 10
N/A
SonarQube is an automated code review solution, serving as the verification layer for code quality and SDLC security. SonarQube is used to ensure that code is secure, reliable, and maintainable. It is available through SaaS or self-managed deployment.
$0
Pricing
New Relic
SonarQube
Editions & Modules
Free (Forever)
$0
No credit card required; 100 GB free ingest per month, 1 free full user + unlimited basic users, 8 days retention, 100 Synthetics Checks
Telemetry Data Platform
$0.25
per month per extra GB data ingest (after first free 100GB per month)
Incident Intelligence
$0.50
per month per event (after first 1000 free events per month)
Standard
$99
per month per full user (after first free full user - unlimited free basic users)
New Relic its an excellent tool for monitoring services used on the SAAS universe, like web servers, relational and nosql dbms, reverse proxies, text databases, etc. Its also a powerful tool to monitor resource usage on said servers. However, its not well fitted to monitor custom services - if you need to generate alerts based on logs or database information, for example
SonarQube is excellent if you start using it at the beginning when developing a new system, in this situation you will be able to fix things before they become spread and expensive to correct. It’s a bit less suitable to use on existing code with bad design as it’s usually too expensive to fix everything and only allows you to ensure the situation doesn’t get worse.
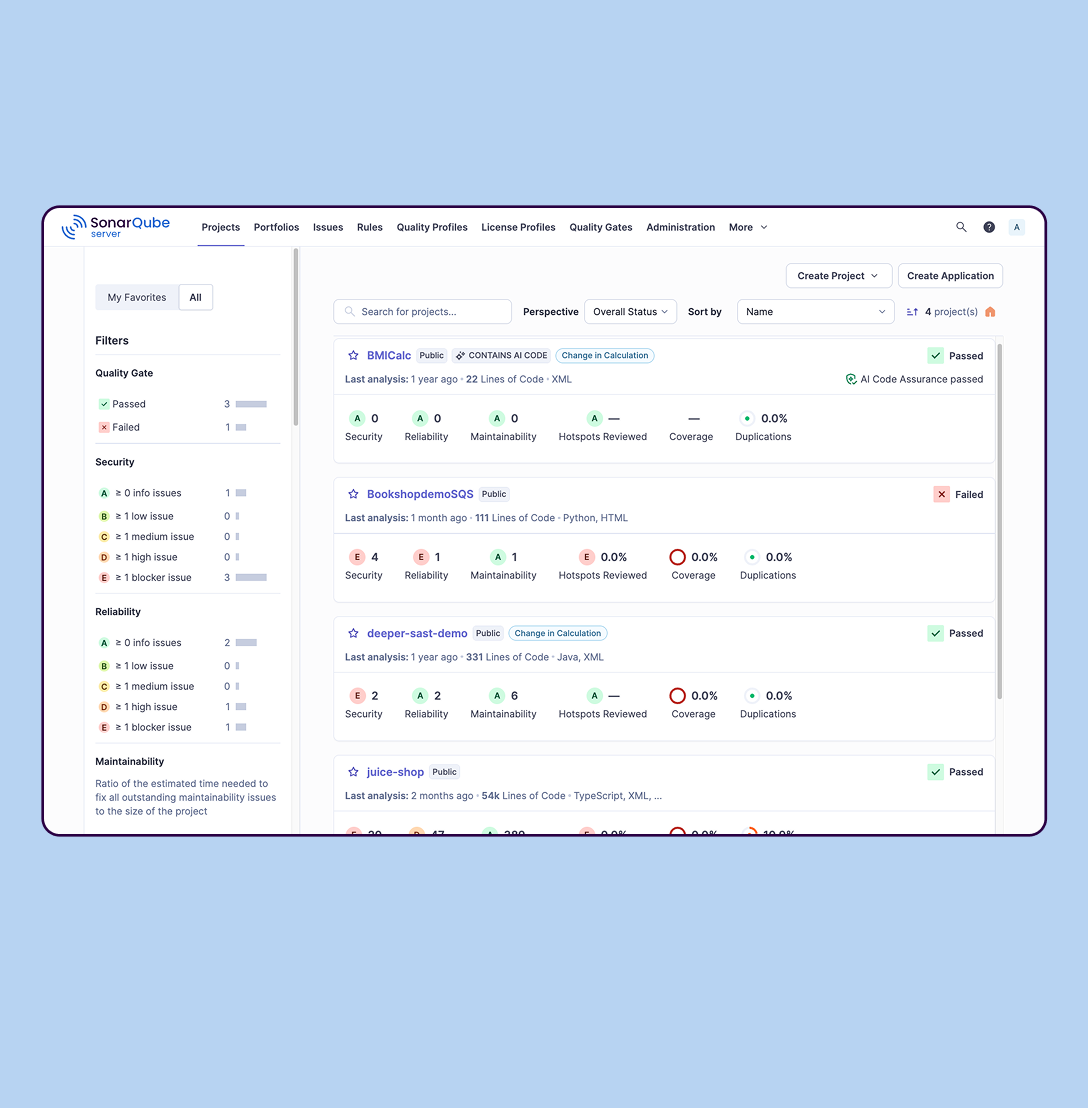
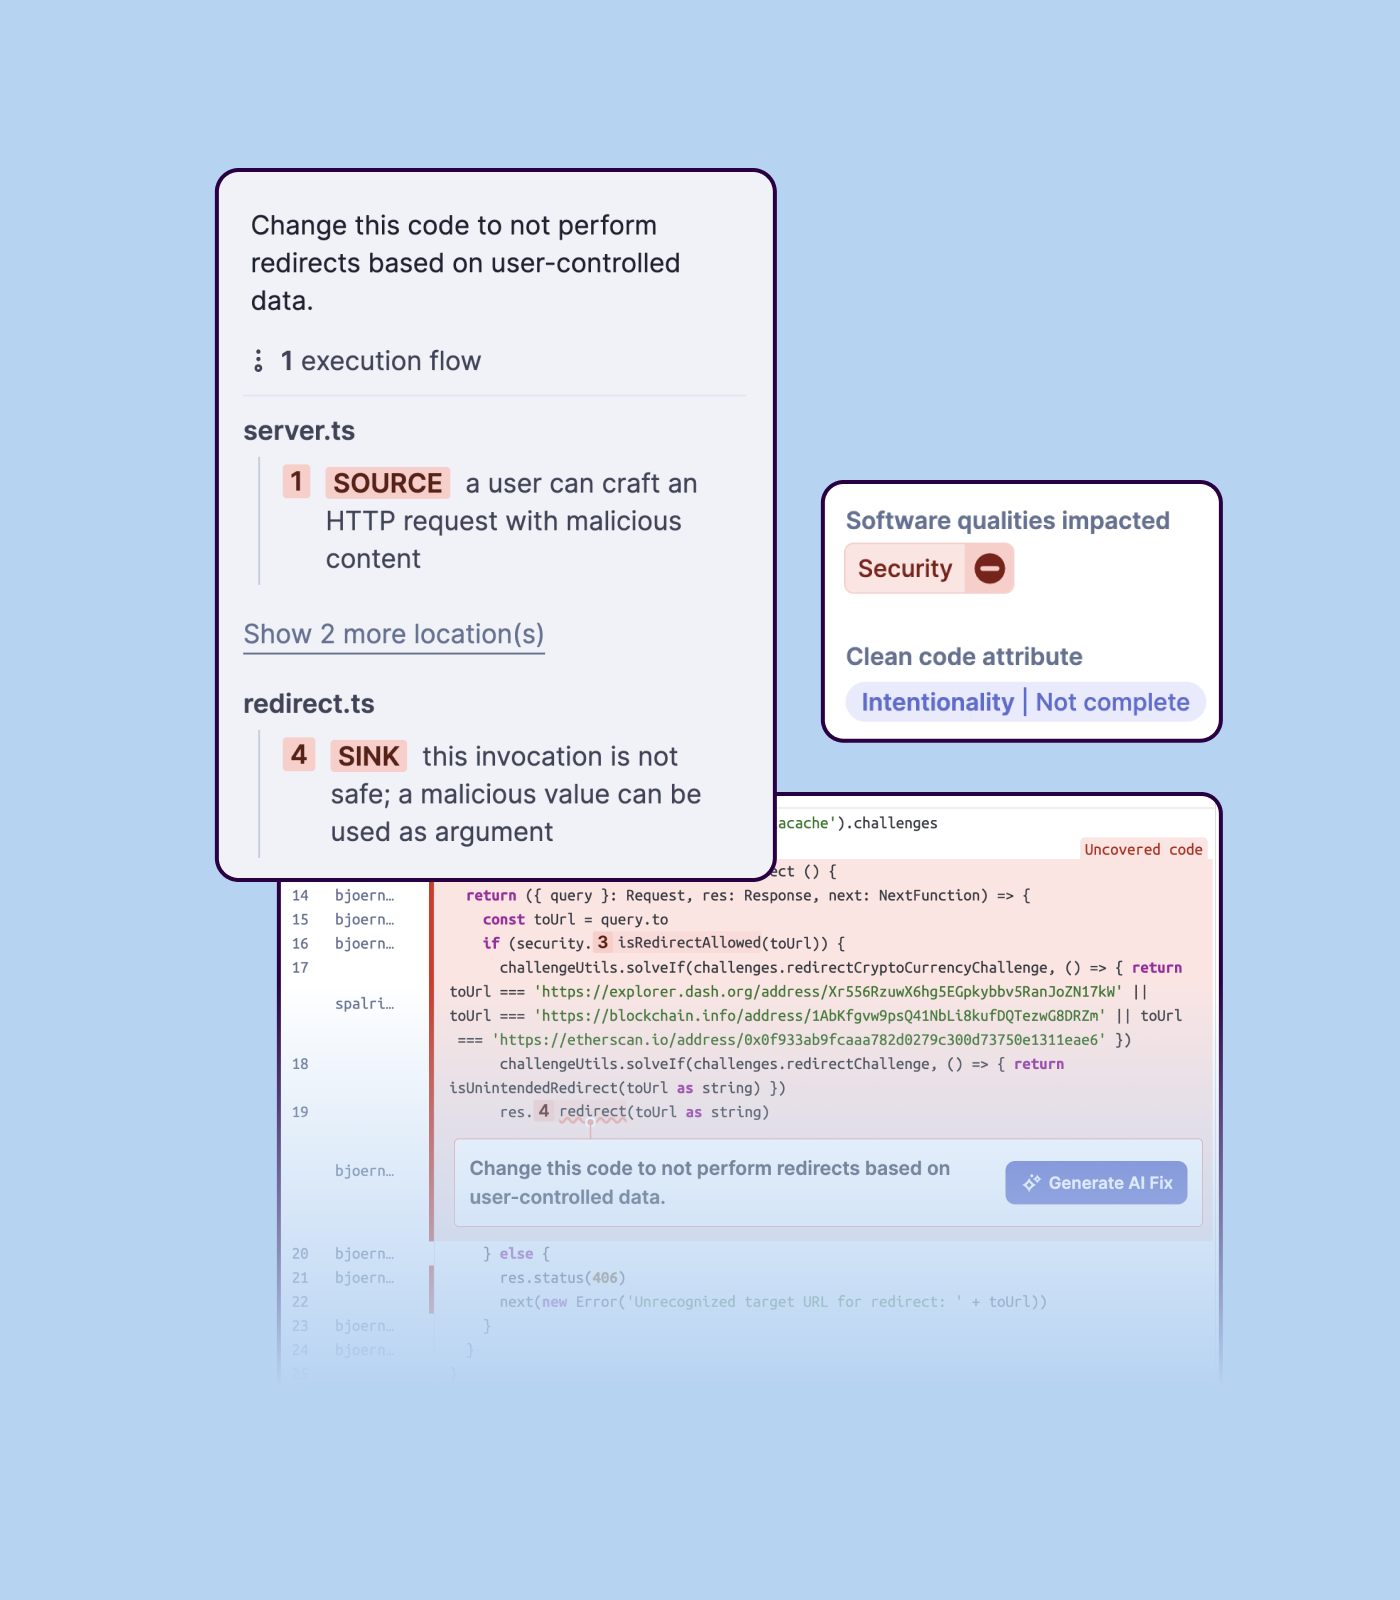
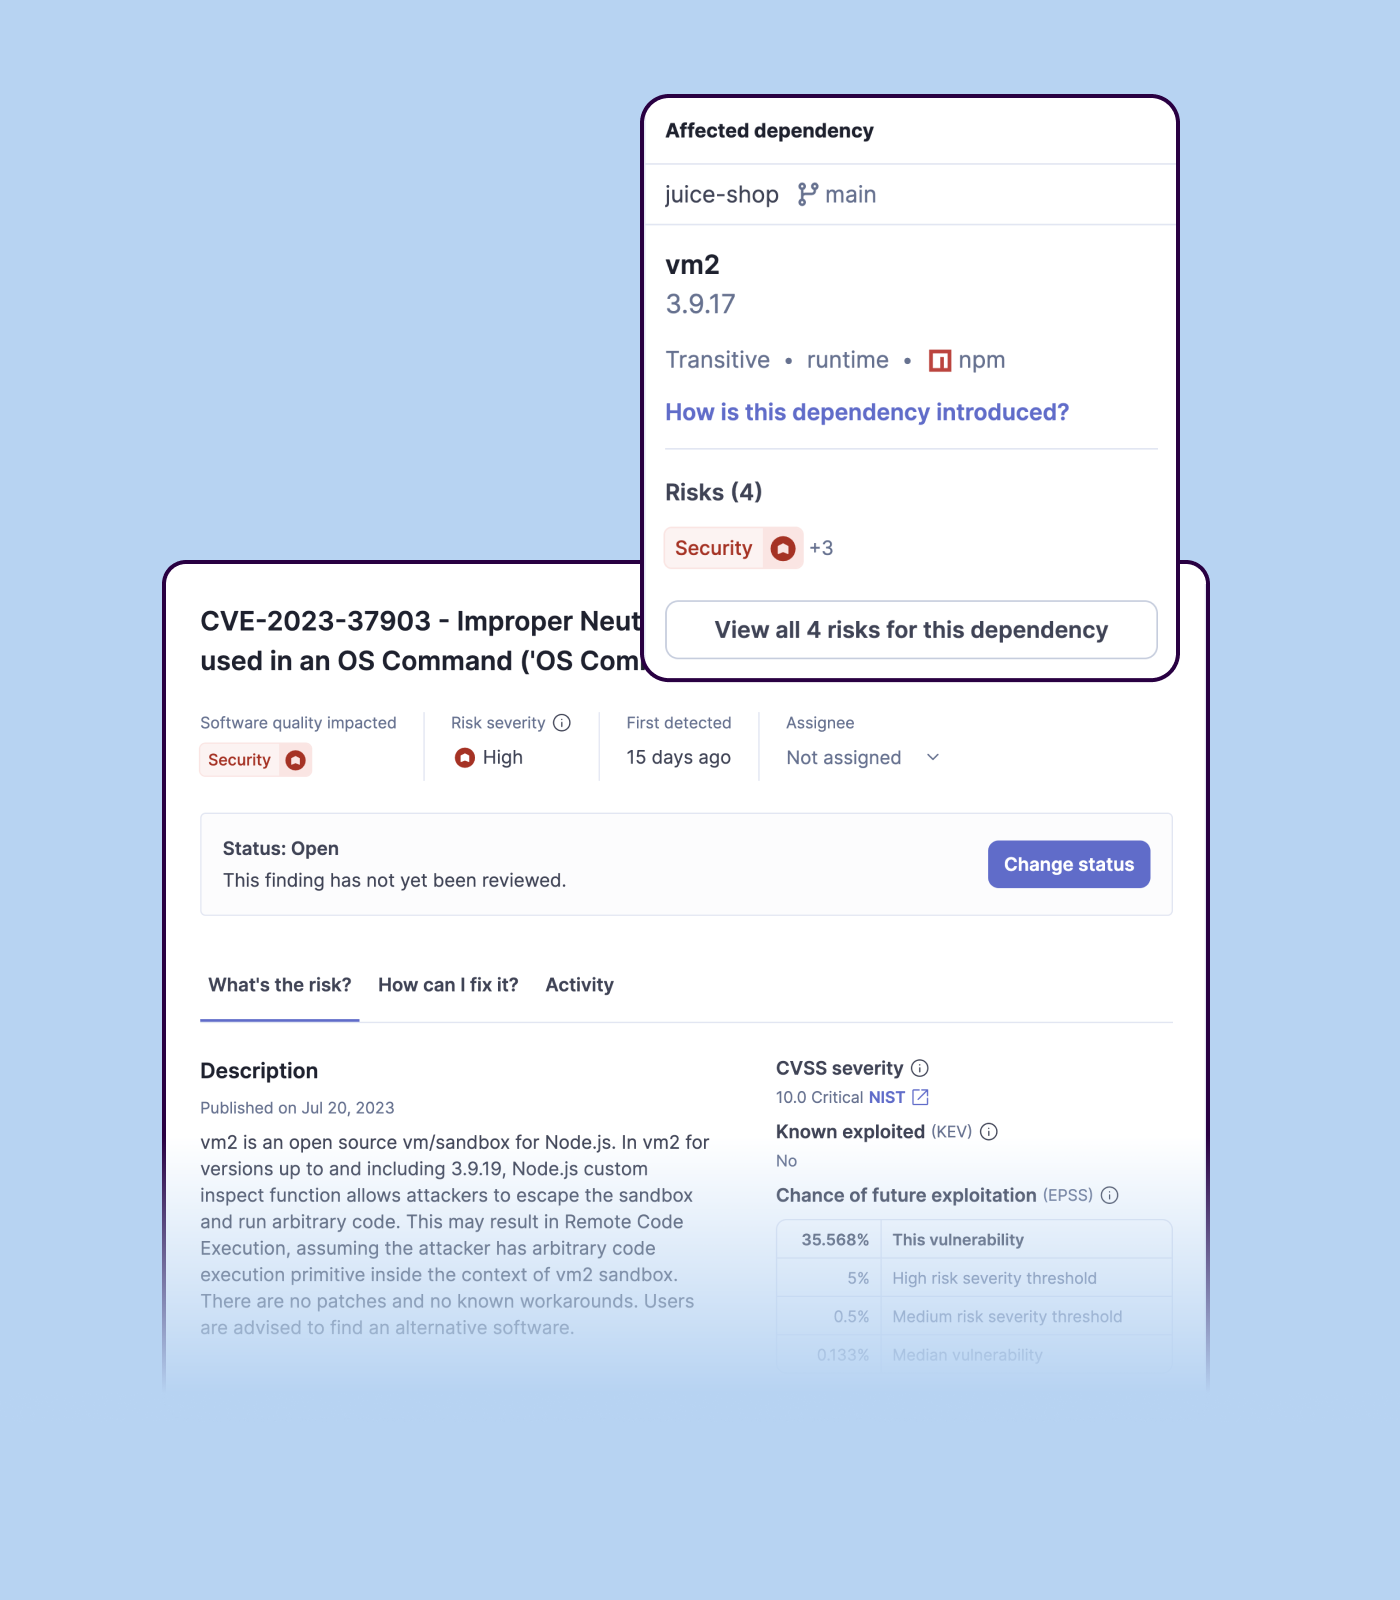
Detecting bugs and vulnerabilities: SonarQube can identify a wide range of bugs and vulnerabilities in code, such as null pointer exceptions, SQL injection, and cross-site scripting (XSS) attacks. It uses static analysis to analyze the code and identify potential issues, and it can also integrate with dynamic analysis tools to provide even more detailed analysis.
Measuring code quality: SonarQube can measure a wide range of code quality metrics, such as cyclomatic complexity, duplicated code, and code coverage. This can help teams understand the quality of their code and identify areas that need improvement.
Providing actionable insights: SonarQube provides detailed information about issues in the code, including the file and line number where the issue occurs and the severity of the issue. This makes it easy for developers to understand and address issues in the code.
Integrating with other tools: SonarQube can be integrated with a wide range of development tools and programming languages, such as Git, Maven, and Java. This allows teams to use SonarQube in their existing development workflow and take advantage of its powerful code analysis capabilities.
Managing technical debt: SonarQube provides metrics and insights on the technical debt on the codebase, enabling teams to better prioritize issues to improve the quality of the code.
Compliance with coding standards: SonarQube can check the code against industry standards like OWASP, CWE and more, making sure the code is compliant with security and coding standards.
And while powerful, building tailored dashboards with organ-specific metrics (such as energy load variance across regions) can be difficult to navigate. The UI isn't as drag-and-drop easy, and query-based widgets typically involve some trial and error for non-devs.
Alerts may be hypersensitive or over general. I We often get a spam of non-critical alerts while doing load testing, all overhauling to me alone and making it difficult to identify actual issues especially in energy systems where spikes are very common.
With our expanding fleet of Iot devices, the per-host pricing model is becoming expensive, quickly. More detailed billing based on microservices, or that works at sensor level, would make it more adaptable for energy platforms.
Importing a new custom quality profile on SonarQube is a bit tricky, it can be made easier
Every second time when we want to rerun the server, we have to restart the whole system, otherwise, the server stops and closes automatically
When we generate a new report a second time and try to access the report, it shows details of the old report only and takes a lot of time to get updated with the details of the new and fresh report generated
The only issue that we have had with New Relic is that the price might be a little expensive for smaller companies. The amount of data you store in New Relic impacts the cost, and can get away from you if you don't work closely with the vendor. Overall though the application is top notch.
I have given this much rating as I am used New Relic in different sectors and for different use cases like its K8s monitoring, infra monitoring, full stack monitoring as compare to other tools New Relic gives data in a formatted and connected way, and also it is giving us value for money. It also launches new features day by day which helps users to track the issue very quickly. It also supports OTel integrations which is the latest trend of observability tools. thats why I had given this much rating to New Relic.
The support team has been really helpful and resolved most of the issues on time. However, for a couple of issues, several follow-ups were needed to elicit a reasonable response. The issue was deeply technical and could have been investigated only by their Architects, and bringing them into the ticket took longer than needed
We we easily able to integrate the SonarQube steps into our TFS process via the Microsoft Marektplace, we didn't have the need to call SonarQube support. We've used their online documentation and community forum if we ran into any issues.
It's better to start by implementing New Relic in one project and test everything. Try to follow best recommended practices and read all the official documentation. Everything seems well tested. Then, start by installing agents to the rest of your projects and keep a close look to all logs and metrics New Relic gives you.
Data Dog has solutions that look more attractive, but not at their price point. We have also tried to build a solution straight from the Cloud, where our business is built, but some things are too hard to replicate. This shows that New Relic is useful and helps our efficiency.
SonarQube is an open-source. It's a scalable product. The costs for this application, for the kind of job it does, are pretty descent. Pipeline scan is more secured in SonarQube. Its a very good tool and its support multiple languages. Its main core competency is of static code analysis and that is why SonarQube exists and it does it exceedingly well. The quality of scan on code convention, best practices, coding standards, unit test coverage etc makes them one of the best competent tool in the market
Positive ROI from the standpoint of flagging several issues that would have otherwise likely been unaddressed and caused more time to be spent closer to launch
Slightly positive ROI from time-saving perspective (it's an automated check which is nice, but depending on the issues it finds, can take developers time to investigate and resolve)