Tableau Server allows Tableau Desktop users to publish dashboards to a central server to be shared across their organizations. The product is designed to facilitate collaboration across the organization. It can be deployed on a server in the data center, or it can be deployed on a public cloud.
$12
Per User Per Month
ThoughtSpot
Score 8.1 out of 10
N/A
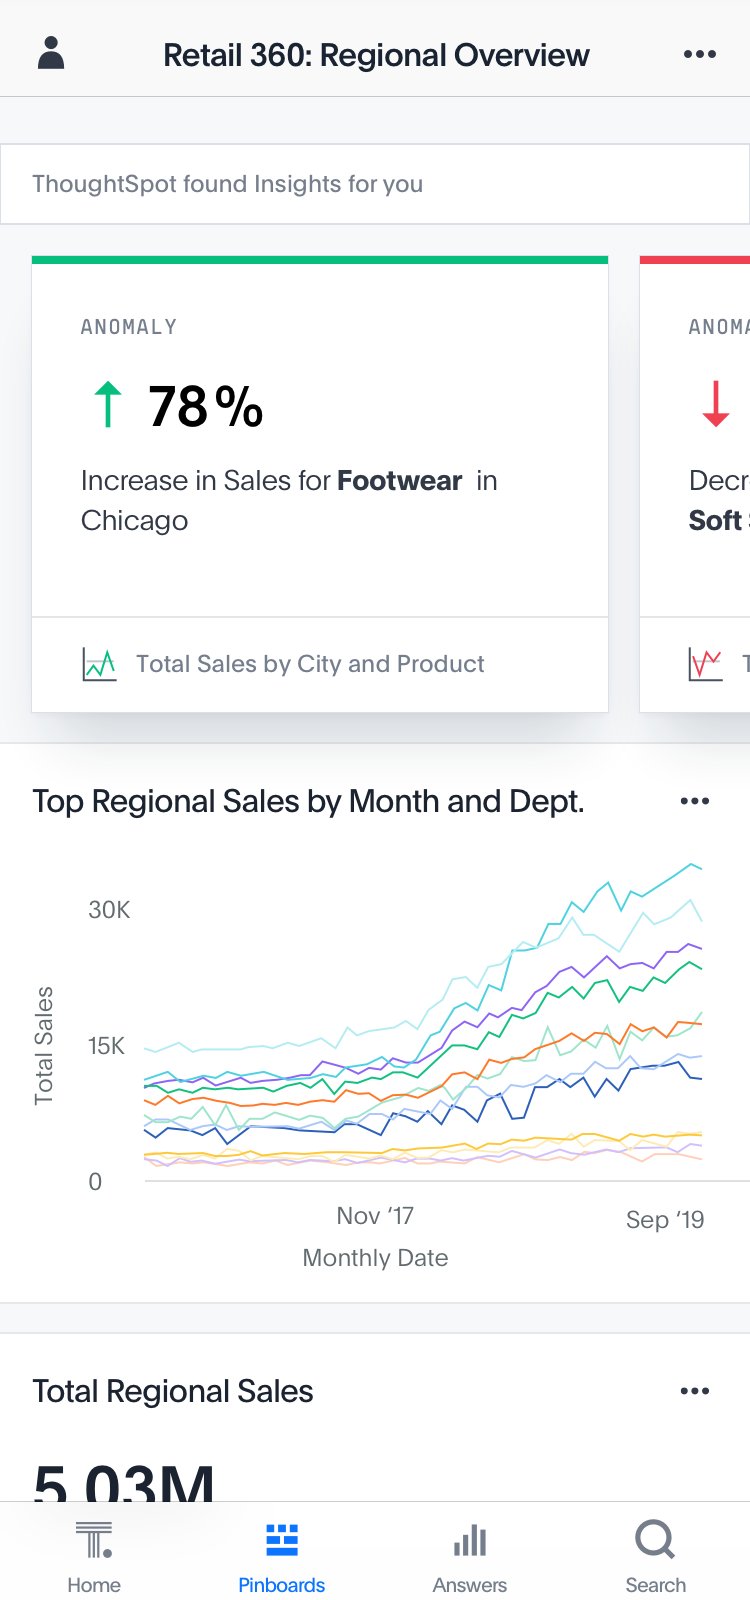
ThoughtSpot is an AI-Powered Analytics company, that aims to create a more fact-driven world with an easy to use analytics platform. ThoughtSpot enables users to leverage natural language search powered by large language models to ask and answer data questions. Users within an organization can limitlessly engage with live data in any popular cloud data platform to create and interact with granular, hyper…
$95
per month
Pricing
Tableau Server
ThoughtSpot
Editions & Modules
Viewer
$12.00
Per User Per Month
Explorer
$35.00
Per User Per Month
Creator
$70.00
Per User Per Month
ThoughtSpot Analytics Team
$95
per month flat subscription
ThoughtSpot Analytics Pro
starts at $30,000
per year consumption-based pricing, pay for what you use
ThoughtSpot Analytics Enterprise
contact for pricing
per year consumption-based pricing, pay for what you use
ThoughtSpot Everywhere Pro
contact for pricing
per year consumption-based pricing, pay for what you use
ThoughtSpot Everywhere Enterprise
contact for pricing
per year consumption-based pricing, pay for what you use
Tableau is a stable and time tested product which can handle hundreds and thousands of users and a huge amount of content, plus tableau has also introduced a web authoring tool which you can [use to] edit dashboards using your browser.
While Thoughtspot runs on "keyword search" technology, it needs the users to import data and build the data model in thoughtspot which creates a duplicate copy of your data mart. Answer Rocket uses "NLP (Natural Language Processing)" to work on your existing database and while …
Tableau Server is well suited for a data warehouse build and handling big data. Tableau data aggregation, transformation, clustering capability is powerful and easy to implement. The choice of charts and visualisation tools is outstanding. Customisation and dynamic data visualisation capability is superb. The user interface takes some time getting used to.
Well suited for my clients for a Macro view of business insights, credit risk, ESG insights, etc. However, I think ThoughtSpot needs to make exploring underlying data easier, adding a feature where you can click on charts and filters will help users and especially business users to easily understand the granularities as well.
It's good at doing what it is designed for: accessing visualizations without having to download and open a workbook in Tableau Desktop. The latter would be a very inefficient method for sharing our metrics, so I am glad that we have Tableau Server to serve this function.
Publishing to Tableau Server is quick and easy. Just a few clicks from Tableau Desktop and a few seconds of publishing through an average speed network, and the new visualizations are live!
Seeing details on who has viewed the visualization and when. This is something particularly useful to me for trying to drive adoption of some new pages, so I really appreciate the granularity provided in Tableau Server
Beautiful visualizations. The visuals are distinct, clean, and easy to discern from one another.
Intelligent querying functionality. When looking to manipulate the data, the search function makes it easy to manipulate the features in the data, along with aggregating them in the way you'd like.
Embedding! It has been a smooth process thus far for our product & technical teams to work with ThoughtSpot and bring it into our product.
Tableau Server has had some issue handling some of our larger data sets. Our extract refreshes fail intermittently with no obvious error that we can fix
Tableau Server has been hard to work with before they launched their new Rest API, which is also a little tricky to work with
It simply is used all the time by more and more people. Migrating to something else would involve lots of work and lots of training. The renewal fee being fair, it simply isn't worth migrating to a different tool for now.
I give it just waiting because passport is brilliant and it has helped our organisation In advancing to the next stage in the age of AI. It has allowed or non-tech people to better service and clients in a cost-effective way. George port has allowed us to create new products for us and for our clients increasing our revenue streams and reducing clients churn
Tableau Server is unbeatable at creating easy to use, interactive dashboards for busy executives. The software also saves time for the busy analyst that is tired of always using Excel. Tableau Server is a head and shoulders improvement over Excel.
The tool is easy to use if you know what you are doing and looking for. I know as they work towards improvements and simple language it will become even easier, but as of now they are doing a great job but there is room for improvement.
Our instance of Tableau Server was hosted on premises (I believe all instances are) so if there were any outages it was normally due to scheduled maintenance on our end. If the Tableau server ever went down, a quick restart solved most issues
While there are definitely cases where a user can do things that will make a particular worksheet or dashboard run slowly, overall the performance is extremely fast. The user experience of exploratory analysis particularly shines, there's nothing out there with the polish of Tableau.
We have consistently had highly satisfactory results every time we've reached out for help. Our contractor, used for Tableau server maintenance and dashboard development is very technically skilled. When he hits a roadblock on how to do something with Tableau, the support staff have provided timely and useful guidance. He frequently compares it to Cognos and says that while Cognos has capabilities Tableau doesn't, the bottom line value for us is a no-brainer
I give it this meeting because the team is not only help able to help us in the current solutions but also amazing and taking feedback and feeding it back to their development team which includes more products and features into ThoughtSpot
In our case, they hired a private third party consultant to train our dept. It was extremely boring and felt like it dragged on. Everything I learned was self taught so I was not really paying attention. But I do think that you can easily spend a week on the tool and go over every nook and cranny. We only had the consultant in for a day or two.
The Tableau website is full of videos that you can follow at your own pace. As a very small company with a Tableau install, access to these free resources was incredibly useful to allowing me to implement Tableau to its potential in a reasonable and proportionate manner.
Implementation was over the phone with the vendor, and did not go particularly well. Again, think this was our fault as our integration and IT oversight was poor, and we made errors. Would they have happened had a vendor been onsite? Not sure, probably not, but we probably wouldn't have paid for that either
Today, if my shop is largely Microsoft-centric, I would be hard pressed to choose a product other than Power BI. Tableau was the visualization leader for years, but Microsoft has caught up with them in many areas, and surpassed them in some. Its ability to source, transform, and model data is superior to Tableau. Tableau still has the lead in some visualizations, but Power BI's rise is evidenced by its ever-increasing position in the leadership section of the Gartner Magic Quadrant.
We also explored Tableau Ask Data. Tableau is our standard for BI in our organization. We want to use the smallest amount of tools in our company to have the best adaption. ThoughSpot will fill a few gaps that we have with our current set up and will also enhance out offering for our employees in the transition of being more data driven within in near future
Because it is very reliable, inside the situation, we need strong internet connection to access a lot of data but easily never had any downtime except during the upgrades
Tableau does take dedicated FTE to create and analyze the data. It's too complex (and powerful) a product not to have someone dedicated to developing with it.
There are some significant setup for the server product.
Once sever setup is complete, it's largely "fire and forget" until an update is necessary. The server update process is cumbersome.
Saved an immense amount of time for a sole analyst on a team by enabling the end-users to ask their own questions instead of always turning to her, allowing her to focus on other priorities.
Immediate answer to question on second POC that led to personnel changes.