
Astrato Analytics' robust no-code application is a tremendous value.

Use Cases and Deployment Scope
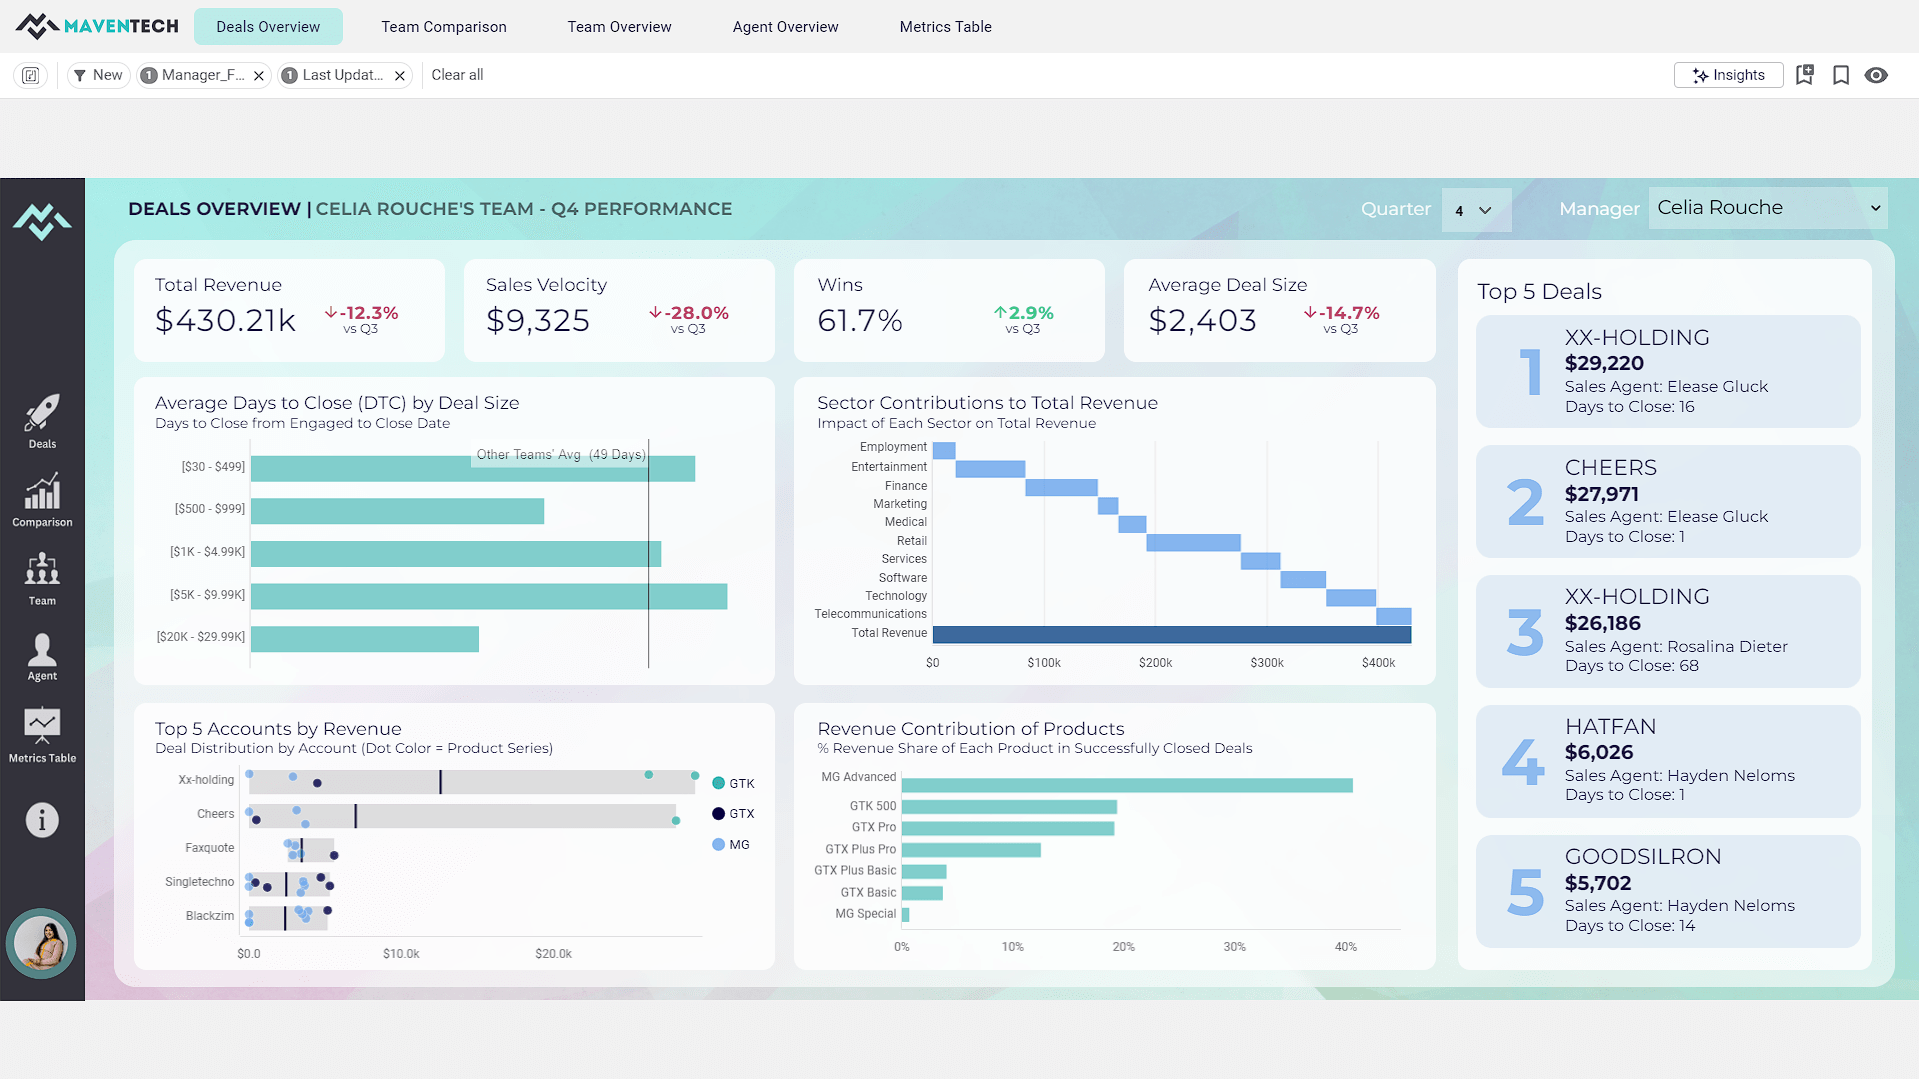
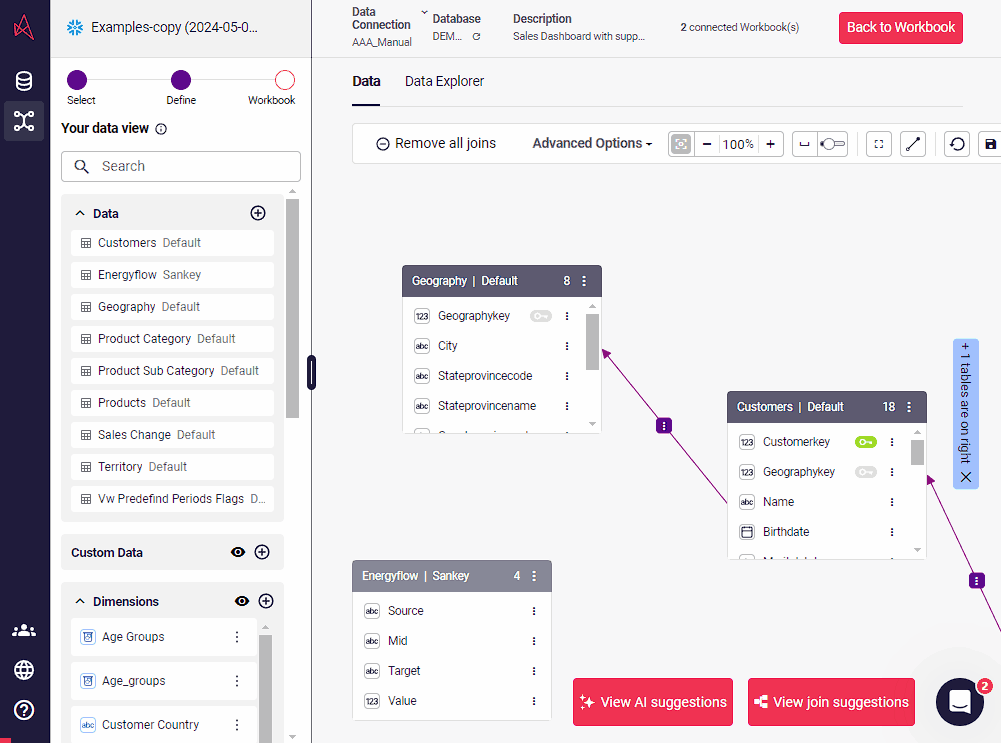
We have used Astrato Analytics to build a SaaS application that is fully integrated with our Snowflake data platform. Being a small business, with limited staff and financial resources we needed a solution that was affordable and easy to use, yet was feature-rich and could scale large healthcare datasets. We have built several modules within our SaaS application pulling from various sets of healthcare data addressing several different use cases in the healthcare supply chain space.
Pros
- Astrato Analytics has done a fantastic job of simplifying the process of creating advanced analytics. The "no-code" feature-rich library of options allows the non-technical user to build sophisticated analytics.
- Astrato Analytics' customer service feels much more like a partnership. They are always willing to jump in, assess, teach, and provide guidance on the best way to approach developing new features within our platform.
- Astrato Analytics has created exceptional value combining their extensive offering and extremely reasonable pricing.
Cons
- Would benefit by an enhanced and centralized ability to control themes.
Return on Investment
- Utilizing Astrato Analytics has allowed us to create a SaaS application that we would have otherwise not been able to do given our company size and resources. The value provided has been transformational.
Usability
Alternatives Considered
Microsoft Power BI
Other Software Used
Snowflake