Datadog is a monitoring service for IT, Dev and Ops teams who write and run applications at scale, and want to turn the massive amounts of data produced by their apps, tools and services into actionable insight.
$18
per month per host
NinjaOne
Score 9.1 out of 10
N/A
The NinjaOne Unified IT Operations Platform delivers endpoint management, autonomous patching, backup, and remote access. NinjaOne aims to give organizations' employees a great technology experience to work faster, smarter, and easier while IT teams modernize and improve efficiency.
N/A
Pricing
Datadog
NinjaOne
Editions & Modules
Log Management
$1.27
per month (billed annually) per host
Infrastructure
$15.00
per month (billed annually) per host
Standard
$18
per month per host
Enterprise
$27
per month per host
DevSecOps Pro
$27
per month per host
APM
$31.00
per month (billed annually) per host
DevSecOps Enterprise
$41
per month per host
No answers on this topic
Offerings
Pricing Offerings
Datadog
NinjaOne
Free Trial
Yes
Yes
Free/Freemium Version
Yes
No
Premium Consulting/Integration Services
No
No
Entry-level Setup Fee
Optional
No setup fee
Additional Details
Discount available for annual pricing. Multi-Year/Volume discounts available (500+ hosts/mo).
NinjaOne is a subscription typically billed annually and sold through channel partners. Monthly billing is nonstandard but billed on a case by case basis.
Datadog may be better suited for teams that have a more out-of-the-box infrastructure, on the primary platforms Datadog supports. You may also have better results if you have a bigger team dedicated to devops and/or a bigger budget. We found that trying to adapt it to our use case (small team, .NET on AWS Fargate) wasn't feasible. We continually ran into roadblocks that required us to dig through documentation (and at times, having to figure out some documentation was wrong), go back and forth with support, and in my opinion, waste money on excessive and unintended usages due to opaque pricing models and inaccurate usage reports, as well as broken/non-functional rate sampling controls.
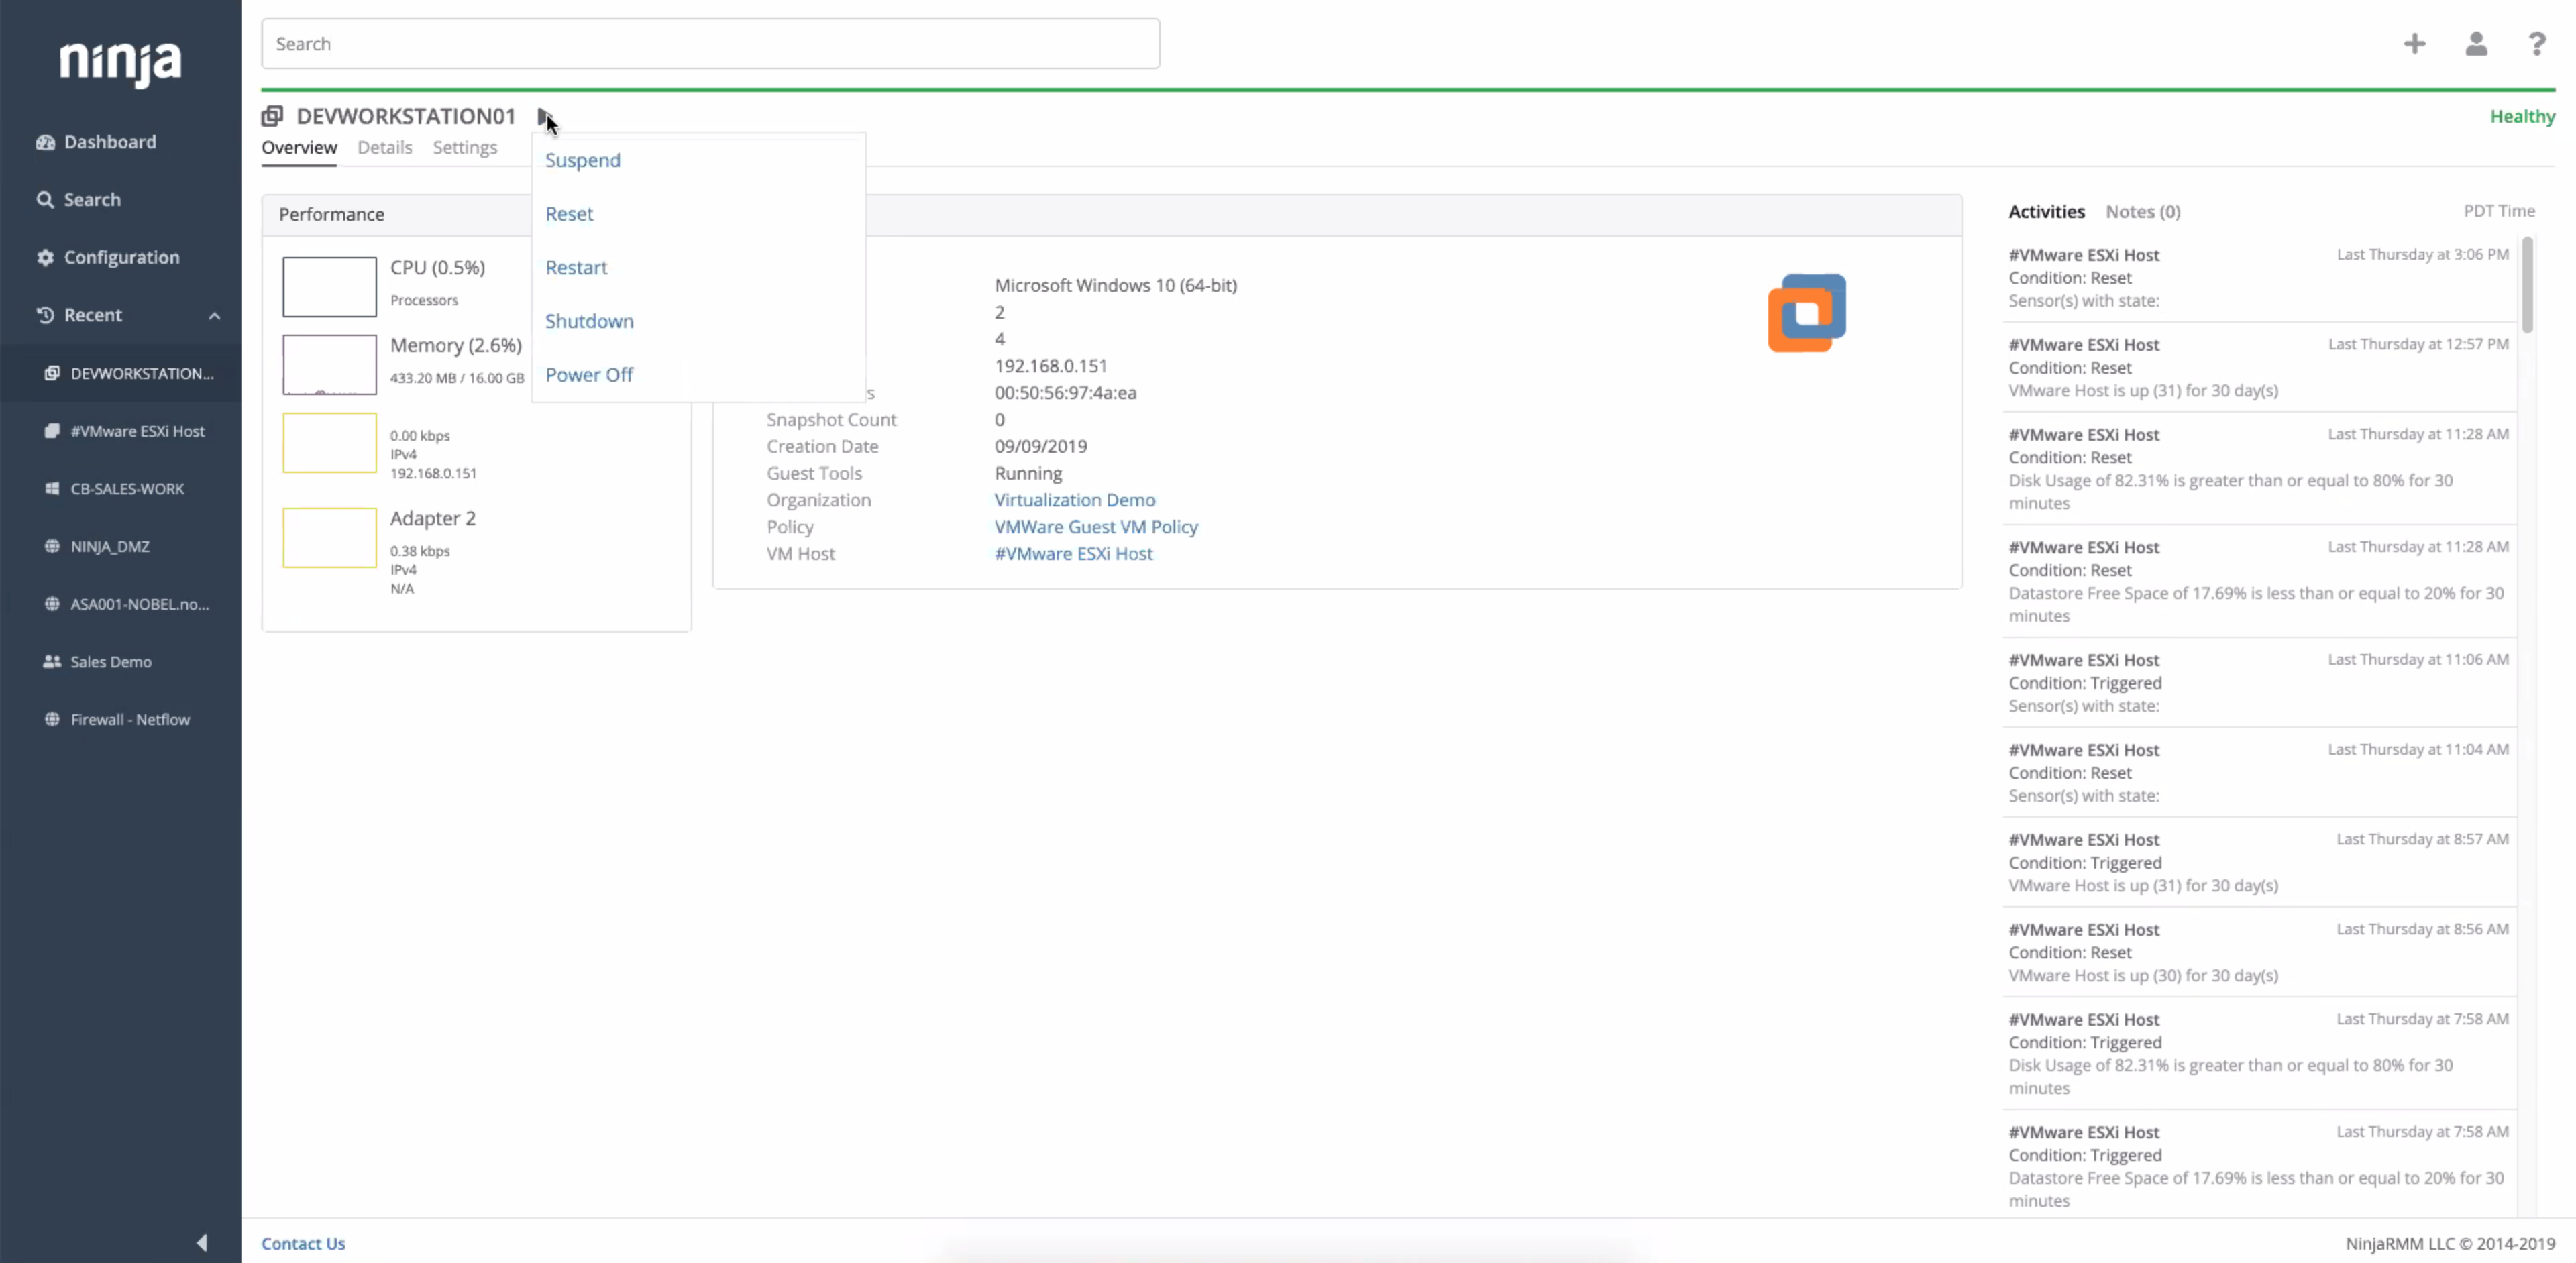
Well suited for support and management of a large fleet of endpoints, particularly across multiple regions and locations. Its well suited for MSPs for this reason. Its also effective for managing patching and updates for server infrastructure, where some other products are unable to manage. Its useful being able to access these features across multiple networks and domains. There is an option to monitor network equipment such as switches, but it didn't provide any information that wasn't already provided in the switches cloud portal.
The thing which Datadog does really well, one of them are its broad range of services integrations and features which makes it one step observability solution for all. We can monitor all types of our application, infrastructure, hosts, databases etc with Datadog.
Its custom dashboard feature which helps us to visualize the data in a better way . It supports different types of charts through those charts we can create our dashboard more attractive.
Its AI powered alerting capability though that we can easily identify the root cause and also it has a low noise alerting capability which means it correlated the similar type of issues.
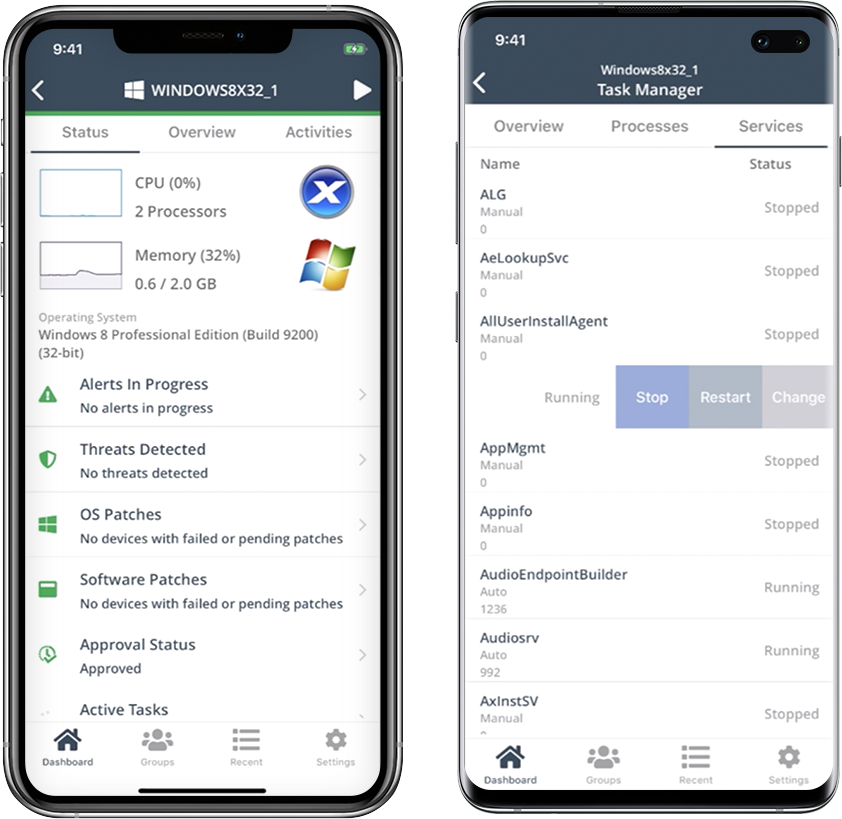
Remote connections: the NinjaRemote client is spectacular and very easy to use and navigate. It quickly connects to customer systems so my engineers are able to work. As a bonus, they also offer a really good mobile app to connect to client systems.
Antivirus: Bitdefender Endpoint Protection is built directly into the NinjaOne portal. This makes deploying and maintaining AV very easy.
OS Patching: NinjaOne makes it very easy to handle patching across multiple clients and locations. It is very easy to use and doesn't take long to set up.
Support: NinjaOne support is always very prompt and helpful.
Documentation: the NinjaOne Dojo is a one-stop shop for all of your FAQs, guides, and forum needs. You can find almost anything here to help you deploy and maintain NinjaOne.
Automation Library: NinjaOne comes preloaded with a large number of ready-to-go automations. They also provide you with a scripting module to create your own.
Alert windows cause lag in notifications (e.g. if the alert window is X errors in 1 hour, we won't get alerted until the end of the 1 hour range)
I would appreciate more supportive examples for how to filter and view metrics in the explorer
I would like a more clear interface for metrics that are missing in a time frame, rather than only showing tags/etc. for metrics that were collected within the currently viewed time frame
We already did. After evaluating many platforms, we found the cybersecurity of the company, its development direction, and the performance of the platform to be far superior at its price point.
There are so many features that it can be hard to figure out where you need to go for your own use case. For example, RUM monitoring us buried in a "Digital Experience" sidebar setting when this is one of our key use cases that I sometimes struggle to find in the application. It appears that ECS + Fargate monitoring was recently released which is great because we had to build a lambda reporting solution for ephemeral task monitoring. But this new feature was never on my radar until I starting clicking around the application.
NinjaOne is easy to use, intuitive, and provides great value for our organization specifically with inventory tracking and patch management. There is also a wealth of control from an RMM perspective that we have over our fleet of hardware as well as customer websites. The communications with our account representative is outstanding as well. I'd highly recommend for organizations to engage with NinjaOne, and this is from a user who's used other RMM's and related software offerings at different MSP's. Go NinjaOne!
The support team usually gets it right. We did have a rather complicate issue setting up monitoring on a domain controller. However, they are usually responsive and helpful over chat. The downside would be I don’t think they have any phone support. If that is important to you this might not be a good fit.
Ninja support has always been top notch. They have always been responsive and efficient both in troubleshooting issues or talking to me at a high-level about on-going improvements or needed changes. Both sales and Technical support has been good and I've been very pleased with the Customer service we have received from Ninja
Easy to learn and all of the functions and features were easy to learn. Once I started learning all of the features and functions, it made my everyday tasks much easier and more productive. The user interface is very easy to use. If I did have any questions, the Ninja Dojo was a big help.
It was nice and self paced learning. The sections were easy to understand and the functionality was very worthwhile. The online training was very easy to learn and intuitive. I did not feel the need to ask for any clarification or assistance with any of the sections. I am still learning a lot of the functions but fined it very easy to use.
Our logs are very important, and Datadog manages them exceptionally well. We frequently use Datadog services for our investigations. Use case: Monitor your apps, infrastructure, APIs, and user experience.
Key features:
Logs, metrics, and APM (Application Performance Monitoring)
Real-time alerting and dashboards
Supports Kubernetes, AWS, GCP, and other integrations
RUM (Real User Monitoring) and Synthetics
✅ Best for backend, server, and distributed systems monitoring.
NinjaOne has the most rounded set of features however I believe all of the programs have there own plus and minus points. We use a mixture of programs however NinjaOne is the most heavily used.